Deck 21: The Theory of Consumer Choice
Full screen (f)
Question
Question
Figure 21-1
The downwardsloping line on the figure represents a consumer's budget constraint.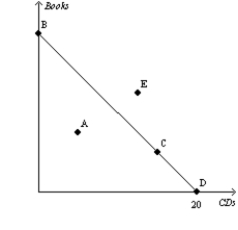
Refer to Figure 21-1. A consumer who chooses to spend all of her income could be at which point(s) on the figure?
A) A only
B) E only
C) B, C, or D only
D) A, B, C, or D only
The downwardsloping line on the figure represents a consumer's budget constraint.
Refer to Figure 21-1. A consumer who chooses to spend all of her income could be at which point(s) on the figure?
A) A only
B) E only
C) B, C, or D only
D) A, B, C, or D only
Question
Question
Figure 21-2
The downwardsloping line on the figure represents a consumer's budget constraint.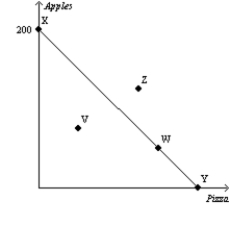
Refer to Figure 21-2. A consumer who chooses to spend all of her income could be at which point(s) on the figure?
A) V only
B) Z only
C) V, W, X, or Y only
D) W, X, or Y only
The downwardsloping line on the figure represents a consumer's budget constraint.
Refer to Figure 21-2. A consumer who chooses to spend all of her income could be at which point(s) on the figure?
A) V only
B) Z only
C) V, W, X, or Y only
D) W, X, or Y only
Question
Question
Question
Figure 21-2
The downwardsloping line on the figure represents a consumer's budget constraint.
Refer to Figure 21-2. Which points are affordable?
A) W, X, and Y only
B) Z only
C) V, W, X, and Y only
D) V, W, X, Y, and Z
The downwardsloping line on the figure represents a consumer's budget constraint.
Refer to Figure 21-2. Which points are affordable?
A) W, X, and Y only
B) Z only
C) V, W, X, and Y only
D) V, W, X, Y, and Z
Question
Figure 21-1
The downwardsloping line on the figure represents a consumer's budget constraint.
Refer to Figure 21-1. If the consumer's income is $140, then what is the price of a CD?
A) $3
B) $5
C) $7
D) $9
The downwardsloping line on the figure represents a consumer's budget constraint.
Refer to Figure 21-1. If the consumer's income is $140, then what is the price of a CD?
A) $3
B) $5
C) $7
D) $9
Question
Question
Question
Figure 21-1
The downwardsloping line on the figure represents a consumer's budget constraint.
Refer to Figure 21-1. All of the points identified on the figure represent affordable consumption options with the exception of
A) A.
B) E.
C) A and E.
D) None of the above are correct. All of the points identified on the figure are affordable.
Question
Question
Question
Figure 21-2
The downwardsloping line on the figure represents a consumer's budget constraint.
Refer to Figure 21-2. If the consumer's income is $100, then what is the price of an apple?
A) $0.50
B) $0.75
C) $1.00
D) $1.25
The downwardsloping line on the figure represents a consumer's budget constraint.
Refer to Figure 21-2. If the consumer's income is $100, then what is the price of an apple?
A) $0.50
B) $0.75
C) $1.00
D) $1.25
Question
Question
Figure 21-1
The downwardsloping line on the figure represents a consumer's budget constraint.
Refer to Figure 21-1. If the price of a CD is $12, then the consumer's income amounts to
A) $140.
B) $180.
C) $210.
D) $240.
The downwardsloping line on the figure represents a consumer's budget constraint.
Refer to Figure 21-1. If the price of a CD is $12, then the consumer's income amounts to
A) $140.
B) $180.
C) $210.
D) $240.
Question
Question
Question
Figure 21-2
The downwardsloping line on the figure represents a consumer's budget constraint.
Refer to Figure 21-2. Which of the following statements is not correct?
A) Points W, X, and Y all cost the consumer the same amount of money.
B) Point Z is unaffordable for the consumer given his budget constraint.
C) Point V costs less than point Z.
D) Points W, X, and Y give the consumer the same level of satisfaction.
Question
Question
Figure 21-5
(a) (b)
Refer to Figure 21-5. In graph (a), what is the price of good X relative to the price of good Y (i.e., PX/PY)?
A) 1/3
B) 1/4
C) 3
D) 4
(a) (b)
Refer to Figure 21-5. In graph (a), what is the price of good X relative to the price of good Y (i.e., PX/PY)?
A) 1/3
B) 1/4
C) 3
D) 4
Question
Figure 21-3
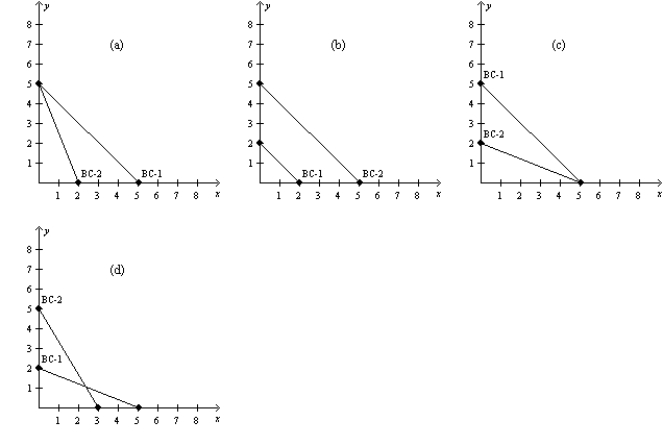
In each case, the budget constraint moves from BC-1 to BC-2.
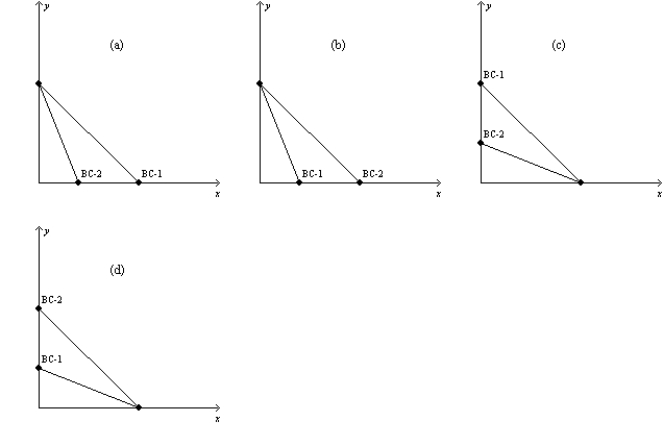
Refer to Figure 21-3. Which of the graphs in the figure reflects a decrease in the price of good Y only?
A) graph a
B) graph b
C) graph c
D) graph d
In each case, the budget constraint moves from BC-1 to BC-2.
Refer to Figure 21-3. Which of the graphs in the figure reflects a decrease in the price of good Y only?
A) graph a
B) graph b
C) graph c
D) graph d
Question
Figure 21-5
(a) (b)
Refer to Figure 21-5. Assume that a consumer faces the budget constraint shown in graph (a) in January and the budget constraint shown in graph (b) in February. If the consumer's income has remained constant, then what has happened to prices between January and February?
A) The price of X has fallen, but there could not have been a change in the price of Y.
B) The price of Y has fallen, but there could not have been a change in the price of X.
C) The price of X has fallen, and the price of Y has risen.
D) The price of Y has fallen, and the price of X has risen.
Question
Figure 21-5
(a) (b)
Refer to Figure 21-5. In graph (a), what is the price of good Y relative to the price of good X (i.e., Py/Px)?
A) 1/3
B) 1/4
C) 3
D) 4
(a) (b)
Refer to Figure 21-5. In graph (a), what is the price of good Y relative to the price of good X (i.e., Py/Px)?
A) 1/3
B) 1/4
C) 3
D) 4
Question
Figure 21-5
(a) (b)
Refer to Figure 21-5. In graph (b), what is the price of good Y relative to the price of good X (i.e., PY/PX)?
A) 1
B) 1/3
C) 3
D) 10
(a) (b)
Refer to Figure 21-5. In graph (b), what is the price of good Y relative to the price of good X (i.e., PY/PX)?
A) 1
B) 1/3
C) 3
D) 10
Question
Figure 21-5
(a) (b)
Refer to Figure 21-5. In graph (a), if income is equal to $200, then the price of good Y is
A) $3.
B) $5.
C) $7.
D) $10.
(a) (b)
Refer to Figure 21-5. In graph (a), if income is equal to $200, then the price of good Y is
A) $3.
B) $5.
C) $7.
D) $10.
Question
Figure 21-6 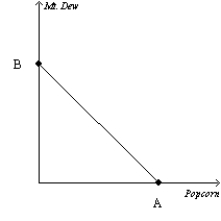
Refer to Figure 21-6. Suppose a consumer has $100 in income, the price of popcorn is $2, and the value of B is 100. What is the price of Mt. Dew?
A) $1
B) $2
C) $5
D) $100
Refer to Figure 21-6. Suppose a consumer has $100 in income, the price of popcorn is $2, and the value of B is 100. What is the price of Mt. Dew?
A) $1
B) $2
C) $5
D) $100
Question
Figure 21-4
In each case, the budget constraint moves from BC-1 to BC-2.
Refer to Figure 21-4. Which of the graphs in the figure could reflect an increase in income?
A) graph a
B) graph b
C) graph d
D) None of the above is correct.
In each case, the budget constraint moves from BC-1 to BC-2.
Refer to Figure 21-4. Which of the graphs in the figure could reflect an increase in income?
A) graph a
B) graph b
C) graph d
D) None of the above is correct.
Question
Figure 21-3
In each case, the budget constraint moves from BC-1 to BC-2.
Refer to Figure 21-3. Which of the graphs in the figure could reflect a simultaneous decrease in the price of good X and increase in the price of good Y? (i) graph a
(ii) graph b
(iii) graph c
(iv) graph d
A) (ii) only
B) (iii) only
C) (ii) or (iv) only
D) None of the above is correct.
Question
Figure 21-5
(a) (b)
Refer to Figure 21-5. In graph (a), if income is equal to $200, then the price of good X is
A) $12.
B) $16.
C) $20.
D) $24.
(a) (b)
Refer to Figure 21-5. In graph (a), if income is equal to $200, then the price of good X is
A) $12.
B) $16.
C) $20.
D) $24.
Question
Figure 21-3
In each case, the budget constraint moves from BC-1 to BC-2.
Refer to Figure 21-3. Which of the graphs in the figure reflects an increase in the price of good Y only?
A) graph a
B) graph b
C) graph c
D) graph d
In each case, the budget constraint moves from BC-1 to BC-2.
Refer to Figure 21-3. Which of the graphs in the figure reflects an increase in the price of good Y only?
A) graph a
B) graph b
C) graph c
D) graph d
Question
Figure 21-4
In each case, the budget constraint moves from BC-1 to BC-2.
Refer to Figure 21-4. Which of the graphs in the figure could reflect a simultaneous increase in the price of good X and decrease in the price of good Y?
A) graph a
B) graph b
C) graph c
D) graph d
In each case, the budget constraint moves from BC-1 to BC-2.
Refer to Figure 21-4. Which of the graphs in the figure could reflect a simultaneous increase in the price of good X and decrease in the price of good Y?
A) graph a
B) graph b
C) graph c
D) graph d
Question
Figure 21-2
The downwardsloping line on the figure represents a consumer's budget constraint.
Refer to Figure 21-2. Which of the following statements is correct?
A) Points W, X, and Y all cost the consumer the same amount of money.
B) Point V is unaffordable for the consumer given his budget constraint.
C) Point Z costs less than point V.
D) Points W, X, and Y give the consumer the same level of satisfaction.
Question
Figure 21-5
(a) (b)
Refer to Figure 21-5. In graph (b), if income is equal to $420, then the price of good Y is
A) $1.
B) $3.
C) $10.
D) $30.
(a) (b)
Refer to Figure 21-5. In graph (b), if income is equal to $420, then the price of good Y is
A) $1.
B) $3.
C) $10.
D) $30.
Question
Figure 21-5
(a) (b)
Refer to Figure 21-5. In graph (b), what is the price of good X relative to the price of good Y (i.e., Px/Py)?
A) 1
B) 1/3
C) 3
D) 10
(a) (b)
Refer to Figure 21-5. In graph (b), what is the price of good X relative to the price of good Y (i.e., Px/Py)?
A) 1
B) 1/3
C) 3
D) 10
Question
Figure 21-3
In each case, the budget constraint moves from BC-1 to BC-2.
Refer to Figure 21-3. Which of the graphs in the figure could reflect a simultaneous decrease in the prices of both goods? (i) graph a
(ii) graph b
(iii) graph c
(iv) graph d
A) (i) only
B) (iv) only
C) (ii) or (iii) only
D) None of the above is correct.
Question
Figure 21-3
In each case, the budget constraint moves from BC-1 to BC-2.
Refer to Figure 21-3. Which of the graphs in the figure reflects a decrease in the price of good X only?
A) graph a
B) graph b
C) graph c
D) graph d
In each case, the budget constraint moves from BC-1 to BC-2.
Refer to Figure 21-3. Which of the graphs in the figure reflects a decrease in the price of good X only?
A) graph a
B) graph b
C) graph c
D) graph d
Question
Figure 21-4
In each case, the budget constraint moves from BC-1 to BC-2.
Refer to Figure 21-4. Which of the graphs in the figure could reflect a decrease in income?
A) graph a
B) graph b
C) graph d
D) None of the above is correct.
In each case, the budget constraint moves from BC-1 to BC-2.
Refer to Figure 21-4. Which of the graphs in the figure could reflect a decrease in income?
A) graph a
B) graph b
C) graph d
D) None of the above is correct.
Question
Figure 21-3
In each case, the budget constraint moves from BC-1 to BC-2.
Refer to Figure 21-3. Which of the graphs in the figure reflects an increase in the price of good X only?
A) graph a
B) graph b
C) graph c
D) graph d
In each case, the budget constraint moves from BC-1 to BC-2.
Refer to Figure 21-3. Which of the graphs in the figure reflects an increase in the price of good X only?
A) graph a
B) graph b
C) graph c
D) graph d
Question
Figure 21-5
(a) (b)
Refer to Figure 21-5. In graph (b), if income is equal to $420, then the price of good X is
A) $1.
B) $3.
C) $10.
D) $30.
(a) (b)
Refer to Figure 21-5. In graph (b), if income is equal to $420, then the price of good X is
A) $1.
B) $3.
C) $10.
D) $30.
Question
Figure 21-9 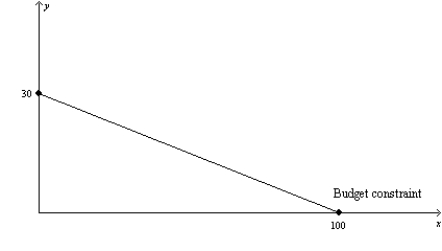
Refer to Figure 21-9. If the consumer has $600 in income, what is the price of good X?
A) $20
B) $6
C) $3
D) $0.33
Refer to Figure 21-9. If the consumer has $600 in income, what is the price of good X?
A) $20
B) $6
C) $3
D) $0.33
Question
Figure 21-9
Refer to Figure 21-9. If the price of good X is $15, what is the price of good Y?
A) $1,500
B) $50
C) $5
D) $0.50
Refer to Figure 21-9. If the price of good X is $15, what is the price of good Y?
A) $1,500
B) $50
C) $5
D) $0.50
Question
The following diagram shows two budget lines: A and B. 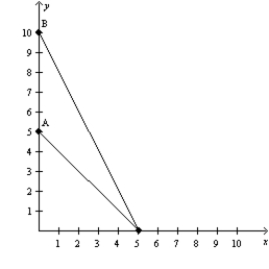 Which of the following could explain the change in the budget line from A to B?
A) a decrease in the price of X
B) an increase in the price of Y
C) a decrease in the price of Y
D) More than one of the above could explain this change.
Which of the following could explain the change in the budget line from A to B?A) a decrease in the price of X
B) an increase in the price of Y
C) a decrease in the price of Y
D) More than one of the above could explain this change.
Question
Figure 21-7 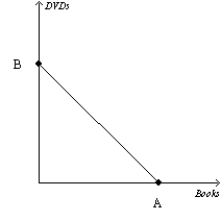
Refer to Figure 21-7. Suppose a consumer has $500 in income, the price of a book is $10, and the value of B is 50. What is the price of a DVD?
A) $5
B) $10
C) $50
D) $100
Refer to Figure 21-7. Suppose a consumer has $500 in income, the price of a book is $10, and the value of B is 50. What is the price of a DVD?
A) $5
B) $10
C) $50
D) $100
Question
Figure 21-8 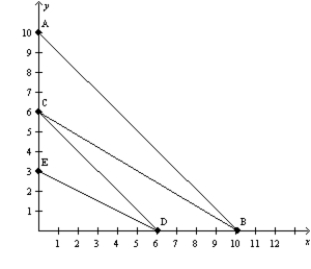
Refer to Figure 21-8. You have $36 to spend on good X and good Y. If good X costs $6 and good Y costs $12, your budget constraint is
A) AB.
B) BC.
C) CD.
D) DE.
Refer to Figure 21-8. You have $36 to spend on good X and good Y. If good X costs $6 and good Y costs $12, your budget constraint is
A) AB.
B) BC.
C) CD.
D) DE.
Question
Figure 21-8
Refer to Figure 21-8. If the price of good X is $5, and your budget constraint is DE, what is the price of good Y?
A) $10
B) $5
C) $2.50
D) $1.67
Refer to Figure 21-8. If the price of good X is $5, and your budget constraint is DE, what is the price of good Y?
A) $10
B) $5
C) $2.50
D) $1.67
Question
Figure 21-6
Refer to Figure 21-6. Suppose a consumer has $200 in income, the price of popcorn is $1, and the price of Mt. Dew is $2. What is the value of A?
A) 100
B) 200
C) 50
D) 25
Refer to Figure 21-6. Suppose a consumer has $200 in income, the price of popcorn is $1, and the price of Mt. Dew is $2. What is the value of A?
A) 100
B) 200
C) 50
D) 25
Question
The following diagram shows two budget lines: A and B. 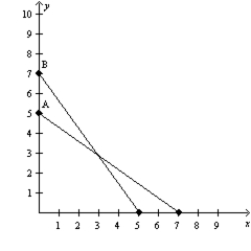 Which of the following could explain the change in the budget line from A to B?
A) a decrease in income and a decrease in the price of X
B) a decrease in income and an increase in the price of X
C) an increase in income and a decrease in the price of X
D) an increase in income and an increase in the price of X
Which of the following could explain the change in the budget line from A to B?A) a decrease in income and a decrease in the price of X
B) a decrease in income and an increase in the price of X
C) an increase in income and a decrease in the price of X
D) an increase in income and an increase in the price of X
Question
Figure 21-9
Refer to Figure 21-9. If the price of good Y is $5, what is the price of good X?
A) $500
B) $150
C) $16.67
D) $1.50
Refer to Figure 21-9. If the price of good Y is $5, what is the price of good X?
A) $500
B) $150
C) $16.67
D) $1.50
Question
Figure 21-7
Refer to Figure 21-7. Suppose the price of a book is $15, the price of a DVD is $10, the value of A is 5, and the value of B is 7.5. How much income does the consumer have?
A) $150
B) $100
C) $75
D) $37.50
Refer to Figure 21-7. Suppose the price of a book is $15, the price of a DVD is $10, the value of A is 5, and the value of B is 7.5. How much income does the consumer have?
A) $150
B) $100
C) $75
D) $37.50
Question
Figure 21-6
Refer to Figure 21-6. Suppose the price of popcorn is $2, the price of Mt. Dew is $4, the value of A is 30, and the value of B is 15. How much income does the consumer have?
A) $120
B) $80
C) $60
D) $30
Refer to Figure 21-6. Suppose the price of popcorn is $2, the price of Mt. Dew is $4, the value of A is 30, and the value of B is 15. How much income does the consumer have?
A) $120
B) $80
C) $60
D) $30
Question
Figure 21-7
Refer to Figure 21-7. Suppose a consumer has $200 in income, the price of a book is $5, and the price of a DVD is $10. What is the value of A?
A) 40
B) 20
C) 10
D) 2
Refer to Figure 21-7. Suppose a consumer has $200 in income, the price of a book is $5, and the price of a DVD is $10. What is the value of A?
A) 40
B) 20
C) 10
D) 2
Question
Figure 21-9
Refer to Figure 21-9. If the consumer has $600 in income, what is the price of good Y?
A) $20
B) $6
C) $3
D) $0.33
Refer to Figure 21-9. If the consumer has $600 in income, what is the price of good Y?
A) $20
B) $6
C) $3
D) $0.33
Question
Figure 21-8
Refer to Figure 21-8. You have $300 to spend on good X and good Y. If good X costs $30 and good Y costs $50, your budget constraint is
A) AB.
B) BC.
C) CD.
D) DE.
Refer to Figure 21-8. You have $300 to spend on good X and good Y. If good X costs $30 and good Y costs $50, your budget constraint is
A) AB.
B) BC.
C) CD.
D) DE.
Question
Figure 21-8
Refer to Figure 21-8. If the price of good X is $3, and your budget constraint is BC, what is the price of good Y?
A) $3.33
B) $5
C) $15
D) $30
Refer to Figure 21-8. If the price of good X is $3, and your budget constraint is BC, what is the price of good Y?
A) $3.33
B) $5
C) $15
D) $30
Question
Figure 21-8
Refer to Figure 21-8. You have $600 to spend on good X and good Y. If good X costs $100 and good Y costs $100, your budget constraint is
A) AB.
B) BC.
C) CD.
D) DE.
Refer to Figure 21-8. You have $600 to spend on good X and good Y. If good X costs $100 and good Y costs $100, your budget constraint is
A) AB.
B) BC.
C) CD.
D) DE.
Question
Figure 21-7
Refer to Figure 21-7. Suppose a consumer has $200 in income, the price of a book is $5, and the price of a DVD is $10. What is the value of B?
A) 40
B) 20
C) 10
D) 2
Refer to Figure 21-7. Suppose a consumer has $200 in income, the price of a book is $5, and the price of a DVD is $10. What is the value of B?
A) 40
B) 20
C) 10
D) 2
Question
Figure 21-6
Refer to Figure 21-6. Suppose a consumer has $100 in income, the price of Mt. Dew is $2, and the value of A is 200. What is the price of popcorn?
A) $0.50
B) $1
C) $2
D) $4
Refer to Figure 21-6. Suppose a consumer has $100 in income, the price of Mt. Dew is $2, and the value of A is 200. What is the price of popcorn?
A) $0.50
B) $1
C) $2
D) $4
Question
The following diagram shows two budget lines: A and B. 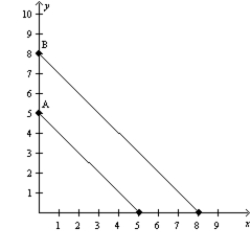 Which of the following could explain the change in the budget line from A to B?
A) a simultaneous decrease in the price of X and the price of Y
B) an increase in income
C) a decrease in income and a decrease in the price of Y
D) Both a and b are correct.
Which of the following could explain the change in the budget line from A to B?A) a simultaneous decrease in the price of X and the price of Y
B) an increase in income
C) a decrease in income and a decrease in the price of Y
D) Both a and b are correct.
Question
Figure 21-6
Refer to Figure 21-6. Suppose a consumer has $200 in income, the price of popcorn is $1, and the price of Mt. Dew is $2. What is the value of B?
A) 100
B) 200
C) 50
D) 25
Refer to Figure 21-6. Suppose a consumer has $200 in income, the price of popcorn is $1, and the price of Mt. Dew is $2. What is the value of B?
A) 100
B) 200
C) 50
D) 25
Question
Question
Question
Question
Question
Question
Question
Question
Question
Question
Question
Question
Question
Question
Question
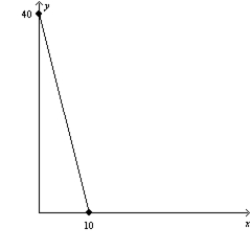
The following diagram shows a budget constraint for a particular consumer. 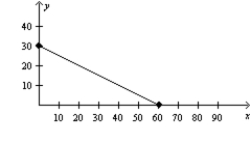 If the price of X is $5, what is the consumer's income?
A) $10
B) $30
C) $150
D) $300
If the price of X is $5, what is the consumer's income?A) $10
B) $30
C) $150
D) $300
Question
Question
Question
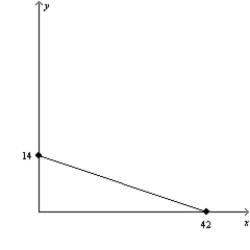
The following diagram shows a budget constraint for a particular consumer. 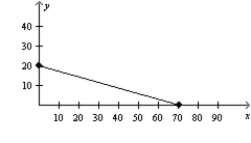 If the price of X is $20, then what is the price of Y?
A) $15
B) $25
C) $35
D) $70
If the price of X is $20, then what is the price of Y?A) $15
B) $25
C) $35
D) $70
Question
Question
The following diagram shows a budget constraint for a particular consumer.  If the price of X is $12, then what is the price of Y?
A) $9
B) $16
C) $24
D) $30
If the price of X is $12, then what is the price of Y?A) $9
B) $16
C) $24
D) $30

Unlock Deck
Sign up to unlock the cards in this deck!
Unlock Deck
Unlock Deck
1/440
Play
Full screen (f)
Deck 21: The Theory of Consumer Choice
1
The theory of consumer choice provides the foundation for understanding the
A) structure of a firm.
B) profitability of a firm.
C) demand for a firm's product.
D) supply of a firm's product.
A) structure of a firm.
B) profitability of a firm.
C) demand for a firm's product.
D) supply of a firm's product.
C
2
Figure 21-1
The downwardsloping line on the figure represents a consumer's budget constraint.
Refer to Figure 21-1. A consumer who chooses to spend all of her income could be at which point(s) on the figure?
A) A only
B) E only
C) B, C, or D only
D) A, B, C, or D only
The downwardsloping line on the figure represents a consumer's budget constraint.
Refer to Figure 21-1. A consumer who chooses to spend all of her income could be at which point(s) on the figure?
A) A only
B) E only
C) B, C, or D only
D) A, B, C, or D only
C
3
The theory of consumer choice most closely examines which of the following Ten Principles of Economics?
A) People face trade-offs.
B) Governments can sometimes improve market outcomes.
C) Trade can make everyone better off.
D) Markets are usually a good way to organize economic activity.
A) People face trade-offs.
B) Governments can sometimes improve market outcomes.
C) Trade can make everyone better off.
D) Markets are usually a good way to organize economic activity.
A
4
Figure 21-2
The downwardsloping line on the figure represents a consumer's budget constraint.
Refer to Figure 21-2. A consumer who chooses to spend all of her income could be at which point(s) on the figure?
A) V only
B) Z only
C) V, W, X, or Y only
D) W, X, or Y only
The downwardsloping line on the figure represents a consumer's budget constraint.
Refer to Figure 21-2. A consumer who chooses to spend all of her income could be at which point(s) on the figure?
A) V only
B) Z only
C) V, W, X, or Y only
D) W, X, or Y only
Unlock Deck
Unlock for access to all 440 flashcards in this deck.
Unlock Deck
k this deck
5
The theory of consumer choice examines how
A) firms make profit-maximizing decisions.
B) consumers make utility-maximizing decisions.
C) wages are determined in competitive labor markets.
D) prices are determined in competitive goods markets.
A) firms make profit-maximizing decisions.
B) consumers make utility-maximizing decisions.
C) wages are determined in competitive labor markets.
D) prices are determined in competitive goods markets.
Unlock Deck
Unlock for access to all 440 flashcards in this deck.
Unlock Deck
k this deck
6
Which of the following statements is correct?
A) The theory of consumer choice provides a more complete understanding of supply, just as the theory of the competitive firm provides a more complete understanding of demand.
B) The theory of consumer choice provides a more complete understanding of demand, just as the theory of the competitive firm provides a more complete understanding of supply.
C) Monetary theory provides a more complete understanding of demand, just as the theory of the competitive firm provides a more complete understanding of supply.
D) The theory of public choice provides a more complete understanding of supply, just as the theory of the competitive firm provides a more complete understanding of demand.
Unlock Deck
Unlock for access to all 440 flashcards in this deck.
Unlock Deck
k this deck
7
Figure 21-2
The downwardsloping line on the figure represents a consumer's budget constraint.
Refer to Figure 21-2. Which points are affordable?
A) W, X, and Y only
B) Z only
C) V, W, X, and Y only
D) V, W, X, Y, and Z
The downwardsloping line on the figure represents a consumer's budget constraint.
Refer to Figure 21-2. Which points are affordable?
A) W, X, and Y only
B) Z only
C) V, W, X, and Y only
D) V, W, X, Y, and Z
Unlock Deck
Unlock for access to all 440 flashcards in this deck.
Unlock Deck
k this deck
8
Figure 21-1
The downwardsloping line on the figure represents a consumer's budget constraint.
Refer to Figure 21-1. If the consumer's income is $140, then what is the price of a CD?
A) $3
B) $5
C) $7
D) $9
The downwardsloping line on the figure represents a consumer's budget constraint.
Refer to Figure 21-1. If the consumer's income is $140, then what is the price of a CD?
A) $3
B) $5
C) $7
D) $9
Unlock Deck
Unlock for access to all 440 flashcards in this deck.
Unlock Deck
k this deck
9
The theory of consumer choice illustrates the
A) importance of property rights in creating efficient markets.
B) ability of a single economic actor to have a substantial influence on market prices.
C) the trade-offs that people face in their role as purchasers.
D) All of the above are correct.
A) importance of property rights in creating efficient markets.
B) ability of a single economic actor to have a substantial influence on market prices.
C) the trade-offs that people face in their role as purchasers.
D) All of the above are correct.
Unlock Deck
Unlock for access to all 440 flashcards in this deck.
Unlock Deck
k this deck
10
The theory of consumer choice
A) underlies the concept of the demand for a particular good.
B) underlies the concept of the supply of a particular good.
C) ignores, for the sake of simplicity, the trade-offs that consumers face.
D) can be applied to many questions about household decisions, but it cannot be applied to questions concerning wages and labor supply.
Unlock Deck
Unlock for access to all 440 flashcards in this deck.
Unlock Deck
k this deck
11
Figure 21-1
The downwardsloping line on the figure represents a consumer's budget constraint.
Refer to Figure 21-1. All of the points identified on the figure represent affordable consumption options with the exception of
A) A.
B) E.
C) A and E.
D) None of the above are correct. All of the points identified on the figure are affordable.
Unlock Deck
Unlock for access to all 440 flashcards in this deck.
Unlock Deck
k this deck
12
Just as the theory of the competitive firm provides a more complete understanding of supply, the theory of consumer choice provides a more complete understanding of
A) demand.
B) profits.
C) production possibility frontiers.
D) wages.
A) demand.
B) profits.
C) production possibility frontiers.
D) wages.
Unlock Deck
Unlock for access to all 440 flashcards in this deck.
Unlock Deck
k this deck
13
How are the following three questions related: 1) Do all demand curves slope downward? 2) How do wages affect labor supply? 3) How do interest rates affect household saving?
A) They all relate to macroeconomics.
B) They all relate to monetary economics.
C) They all relate to the theory of consumer choice.
D) They are not related to each other in any way.
A) They all relate to macroeconomics.
B) They all relate to monetary economics.
C) They all relate to the theory of consumer choice.
D) They are not related to each other in any way.
Unlock Deck
Unlock for access to all 440 flashcards in this deck.
Unlock Deck
k this deck
14
Figure 21-2
The downwardsloping line on the figure represents a consumer's budget constraint.
Refer to Figure 21-2. If the consumer's income is $100, then what is the price of an apple?
A) $0.50
B) $0.75
C) $1.00
D) $1.25
The downwardsloping line on the figure represents a consumer's budget constraint.
Refer to Figure 21-2. If the consumer's income is $100, then what is the price of an apple?
A) $0.50
B) $0.75
C) $1.00
D) $1.25
Unlock Deck
Unlock for access to all 440 flashcards in this deck.
Unlock Deck
k this deck
15
When a consumer spends less time enjoying leisure and more time working, she has
A) lower income and therefore cannot afford more consumption.
B) lower income and therefore can afford more consumption.
C) higher income and therefore cannot afford more consumption.
D) higher income and therefore can afford more consumption.
A) lower income and therefore cannot afford more consumption.
B) lower income and therefore can afford more consumption.
C) higher income and therefore cannot afford more consumption.
D) higher income and therefore can afford more consumption.
Unlock Deck
Unlock for access to all 440 flashcards in this deck.
Unlock Deck
k this deck
16
Figure 21-1
The downwardsloping line on the figure represents a consumer's budget constraint.
Refer to Figure 21-1. If the price of a CD is $12, then the consumer's income amounts to
A) $140.
B) $180.
C) $210.
D) $240.
The downwardsloping line on the figure represents a consumer's budget constraint.
Refer to Figure 21-1. If the price of a CD is $12, then the consumer's income amounts to
A) $140.
B) $180.
C) $210.
D) $240.
Unlock Deck
Unlock for access to all 440 flashcards in this deck.
Unlock Deck
k this deck
17
Which of the following does not represent a tradeoff facing a consumer?
A) choosing to purchase more of all goods
B) choosing to spend more time on leisure and less time on work
C) choosing to spend more now and consume less in the future
D) choosing to purchase less of one good in order to purchase more of another good
A) choosing to purchase more of all goods
B) choosing to spend more time on leisure and less time on work
C) choosing to spend more now and consume less in the future
D) choosing to purchase less of one good in order to purchase more of another good
Unlock Deck
Unlock for access to all 440 flashcards in this deck.
Unlock Deck
k this deck
18
The theory of consumer choice is to demand as the theory of
A) public goods is to supply.
B) oligopoly is to supply.
C) the competitive firm is to supply.
D) comparative advantage is to supply.
A) public goods is to supply.
B) oligopoly is to supply.
C) the competitive firm is to supply.
D) comparative advantage is to supply.
Unlock Deck
Unlock for access to all 440 flashcards in this deck.
Unlock Deck
k this deck
19
Figure 21-2
The downwardsloping line on the figure represents a consumer's budget constraint.
Refer to Figure 21-2. Which of the following statements is not correct?
A) Points W, X, and Y all cost the consumer the same amount of money.
B) Point Z is unaffordable for the consumer given his budget constraint.
C) Point V costs less than point Z.
D) Points W, X, and Y give the consumer the same level of satisfaction.
Unlock Deck
Unlock for access to all 440 flashcards in this deck.
Unlock Deck
k this deck
20
The theory of consumer choice examines
A) the determination of output in competitive markets.
B) the tradeoffs inherent in decisions made by consumers.
C) how consumers select inputs into manufacturing production processes.
D) the determination of prices in competitive markets.
A) the determination of output in competitive markets.
B) the tradeoffs inherent in decisions made by consumers.
C) how consumers select inputs into manufacturing production processes.
D) the determination of prices in competitive markets.
Unlock Deck
Unlock for access to all 440 flashcards in this deck.
Unlock Deck
k this deck
21
Figure 21-5
(a) (b)
Refer to Figure 21-5. In graph (a), what is the price of good X relative to the price of good Y (i.e., PX/PY)?
A) 1/3
B) 1/4
C) 3
D) 4
(a) (b)
Refer to Figure 21-5. In graph (a), what is the price of good X relative to the price of good Y (i.e., PX/PY)?
A) 1/3
B) 1/4
C) 3
D) 4
Unlock Deck
Unlock for access to all 440 flashcards in this deck.
Unlock Deck
k this deck
22
Figure 21-3
In each case, the budget constraint moves from BC-1 to BC-2.
Refer to Figure 21-3. Which of the graphs in the figure reflects a decrease in the price of good Y only?
A) graph a
B) graph b
C) graph c
D) graph d
In each case, the budget constraint moves from BC-1 to BC-2.
Refer to Figure 21-3. Which of the graphs in the figure reflects a decrease in the price of good Y only?
A) graph a
B) graph b
C) graph c
D) graph d
Unlock Deck
Unlock for access to all 440 flashcards in this deck.
Unlock Deck
k this deck
23
Figure 21-5
(a) (b)
Refer to Figure 21-5. Assume that a consumer faces the budget constraint shown in graph (a) in January and the budget constraint shown in graph (b) in February. If the consumer's income has remained constant, then what has happened to prices between January and February?
A) The price of X has fallen, but there could not have been a change in the price of Y.
B) The price of Y has fallen, but there could not have been a change in the price of X.
C) The price of X has fallen, and the price of Y has risen.
D) The price of Y has fallen, and the price of X has risen.
Unlock Deck
Unlock for access to all 440 flashcards in this deck.
Unlock Deck
k this deck
24
Figure 21-5
(a) (b)
Refer to Figure 21-5. In graph (a), what is the price of good Y relative to the price of good X (i.e., Py/Px)?
A) 1/3
B) 1/4
C) 3
D) 4
(a) (b)
Refer to Figure 21-5. In graph (a), what is the price of good Y relative to the price of good X (i.e., Py/Px)?
A) 1/3
B) 1/4
C) 3
D) 4
Unlock Deck
Unlock for access to all 440 flashcards in this deck.
Unlock Deck
k this deck
25
Figure 21-5
(a) (b)
Refer to Figure 21-5. In graph (b), what is the price of good Y relative to the price of good X (i.e., PY/PX)?
A) 1
B) 1/3
C) 3
D) 10
(a) (b)
Refer to Figure 21-5. In graph (b), what is the price of good Y relative to the price of good X (i.e., PY/PX)?
A) 1
B) 1/3
C) 3
D) 10
Unlock Deck
Unlock for access to all 440 flashcards in this deck.
Unlock Deck
k this deck
26
Figure 21-5
(a) (b)
Refer to Figure 21-5. In graph (a), if income is equal to $200, then the price of good Y is
A) $3.
B) $5.
C) $7.
D) $10.
(a) (b)
Refer to Figure 21-5. In graph (a), if income is equal to $200, then the price of good Y is
A) $3.
B) $5.
C) $7.
D) $10.
Unlock Deck
Unlock for access to all 440 flashcards in this deck.
Unlock Deck
k this deck
27
Figure 21-6
Refer to Figure 21-6. Suppose a consumer has $100 in income, the price of popcorn is $2, and the value of B is 100. What is the price of Mt. Dew?
A) $1
B) $2
C) $5
D) $100
Refer to Figure 21-6. Suppose a consumer has $100 in income, the price of popcorn is $2, and the value of B is 100. What is the price of Mt. Dew?
A) $1
B) $2
C) $5
D) $100
Unlock Deck
Unlock for access to all 440 flashcards in this deck.
Unlock Deck
k this deck
28
Figure 21-4
In each case, the budget constraint moves from BC-1 to BC-2.
Refer to Figure 21-4. Which of the graphs in the figure could reflect an increase in income?
A) graph a
B) graph b
C) graph d
D) None of the above is correct.
In each case, the budget constraint moves from BC-1 to BC-2.
Refer to Figure 21-4. Which of the graphs in the figure could reflect an increase in income?
A) graph a
B) graph b
C) graph d
D) None of the above is correct.
Unlock Deck
Unlock for access to all 440 flashcards in this deck.
Unlock Deck
k this deck
29
Figure 21-3
In each case, the budget constraint moves from BC-1 to BC-2.
Refer to Figure 21-3. Which of the graphs in the figure could reflect a simultaneous decrease in the price of good X and increase in the price of good Y? (i) graph a
(ii) graph b
(iii) graph c
(iv) graph d
A) (ii) only
B) (iii) only
C) (ii) or (iv) only
D) None of the above is correct.
Unlock Deck
Unlock for access to all 440 flashcards in this deck.
Unlock Deck
k this deck
30
Figure 21-5
(a) (b)
Refer to Figure 21-5. In graph (a), if income is equal to $200, then the price of good X is
A) $12.
B) $16.
C) $20.
D) $24.
(a) (b)
Refer to Figure 21-5. In graph (a), if income is equal to $200, then the price of good X is
A) $12.
B) $16.
C) $20.
D) $24.
Unlock Deck
Unlock for access to all 440 flashcards in this deck.
Unlock Deck
k this deck
31
Figure 21-3
In each case, the budget constraint moves from BC-1 to BC-2.
Refer to Figure 21-3. Which of the graphs in the figure reflects an increase in the price of good Y only?
A) graph a
B) graph b
C) graph c
D) graph d
In each case, the budget constraint moves from BC-1 to BC-2.
Refer to Figure 21-3. Which of the graphs in the figure reflects an increase in the price of good Y only?
A) graph a
B) graph b
C) graph c
D) graph d
Unlock Deck
Unlock for access to all 440 flashcards in this deck.
Unlock Deck
k this deck
32
Figure 21-4
In each case, the budget constraint moves from BC-1 to BC-2.
Refer to Figure 21-4. Which of the graphs in the figure could reflect a simultaneous increase in the price of good X and decrease in the price of good Y?
A) graph a
B) graph b
C) graph c
D) graph d
In each case, the budget constraint moves from BC-1 to BC-2.
Refer to Figure 21-4. Which of the graphs in the figure could reflect a simultaneous increase in the price of good X and decrease in the price of good Y?
A) graph a
B) graph b
C) graph c
D) graph d
Unlock Deck
Unlock for access to all 440 flashcards in this deck.
Unlock Deck
k this deck
33
Figure 21-2
The downwardsloping line on the figure represents a consumer's budget constraint.
Refer to Figure 21-2. Which of the following statements is correct?
A) Points W, X, and Y all cost the consumer the same amount of money.
B) Point V is unaffordable for the consumer given his budget constraint.
C) Point Z costs less than point V.
D) Points W, X, and Y give the consumer the same level of satisfaction.
Unlock Deck
Unlock for access to all 440 flashcards in this deck.
Unlock Deck
k this deck
34
Figure 21-5
(a) (b)
Refer to Figure 21-5. In graph (b), if income is equal to $420, then the price of good Y is
A) $1.
B) $3.
C) $10.
D) $30.
(a) (b)
Refer to Figure 21-5. In graph (b), if income is equal to $420, then the price of good Y is
A) $1.
B) $3.
C) $10.
D) $30.
Unlock Deck
Unlock for access to all 440 flashcards in this deck.
Unlock Deck
k this deck
35
Figure 21-5
(a) (b)
Refer to Figure 21-5. In graph (b), what is the price of good X relative to the price of good Y (i.e., Px/Py)?
A) 1
B) 1/3
C) 3
D) 10
(a) (b)
Refer to Figure 21-5. In graph (b), what is the price of good X relative to the price of good Y (i.e., Px/Py)?
A) 1
B) 1/3
C) 3
D) 10
Unlock Deck
Unlock for access to all 440 flashcards in this deck.
Unlock Deck
k this deck
36
Figure 21-3
In each case, the budget constraint moves from BC-1 to BC-2.
Refer to Figure 21-3. Which of the graphs in the figure could reflect a simultaneous decrease in the prices of both goods? (i) graph a
(ii) graph b
(iii) graph c
(iv) graph d
A) (i) only
B) (iv) only
C) (ii) or (iii) only
D) None of the above is correct.
Unlock Deck
Unlock for access to all 440 flashcards in this deck.
Unlock Deck
k this deck
37
Figure 21-3
In each case, the budget constraint moves from BC-1 to BC-2.
Refer to Figure 21-3. Which of the graphs in the figure reflects a decrease in the price of good X only?
A) graph a
B) graph b
C) graph c
D) graph d
In each case, the budget constraint moves from BC-1 to BC-2.
Refer to Figure 21-3. Which of the graphs in the figure reflects a decrease in the price of good X only?
A) graph a
B) graph b
C) graph c
D) graph d
Unlock Deck
Unlock for access to all 440 flashcards in this deck.
Unlock Deck
k this deck
38
Figure 21-4
In each case, the budget constraint moves from BC-1 to BC-2.
Refer to Figure 21-4. Which of the graphs in the figure could reflect a decrease in income?
A) graph a
B) graph b
C) graph d
D) None of the above is correct.
In each case, the budget constraint moves from BC-1 to BC-2.
Refer to Figure 21-4. Which of the graphs in the figure could reflect a decrease in income?
A) graph a
B) graph b
C) graph d
D) None of the above is correct.
Unlock Deck
Unlock for access to all 440 flashcards in this deck.
Unlock Deck
k this deck
39
Figure 21-3
In each case, the budget constraint moves from BC-1 to BC-2.
Refer to Figure 21-3. Which of the graphs in the figure reflects an increase in the price of good X only?
A) graph a
B) graph b
C) graph c
D) graph d
In each case, the budget constraint moves from BC-1 to BC-2.
Refer to Figure 21-3. Which of the graphs in the figure reflects an increase in the price of good X only?
A) graph a
B) graph b
C) graph c
D) graph d
Unlock Deck
Unlock for access to all 440 flashcards in this deck.
Unlock Deck
k this deck
40
Figure 21-5
(a) (b)
Refer to Figure 21-5. In graph (b), if income is equal to $420, then the price of good X is
A) $1.
B) $3.
C) $10.
D) $30.
(a) (b)
Refer to Figure 21-5. In graph (b), if income is equal to $420, then the price of good X is
A) $1.
B) $3.
C) $10.
D) $30.
Unlock Deck
Unlock for access to all 440 flashcards in this deck.
Unlock Deck
k this deck
41
Figure 21-9
Refer to Figure 21-9. If the consumer has $600 in income, what is the price of good X?
A) $20
B) $6
C) $3
D) $0.33
Refer to Figure 21-9. If the consumer has $600 in income, what is the price of good X?
A) $20
B) $6
C) $3
D) $0.33
Unlock Deck
Unlock for access to all 440 flashcards in this deck.
Unlock Deck
k this deck
42
Figure 21-9
Refer to Figure 21-9. If the price of good X is $15, what is the price of good Y?
A) $1,500
B) $50
C) $5
D) $0.50
Refer to Figure 21-9. If the price of good X is $15, what is the price of good Y?
A) $1,500
B) $50
C) $5
D) $0.50
Unlock Deck
Unlock for access to all 440 flashcards in this deck.
Unlock Deck
k this deck
43
The following diagram shows two budget lines: A and B. Which of the following could explain the change in the budget line from A to B?
A) a decrease in the price of X
B) an increase in the price of Y
C) a decrease in the price of Y
D) More than one of the above could explain this change.
Which of the following could explain the change in the budget line from A to B?A) a decrease in the price of X
B) an increase in the price of Y
C) a decrease in the price of Y
D) More than one of the above could explain this change.
Unlock Deck
Unlock for access to all 440 flashcards in this deck.
Unlock Deck
k this deck
44
Figure 21-7
Refer to Figure 21-7. Suppose a consumer has $500 in income, the price of a book is $10, and the value of B is 50. What is the price of a DVD?
A) $5
B) $10
C) $50
D) $100
Refer to Figure 21-7. Suppose a consumer has $500 in income, the price of a book is $10, and the value of B is 50. What is the price of a DVD?
A) $5
B) $10
C) $50
D) $100
Unlock Deck
Unlock for access to all 440 flashcards in this deck.
Unlock Deck
k this deck
45
Figure 21-8
Refer to Figure 21-8. You have $36 to spend on good X and good Y. If good X costs $6 and good Y costs $12, your budget constraint is
A) AB.
B) BC.
C) CD.
D) DE.
Refer to Figure 21-8. You have $36 to spend on good X and good Y. If good X costs $6 and good Y costs $12, your budget constraint is
A) AB.
B) BC.
C) CD.
D) DE.
Unlock Deck
Unlock for access to all 440 flashcards in this deck.
Unlock Deck
k this deck
46
Figure 21-8
Refer to Figure 21-8. If the price of good X is $5, and your budget constraint is DE, what is the price of good Y?
A) $10
B) $5
C) $2.50
D) $1.67
Refer to Figure 21-8. If the price of good X is $5, and your budget constraint is DE, what is the price of good Y?
A) $10
B) $5
C) $2.50
D) $1.67
Unlock Deck
Unlock for access to all 440 flashcards in this deck.
Unlock Deck
k this deck
47
Figure 21-6
Refer to Figure 21-6. Suppose a consumer has $200 in income, the price of popcorn is $1, and the price of Mt. Dew is $2. What is the value of A?
A) 100
B) 200
C) 50
D) 25
Refer to Figure 21-6. Suppose a consumer has $200 in income, the price of popcorn is $1, and the price of Mt. Dew is $2. What is the value of A?
A) 100
B) 200
C) 50
D) 25
Unlock Deck
Unlock for access to all 440 flashcards in this deck.
Unlock Deck
k this deck
48
The following diagram shows two budget lines: A and B. Which of the following could explain the change in the budget line from A to B?
A) a decrease in income and a decrease in the price of X
B) a decrease in income and an increase in the price of X
C) an increase in income and a decrease in the price of X
D) an increase in income and an increase in the price of X
Which of the following could explain the change in the budget line from A to B?A) a decrease in income and a decrease in the price of X
B) a decrease in income and an increase in the price of X
C) an increase in income and a decrease in the price of X
D) an increase in income and an increase in the price of X
Unlock Deck
Unlock for access to all 440 flashcards in this deck.
Unlock Deck
k this deck
49
Figure 21-9
Refer to Figure 21-9. If the price of good Y is $5, what is the price of good X?
A) $500
B) $150
C) $16.67
D) $1.50
Refer to Figure 21-9. If the price of good Y is $5, what is the price of good X?
A) $500
B) $150
C) $16.67
D) $1.50
Unlock Deck
Unlock for access to all 440 flashcards in this deck.
Unlock Deck
k this deck
50
Figure 21-7
Refer to Figure 21-7. Suppose the price of a book is $15, the price of a DVD is $10, the value of A is 5, and the value of B is 7.5. How much income does the consumer have?
A) $150
B) $100
C) $75
D) $37.50
Refer to Figure 21-7. Suppose the price of a book is $15, the price of a DVD is $10, the value of A is 5, and the value of B is 7.5. How much income does the consumer have?
A) $150
B) $100
C) $75
D) $37.50
Unlock Deck
Unlock for access to all 440 flashcards in this deck.
Unlock Deck
k this deck
51
Figure 21-6
Refer to Figure 21-6. Suppose the price of popcorn is $2, the price of Mt. Dew is $4, the value of A is 30, and the value of B is 15. How much income does the consumer have?
A) $120
B) $80
C) $60
D) $30
Refer to Figure 21-6. Suppose the price of popcorn is $2, the price of Mt. Dew is $4, the value of A is 30, and the value of B is 15. How much income does the consumer have?
A) $120
B) $80
C) $60
D) $30
Unlock Deck
Unlock for access to all 440 flashcards in this deck.
Unlock Deck
k this deck
52
Figure 21-7
Refer to Figure 21-7. Suppose a consumer has $200 in income, the price of a book is $5, and the price of a DVD is $10. What is the value of A?
A) 40
B) 20
C) 10
D) 2
Refer to Figure 21-7. Suppose a consumer has $200 in income, the price of a book is $5, and the price of a DVD is $10. What is the value of A?
A) 40
B) 20
C) 10
D) 2
Unlock Deck
Unlock for access to all 440 flashcards in this deck.
Unlock Deck
k this deck
53
Figure 21-9
Refer to Figure 21-9. If the consumer has $600 in income, what is the price of good Y?
A) $20
B) $6
C) $3
D) $0.33
Refer to Figure 21-9. If the consumer has $600 in income, what is the price of good Y?
A) $20
B) $6
C) $3
D) $0.33
Unlock Deck
Unlock for access to all 440 flashcards in this deck.
Unlock Deck
k this deck
54
Figure 21-8
Refer to Figure 21-8. You have $300 to spend on good X and good Y. If good X costs $30 and good Y costs $50, your budget constraint is
A) AB.
B) BC.
C) CD.
D) DE.
Refer to Figure 21-8. You have $300 to spend on good X and good Y. If good X costs $30 and good Y costs $50, your budget constraint is
A) AB.
B) BC.
C) CD.
D) DE.
Unlock Deck
Unlock for access to all 440 flashcards in this deck.
Unlock Deck
k this deck
55
Figure 21-8
Refer to Figure 21-8. If the price of good X is $3, and your budget constraint is BC, what is the price of good Y?
A) $3.33
B) $5
C) $15
D) $30
Refer to Figure 21-8. If the price of good X is $3, and your budget constraint is BC, what is the price of good Y?
A) $3.33
B) $5
C) $15
D) $30
Unlock Deck
Unlock for access to all 440 flashcards in this deck.
Unlock Deck
k this deck
56
Figure 21-8
Refer to Figure 21-8. You have $600 to spend on good X and good Y. If good X costs $100 and good Y costs $100, your budget constraint is
A) AB.
B) BC.
C) CD.
D) DE.
Refer to Figure 21-8. You have $600 to spend on good X and good Y. If good X costs $100 and good Y costs $100, your budget constraint is
A) AB.
B) BC.
C) CD.
D) DE.
Unlock Deck
Unlock for access to all 440 flashcards in this deck.
Unlock Deck
k this deck
57
Figure 21-7
Refer to Figure 21-7. Suppose a consumer has $200 in income, the price of a book is $5, and the price of a DVD is $10. What is the value of B?
A) 40
B) 20
C) 10
D) 2
Refer to Figure 21-7. Suppose a consumer has $200 in income, the price of a book is $5, and the price of a DVD is $10. What is the value of B?
A) 40
B) 20
C) 10
D) 2
Unlock Deck
Unlock for access to all 440 flashcards in this deck.
Unlock Deck
k this deck
58
Figure 21-6
Refer to Figure 21-6. Suppose a consumer has $100 in income, the price of Mt. Dew is $2, and the value of A is 200. What is the price of popcorn?
A) $0.50
B) $1
C) $2
D) $4
Refer to Figure 21-6. Suppose a consumer has $100 in income, the price of Mt. Dew is $2, and the value of A is 200. What is the price of popcorn?
A) $0.50
B) $1
C) $2
D) $4
Unlock Deck
Unlock for access to all 440 flashcards in this deck.
Unlock Deck
k this deck
59
The following diagram shows two budget lines: A and B. Which of the following could explain the change in the budget line from A to B?
A) a simultaneous decrease in the price of X and the price of Y
B) an increase in income
C) a decrease in income and a decrease in the price of Y
D) Both a and b are correct.
Which of the following could explain the change in the budget line from A to B?A) a simultaneous decrease in the price of X and the price of Y
B) an increase in income
C) a decrease in income and a decrease in the price of Y
D) Both a and b are correct.
Unlock Deck
Unlock for access to all 440 flashcards in this deck.
Unlock Deck
k this deck
60
Figure 21-6
Refer to Figure 21-6. Suppose a consumer has $200 in income, the price of popcorn is $1, and the price of Mt. Dew is $2. What is the value of B?
A) 100
B) 200
C) 50
D) 25
Refer to Figure 21-6. Suppose a consumer has $200 in income, the price of popcorn is $1, and the price of Mt. Dew is $2. What is the value of B?
A) 100
B) 200
C) 50
D) 25
Unlock Deck
Unlock for access to all 440 flashcards in this deck.
Unlock Deck
k this deck
61
Scenario 21-1
Suppose the price of hot wings is $10, the price of beer is $1, and the consumer's income is $50. In addition, suppose the consumer's budget constraint illustrates hot wings on the horizontal axis and beer on the vertical axis.
Refer to Scenario 21-1. If the consumer's income rises to $60, then the budget line for hot wings and beer would
A) now intersect the horizontal axis at 6 orders of hot wings and the vertical axis at 60 beers.
B) not change.
C) now intersect the horizontal axis at 4 orders of hot wings and the vertical axis at 16 beers.
D) rotate outward along the beer axis.
Unlock Deck
Unlock for access to all 440 flashcards in this deck.
Unlock Deck
k this deck
62
Karen, Tara, and Chelsea each buy ice cream and paperback novels to enjoy on hot summer days. Ice cream costs $5 per gallon, and paperback novels cost $8 each. Karen has a budget of $80, Tara has a budget of $60, and Chelsea has a budget of $40 to spend on ice cream and paperback novels. Who can afford to purchase 8 gallons of ice cream and 5 paperback novels?
A) Karen, Tara, and Chelsea
B) Karen only
C) Tara and Chelsea but not Karen
D) none of the women
A) Karen, Tara, and Chelsea
B) Karen only
C) Tara and Chelsea but not Karen
D) none of the women
Unlock Deck
Unlock for access to all 440 flashcards in this deck.
Unlock Deck
k this deck
63
Jack and Diane each buy pizza and paperback novels. Pizza costs $3 per slice, and paperback novels cost $5 each. Jack has a budget of $30, and Diane has a budget of $15 to spend on pizza and paperback novels. Which consumer(s) can afford to purchase 3 slices of pizza and 4 paperback novels?
A) Jack only
B) Diane only
C) both Jack and Diane
D) neither Jack nor Diane
A) Jack only
B) Diane only
C) both Jack and Diane
D) neither Jack nor Diane
Unlock Deck
Unlock for access to all 440 flashcards in this deck.
Unlock Deck
k this deck
64
Abby, Bobbi, and Deborah each buy ice cream and paperback novels to enjoy on hot summer days. Ice cream costs $5 per gallon, and paperback novels cost $8 each. Abby has a budget of $80, Bobbi has a budget of $60, and Deborah has a budget of $40 to spend on ice cream and paperback novels. Who can afford to purchase 4 gallons of ice cream and 5 paperback novels?
A) Abby, Bobbi, and Deborah
B) Abby only
C) Abby and Bobbi, but not Deborah
D) None of the women can afford to purchase 4 gallons of ice cream and 5 paperback novels.
A) Abby, Bobbi, and Deborah
B) Abby only
C) Abby and Bobbi, but not Deborah
D) None of the women can afford to purchase 4 gallons of ice cream and 5 paperback novels.
Unlock Deck
Unlock for access to all 440 flashcards in this deck.
Unlock Deck
k this deck
65
Jack and Diane each buy pizza and paperback novels. Pizza costs $3 per slice, and paperback novels cost $5 each. Jack has a budget of $30, and Diane has a budget of $15 to spend on pizza and paperback novels. Which consumer(s) can afford to purchase 5 slices of pizza and 5 paperback novels?
A) Jack only
B) Diane only
C) both Jack and Diane
D) neither Jack nor Diane
A) Jack only
B) Diane only
C) both Jack and Diane
D) neither Jack nor Diane
Unlock Deck
Unlock for access to all 440 flashcards in this deck.
Unlock Deck
k this deck
66
Budget constraints exist for consumers because
A) their utility from consuming goods eventually reaches a maximum level.
B) even with unlimited incomes they have to pay for each good they consume.
C) they have to pay for goods, and they have limited incomes.
D) prices and incomes are inversely related.
A) their utility from consuming goods eventually reaches a maximum level.
B) even with unlimited incomes they have to pay for each good they consume.
C) they have to pay for goods, and they have limited incomes.
D) prices and incomes are inversely related.
Unlock Deck
Unlock for access to all 440 flashcards in this deck.
Unlock Deck
k this deck
67
Karen, Tara, and Chelsea each buy ice cream and paperback novels to enjoy on hot summer days. Ice cream costs $5 per gallon, and paperback novels cost $8 each. Karen has a budget of $80, Tara has a budget of $60, and Chelsea has a budget of $40 to spend on ice cream and paperback novels. Who can afford to purchase 5 gallons of ice cream and 8 paperback novels?
A) Karen, Tara, and Chelsea
B) Karen only
C) Tara and Chelsea but not Karen
D) none of the women
A) Karen, Tara, and Chelsea
B) Karen only
C) Tara and Chelsea but not Karen
D) none of the women
Unlock Deck
Unlock for access to all 440 flashcards in this deck.
Unlock Deck
k this deck
68
Suppose a consumer has an income of $800 per month and that she spends her entire income each month on beer and bratwurst. The price of a pint of beer is $5, and the price of a bratwurst is $4. Which of the following combinations of beers and bratwursts represents a point that would lie to the exterior of the consumer's budget constraint?
A) 160 beers and 200 bratwursts
B) 40 beers and 50 bratwursts
C) 80 beers and 100 bratwursts
D) 160 beers and 0 bratwursts
A) 160 beers and 200 bratwursts
B) 40 beers and 50 bratwursts
C) 80 beers and 100 bratwursts
D) 160 beers and 0 bratwursts
Unlock Deck
Unlock for access to all 440 flashcards in this deck.
Unlock Deck
k this deck
69
Abby, Bobbi, and Deborah each buy ice cream and paperback novels to enjoy on hot summer days. Ice cream costs $5 per gallon, and paperback novels cost $8 each. Abby has a budget of $80, Bobbi has a budget of $60, and Deborah has a budget of $40 to spend on ice cream and paperback novels. Which of the following statements is correct?
A) Each woman faces the same budget constraint.
B) The slope of the budget constraint is the same for each woman.
C) The area underneath the budget constraint is larger for Deborah than for Abby.
D) All of the above are correct.
A) Each woman faces the same budget constraint.
B) The slope of the budget constraint is the same for each woman.
C) The area underneath the budget constraint is larger for Deborah than for Abby.
D) All of the above are correct.
Unlock Deck
Unlock for access to all 440 flashcards in this deck.
Unlock Deck
k this deck
70
Suppose a consumer spends his income on CDs and DVDs. If his income decreases, the budget constraint for CDs and DVDs will
A) shift outward, parallel to the original budget constraint.
B) shift inward, parallel to the original budget constraint.
C) rotate outward along the CD axis because he can afford more CDs.
D) rotate outward along the DVD axis because he can afford more DVDs.
A) shift outward, parallel to the original budget constraint.
B) shift inward, parallel to the original budget constraint.
C) rotate outward along the CD axis because he can afford more CDs.
D) rotate outward along the DVD axis because he can afford more DVDs.
Unlock Deck
Unlock for access to all 440 flashcards in this deck.
Unlock Deck
k this deck
71
Consider two goods: peanuts and crackers. The slope of the consumer's budget constraint is measured by the
A) consumer's income divided by the price of crackers.
B) relative price of peanuts and crackers.
C) consumer's marginal rate of substitution.
D) number of peanuts purchased divided by the number of crackers purchased.
A) consumer's income divided by the price of crackers.
B) relative price of peanuts and crackers.
C) consumer's marginal rate of substitution.
D) number of peanuts purchased divided by the number of crackers purchased.
Unlock Deck
Unlock for access to all 440 flashcards in this deck.
Unlock Deck
k this deck
72
Scenario 21-1
Suppose the price of hot wings is $10, the price of beer is $1, and the consumer's income is $50. In addition, suppose the consumer's budget constraint illustrates hot wings on the horizontal axis and beer on the vertical axis.
Refer to Scenario 21-1. If the price of beer doubles to $2, then the
A) budget constraint intersects the vertical axis at 25 beers.
B) slope of the budget constraint rises to -2.
C) slope of the budget constraint falls to -4.
D) budget constraint shifts inward in a parallel fashion.
Unlock Deck
Unlock for access to all 440 flashcards in this deck.
Unlock Deck
k this deck
73
Suppose a consumer has an income of $800 per month and that she spends her entire income each month on beer and bratwurst. The price of a pint of beer is $5, and the price of a bratwurst is $4. Which of the following combinations of beers and bratwursts represents a point that would lie directly on the consumer's budget constraint?
A) 160 beers and 200 bratwursts
B) 40 beers and 50 bratwursts
C) 80 beers and 100 bratwursts
D) 80 beers and 0 bratwursts
A) 160 beers and 200 bratwursts
B) 40 beers and 50 bratwursts
C) 80 beers and 100 bratwursts
D) 80 beers and 0 bratwursts
Unlock Deck
Unlock for access to all 440 flashcards in this deck.
Unlock Deck
k this deck
74
A budget constraint illustrates the
A) prices that a consumer chooses to pay for products he consumes.
B) purchases made by consumers.
C) consumption bundles that a consumer can afford.
D) consumption bundles that give a consumer equal satisfaction.
A) prices that a consumer chooses to pay for products he consumes.
B) purchases made by consumers.
C) consumption bundles that a consumer can afford.
D) consumption bundles that give a consumer equal satisfaction.
Unlock Deck
Unlock for access to all 440 flashcards in this deck.
Unlock Deck
k this deck
75
The following diagram shows a budget constraint for a particular consumer. If the price of X is $5, what is the consumer's income?
A) $10
B) $30
C) $150
D) $300
If the price of X is $5, what is the consumer's income?A) $10
B) $30
C) $150
D) $300
Unlock Deck
Unlock for access to all 440 flashcards in this deck.
Unlock Deck
k this deck
76
Jack and Diane each buy pizza and paperback novels. Pizza costs $3 per slice, and paperback novels cost $5 each. Jack has a budget of $30, and Diane has a budget of $15 to spend on pizza and paperback novels. Which consumer(s) can afford to purchase 5 slices of pizza and 3 paperback novels?
A) Jack only
B) Diane only
C) both Jack and Diane
D) neither Jack nor Diane
A) Jack only
B) Diane only
C) both Jack and Diane
D) neither Jack nor Diane
Unlock Deck
Unlock for access to all 440 flashcards in this deck.
Unlock Deck
k this deck
77
A budget constraint shows
A) the maximum utility that a consumer can achieve for a given level of income.
B) a series of bundles that cost the consumer the same amount of money.
C) a series of bundles that give the consumer the same level of utility.
D) All of the above are correct.
A) the maximum utility that a consumer can achieve for a given level of income.
B) a series of bundles that cost the consumer the same amount of money.
C) a series of bundles that give the consumer the same level of utility.
D) All of the above are correct.
Unlock Deck
Unlock for access to all 440 flashcards in this deck.
Unlock Deck
k this deck
78
The following diagram shows a budget constraint for a particular consumer. If the price of X is $20, then what is the price of Y?
A) $15
B) $25
C) $35
D) $70
If the price of X is $20, then what is the price of Y?A) $15
B) $25
C) $35
D) $70
Unlock Deck
Unlock for access to all 440 flashcards in this deck.
Unlock Deck
k this deck
79
Suppose a consumer has an income of $800 per month and that she spends her entire income each month on beer and bratwurst. The price of a pint of beer is $5, and the price of a bratwurst is $4. Which of the following combinations of beers and bratwursts represents a point that would lie to the interior of the consumer's budget constraint?
A) 160 beers and 200 bratwursts
B) 40 beers and 50 bratwursts
C) 80 beers and 100 bratwursts
D) 160 beers and 0 bratwursts
A) 160 beers and 200 bratwursts
B) 40 beers and 50 bratwursts
C) 80 beers and 100 bratwursts
D) 160 beers and 0 bratwursts
Unlock Deck
Unlock for access to all 440 flashcards in this deck.
Unlock Deck
k this deck
80
The following diagram shows a budget constraint for a particular consumer. If the price of X is $12, then what is the price of Y?
A) $9
B) $16
C) $24
D) $30
If the price of X is $12, then what is the price of Y?A) $9
B) $16
C) $24
D) $30
Unlock Deck
Unlock for access to all 440 flashcards in this deck.
Unlock Deck
k this deck
Unlock Deck
Unlock for access to all 440 flashcards in this deck.


