Deck 17: Nonparametric Methods: Goodness-Of-Fit Tests
Full screen (f)
Question
Question
Question
Question
Question
Question
Question
Question
Question
Question
Question
Question
Question
Question
Question
Question
Question
Question
Question
Question
For the goodness-of-fit test, the use of the chi-square statistic would be permissible in the following problem. 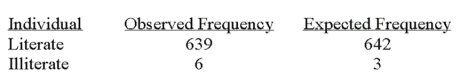
Question
Question
Question
Question
Question
Question
Question
Question
Question
Question
Question
Question
Question
Question
Question
Question
Question
Question
Question
Question
Question
Question
Question
Question
The following table classifies an individual in two ways-by gender and by college attended. 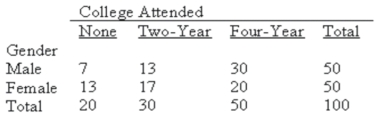 What is this two-way classification called?
A) Goodness-of-fit test
B) Frequency table
C) ANOVA table
D) Contingency table
What is this two-way classification called?A) Goodness-of-fit test
B) Frequency table
C) ANOVA table
D) Contingency table
Question
Question
Question
The educational level and the social activity of a sample of executives follow. 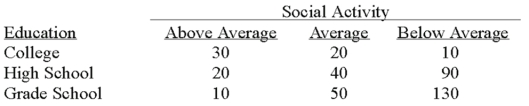 What does the expected frequency for the "above average" social activity and "high school" education equal?
A) 9.50
B) 60.00
C) 22.50
D) 28.50
What does the expected frequency for the "above average" social activity and "high school" education equal?A) 9.50
B) 60.00
C) 22.50
D) 28.50
Question
Question
Question
Question
Question
Question
Question
Question
Question
Question
Question
A distributor of personal computers has five locations in the city. The sales in units for the first quarter of the year were as follows: 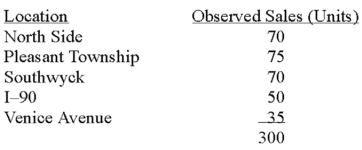 What is the critical value at the 0.01 level of risk?
A) 7.779
B) 15.033
C) 13.277
D) 5.412
What is the critical value at the 0.01 level of risk?A) 7.779
B) 15.033
C) 13.277
D) 5.412
Question
For people released from prison, the following table shows their adjustment to civilian life and place of residence. 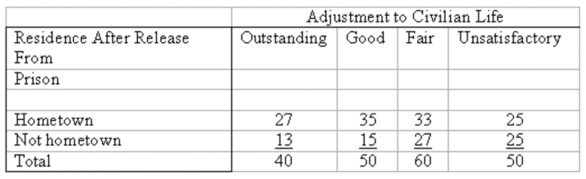 What is the critical value for this contingency table at the 0.01 level of significance?
A) 9.488
B) 2.070
C) 11.345
D) 13.277
What is the critical value for this contingency table at the 0.01 level of significance?A) 9.488
B) 2.070
C) 11.345
D) 13.277
Question
Question
A personnel manager is concerned about absenteeism. She decides to sample the records to determine if absenteeism is distributed evenly throughout the six-day workweek. The null hypothesis to be tested is: Absenteeism is distributed evenly throughout the week. The 0.01 level is to be used. The sample results are: 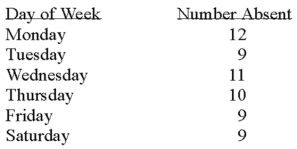 What is the expected frequency?
A) 9
B) 10
C) 11
D) 12
What is the expected frequency?A) 9
B) 10
C) 11
D) 12
Question
A personnel manager is concerned about absenteeism. She decides to sample the records to determine if absenteeism is distributed evenly throughout the six-day workweek. The null hypothesis to be tested is: Absenteeism is distributed evenly throughout the week. The 0.01 level is to be used. The sample results are: 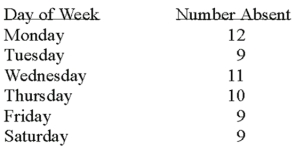 What kind of frequencies are the numbers 12, 9, 11, 10, 9, and 9 called?
A) Acceptance
B) Critical value
C) Expected
D) Observed
What kind of frequencies are the numbers 12, 9, 11, 10, 9, and 9 called?A) Acceptance
B) Critical value
C) Expected
D) Observed
Question
A recent study of the relationship between social activity and education showed the following results. 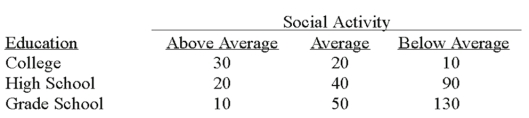 Using 0.05 as the significance level, what is the critical value for the test statistic?
A) 9.488
B) 5.991
C) 7.815
D) 3.841
Using 0.05 as the significance level, what is the critical value for the test statistic?A) 9.488
B) 5.991
C) 7.815
D) 3.841
Question
Question
A recent study of the relationship between social activity and education showed the following results. 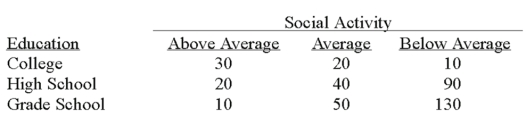 Based on the analysis, what can be concluded?
A) Social activity and education are correlated.
B) Social activity and education are not related.
C) Social activity and education are related.
D) No conclusion is possible.
Based on the analysis, what can be concluded?A) Social activity and education are correlated.
B) Social activity and education are not related.
C) Social activity and education are related.
D) No conclusion is possible.
Question
Question
A recent study of the relationship between social activity and education showed the following results. 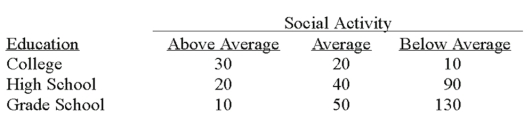 The appropriate test statistic for the analysis is a:
A) F-statistic
B) T-statistic
C) Chi-square statistic
D) Z-statistic
The appropriate test statistic for the analysis is a:A) F-statistic
B) T-statistic
C) Chi-square statistic
D) Z-statistic
Question
A recent study of the relationship between social activity and education showed the following results. 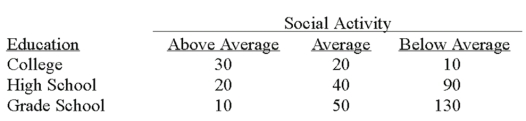 The null hypothesis for the analysis is:
A) There is no relationship between social activity and education.
B) The correlation between social activity and education is zero.
C) As social activity increases, education increases.
D) The mean of social activity equals the mean of education.
The null hypothesis for the analysis is:A) There is no relationship between social activity and education.
B) The correlation between social activity and education is zero.
C) As social activity increases, education increases.
D) The mean of social activity equals the mean of education.
Question
A personnel manager is concerned about absenteeism. She decides to sample the records to determine if absenteeism is distributed evenly throughout the six-day workweek. The null hypothesis to be tested is: Absenteeism is distributed evenly throughout the week. The 0.01 level is to be used. The sample results are: 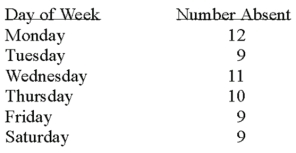 How many degrees of freedom are there?
A) 0
B) 3
C) 4
D) 5
How many degrees of freedom are there?A) 0
B) 3
C) 4
D) 5
Question
Recently, students in a marketing research class were interested in the driving behavior of students. Specifically, the marketing students were interested if exceeding the speed limit was related to social activity. They collected the following responses from 100 randomly selected students: 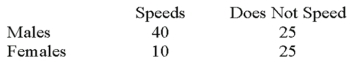 The null hypothesis for the analysis is:
A) There is no relationship between gender and driving behavior.
B) The correlation between driving behavior and gender is zero.
C) As driving behavior increases, gender increases.
D) The mean of driving behavior equals the mean of gender.
The null hypothesis for the analysis is:A) There is no relationship between gender and driving behavior.
B) The correlation between driving behavior and gender is zero.
C) As driving behavior increases, gender increases.
D) The mean of driving behavior equals the mean of gender.
Question
A personnel manager is concerned about absenteeism. She decides to sample the records to determine if absenteeism is distributed evenly throughout the six-day workweek. The null hypothesis to be tested is: Absenteeism is distributed evenly throughout the week. The 0.01 level is to be used. The sample results are: 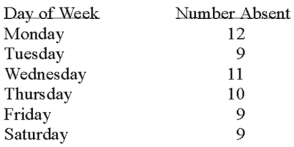 What is the calculated value of chi-square?
A) 1.0
B) 0.5
C) 0.8
D) 8.0
What is the calculated value of chi-square?A) 1.0
B) 0.5
C) 0.8
D) 8.0
Question
Question
A recent study of the relationship between social activity and education showed the following results. 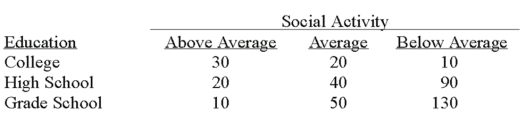 The appropriate test to analyze the relationship between social activity and education is:
A) Regression analysis
B) Analysis of variance
C) Contingency table analysis
D) Goodness-of-fit
The appropriate test to analyze the relationship between social activity and education is:A) Regression analysis
B) Analysis of variance
C) Contingency table analysis
D) Goodness-of-fit
Question
A personnel manager is concerned about absenteeism. She decides to sample the records to determine if absenteeism is distributed evenly throughout the six-day workweek. The null hypothesis to be tested is: Absenteeism is distributed evenly throughout the week. The 0.01 level is to be used. The sample results are: 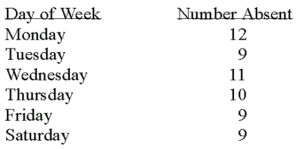
What is the critical value of chi-square with = 0.05?
A) 11.070
B) 12.592
C) 13.388
D) 15.033
What is the critical value of chi-square with = 0.05?
A) 11.070
B) 12.592
C) 13.388
D) 15.033
Question
When determining how well an observed set of frequencies fit an expected set of frequencies, what is the test statistic?
A) F-statistic.
B) t-statistic.
C) statistic.
D) z-statistic.
A) F-statistic.
B) t-statistic.
C)
statistic.D) z-statistic.
Question
Recently, students in a marketing research class were interested in the driving behavior of students. Specifically, the marketing students were interested if exceeding the speed limit was related to social activity. They collected the following responses from 100 randomly selected students: 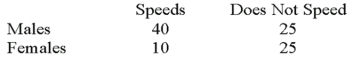 The degrees of freedom for the analysis is:
A) 1
B) 2
C) 3
D) 4
The degrees of freedom for the analysis is:A) 1
B) 2
C) 3
D) 4
Question
A recent study of the relationship between social activity and education showed the following results. 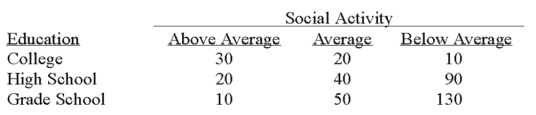 The degrees of freedom for the analysis is:
A) 1
B) 2
C) 3
D) 4
The degrees of freedom for the analysis is:A) 1
B) 2
C) 3
D) 4
Question
A recent study of the relationship between social activity and education showed the following results. 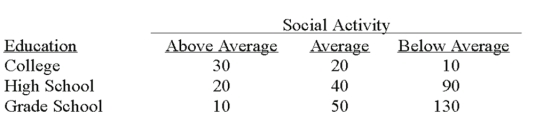 What is the value of the test statistic?
A) 100
B) 83.67
C) 50
D) 4.94
What is the value of the test statistic?A) 100
B) 83.67
C) 50
D) 4.94
Question
Question
Recently, students in a marketing research class were interested in the driving behavior of students. Specifically, the marketing students were interested if exceeding the speed limit was related to social activity. They collected the following responses from 100 randomly selected students: 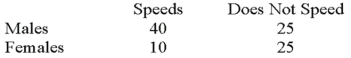 Using 0.05 as the significance level, what is the critical value for the test statistic?
A) 9.488
B) 5.991
C) 7.815
D) 3.841
Using 0.05 as the significance level, what is the critical value for the test statistic?A) 9.488
B) 5.991
C) 7.815
D) 3.841

Unlock Deck
Sign up to unlock the cards in this deck!
Unlock Deck
Unlock Deck
1/129
Play
Full screen (f)
Deck 17: Nonparametric Methods: Goodness-Of-Fit Tests
1
The chi-square distribution is positively skewed.
True
2
A Chi-square goodness-of-fit test is used to determine how well an observed distribution fits an __________ distribution.
Expected
3
The chi-square test statistic used in a goodness-of-fit test has k-1 degrees of freedom.
True
4
Nonparametric tests require no assumptions about the shape of the population distribution.
Unlock Deck
Unlock for access to all 129 flashcards in this deck.
Unlock Deck
k this deck
5
The computed value of chi-square statistic is always positive because the numerator is the difference between the observed frequencies and the expected frequencies _______________.
Unlock Deck
Unlock for access to all 129 flashcards in this deck.
Unlock Deck
k this deck
6
A scatter plot is a useful graphical method to determine if a set of sample data is from a normal population.
Unlock Deck
Unlock for access to all 129 flashcards in this deck.
Unlock Deck
k this deck
7
The claim that "male and female students at Coastal Carolina University prefer different parking lots on campus" is an example of a chi-square null hypothesis.
Unlock Deck
Unlock for access to all 129 flashcards in this deck.
Unlock Deck
k this deck
8
The shape of the chi-square distribution changes for each number of degrees of freedom.
Unlock Deck
Unlock for access to all 129 flashcards in this deck.
Unlock Deck
k this deck
9
There is not one, but a family of chi-square distributions. There is a chi-square distribution for 1 degree of freedom, another for 2 degrees of freedom, another for 3 degrees of freedom, and so on.
Unlock Deck
Unlock for access to all 129 flashcards in this deck.
Unlock Deck
k this deck
10
To test the null hypothesis that a set of sample data is normally distributed, we compare an expected normal distribution of the data to an observed distribution of the data.
Unlock Deck
Unlock for access to all 129 flashcards in this deck.
Unlock Deck
k this deck
11
What is the null hypothesis in the goodness-of-fit test? ____________
Unlock Deck
Unlock for access to all 129 flashcards in this deck.
Unlock Deck
k this deck
12
The shape of the chi-square distribution depends on the size of the sample.
Unlock Deck
Unlock for access to all 129 flashcards in this deck.
Unlock Deck
k this deck
13
A t-statistic is useful for computing an expected normal distribution.
Unlock Deck
Unlock for access to all 129 flashcards in this deck.
Unlock Deck
k this deck
14
What is the lowest level of data for which the chi-square goodness-of-fit test is appropriate? ______________
Unlock Deck
Unlock for access to all 129 flashcards in this deck.
Unlock Deck
k this deck
15
As the degrees of freedom increase, the shape of a chi-square distribution approaches a ______________________ distribution.
Unlock Deck
Unlock for access to all 129 flashcards in this deck.
Unlock Deck
k this deck
16
A F-test is useful for testing the null hypothesis that a set of sample data is normally distributed.
Unlock Deck
Unlock for access to all 129 flashcards in this deck.
Unlock Deck
k this deck
17
For a contingency table, the expected frequency for a cell is found by dividing the row total by the grand total.
Unlock Deck
Unlock for access to all 129 flashcards in this deck.
Unlock Deck
k this deck
18
In the goodness-of-fit test, the chi-square distribution is used to determine how well an observed distribution of observations "fits" an expected distribution of observations.
Unlock Deck
Unlock for access to all 129 flashcards in this deck.
Unlock Deck
k this deck
19
For a goodness-of-fit test, the following are possible null and alternate hypotheses:
H0: Sales are uniformly distributed among the five locations.
H1: Sales are not uniformly distributed among the five locations.
H0: Sales are uniformly distributed among the five locations.
H1: Sales are not uniformly distributed among the five locations.
Unlock Deck
Unlock for access to all 129 flashcards in this deck.
Unlock Deck
k this deck
20
For the goodness-of-fit test, the use of the chi-square statistic would be permissible in the following problem.
Unlock Deck
Unlock for access to all 129 flashcards in this deck.
Unlock Deck
k this deck
21
A contingency table shows the frequencies for three levels of income with gender. What are the degrees of freedom to test the null hypothesis that income and gender are independent? ______
Unlock Deck
Unlock for access to all 129 flashcards in this deck.
Unlock Deck
k this deck
22
If the computed value of a chi-square statistic is greater than the critical value, what is the decision regarding the null hypothesis? _________
Unlock Deck
Unlock for access to all 129 flashcards in this deck.
Unlock Deck
k this deck
23
In a contingency table, the decision to reject the null hypothesis is based on a __________ test statistic.
Unlock Deck
Unlock for access to all 129 flashcards in this deck.
Unlock Deck
k this deck
24
To verify that a frequency distribution for sample data is normally distributed, the expected frequencies are computed using probabilities from a _____________ distribution.
Unlock Deck
Unlock for access to all 129 flashcards in this deck.
Unlock Deck
k this deck
25
To test a hypothesis that a frequency distribution for sample data is normally distributed, class limits are transformed using a _____________.
Unlock Deck
Unlock for access to all 129 flashcards in this deck.
Unlock Deck
k this deck
26
For contingency table test of independence, the formula to compute the degrees of freedom is ___________________________________
Unlock Deck
Unlock for access to all 129 flashcards in this deck.
Unlock Deck
k this deck
27
What is the shape of the chi-square distribution? ___________________
Unlock Deck
Unlock for access to all 129 flashcards in this deck.
Unlock Deck
k this deck
28
The Anderson-Darling tests a null hypothesis that the sample data are _____________ distributed.
Unlock Deck
Unlock for access to all 129 flashcards in this deck.
Unlock Deck
k this deck
29
To test a hypothesis to verify that a frequency distribution for sample data is normally distributed, the expected frequencies are _______________ distributed.
Unlock Deck
Unlock for access to all 129 flashcards in this deck.
Unlock Deck
k this deck
30
For any goodness-of-fit test, the null hypothesis is that there is ____ difference between the expected and observed distributions.
Unlock Deck
Unlock for access to all 129 flashcards in this deck.
Unlock Deck
k this deck
31
When testing a goodness-of-fit null hypothesis, and there are extremely large differences between observed and expected frequencies, what decision should be made? ____________
Unlock Deck
Unlock for access to all 129 flashcards in this deck.
Unlock Deck
k this deck
32
Contingency table analysis can be used to test for a relationship between two _________ scaled variables.
Unlock Deck
Unlock for access to all 129 flashcards in this deck.
Unlock Deck
k this deck
33
The Anderson-Darling test compares a cumulative normal distribution to a cumulative distribution of the ___________ data.
Unlock Deck
Unlock for access to all 129 flashcards in this deck.
Unlock Deck
k this deck
34
In a contingency table, the decision to reject the null hypothesis is based on a __________ test statistic.
Unlock Deck
Unlock for access to all 129 flashcards in this deck.
Unlock Deck
k this deck
35
If the significance level for an Anderson-Darling test is 0.05 and the p-value is 0.001, the null hypothesis is rejected and we conclude that the data _________ normally distributed.
Unlock Deck
Unlock for access to all 129 flashcards in this deck.
Unlock Deck
k this deck
36
The test statistic for a goodness-of-fit test for unequal expected frequencies is a __________ statistic.
Unlock Deck
Unlock for access to all 129 flashcards in this deck.
Unlock Deck
k this deck
37
In a contingency table, multiplying the row total by the column total and dividing by the ___________ computes the expected frequency for a cell.
Unlock Deck
Unlock for access to all 129 flashcards in this deck.
Unlock Deck
k this deck
38
To verify that a frequency distribution for sample data is normally distributed, a _____________ statistic is used to test the hypothesis that the sample data is normally distributed.
Unlock Deck
Unlock for access to all 129 flashcards in this deck.
Unlock Deck
k this deck
39
For hypothesis tests using a chi-square statistic, the rejection region is in the _____________ tail of the chi-square distribution.
Unlock Deck
Unlock for access to all 129 flashcards in this deck.
Unlock Deck
k this deck
40
What is the degree of freedom for a chi-square goodness-of-fit test? ____________________________
Unlock Deck
Unlock for access to all 129 flashcards in this deck.
Unlock Deck
k this deck
41
A sample of 100 production workers is obtained. The workers are classified by gender (male, female) and by age (under 20, 20-29, 30-39 and 40 or over). How many degrees of freedom are there?
A) 0
B) 3
C) 6
D) 5
A) 0
B) 3
C) 6
D) 5
Unlock Deck
Unlock for access to all 129 flashcards in this deck.
Unlock Deck
k this deck
42
Which of the following are correct statements regarding the goodness-of-fit test?
A) Data may be of nominal scale
B) Population must be normal
C) All the expected frequencies must be equal
D) All the expected frequencies must be unequal
A) Data may be of nominal scale
B) Population must be normal
C) All the expected frequencies must be equal
D) All the expected frequencies must be unequal
Unlock Deck
Unlock for access to all 129 flashcards in this deck.
Unlock Deck
k this deck
43
A question has these possible choices-excellent, very good, good, fair and unsatisfactory. How many degrees of freedom are there using the goodness-of-fit test to the sample results?
A) 0
B) 2
C) 4
D) 5
A) 0
B) 2
C) 4
D) 5
Unlock Deck
Unlock for access to all 129 flashcards in this deck.
Unlock Deck
k this deck
44
The following table classifies an individual in two ways-by gender and by college attended. What is this two-way classification called?
A) Goodness-of-fit test
B) Frequency table
C) ANOVA table
D) Contingency table
What is this two-way classification called?A) Goodness-of-fit test
B) Frequency table
C) ANOVA table
D) Contingency table
Unlock Deck
Unlock for access to all 129 flashcards in this deck.
Unlock Deck
k this deck
45
What is the decision regarding the differences between the observed and expected frequencies if the critical value of chi-square is 9.488 and the computed value is 6.079?
A) The difference is probably due to sampling error; do not reject the null hypothesis
B) Not due to chance; reject the null hypothesis
C) Not due to chance; do not reject the alternate hypothesis
D) Too close; reserve judgment
A) The difference is probably due to sampling error; do not reject the null hypothesis
B) Not due to chance; reject the null hypothesis
C) Not due to chance; do not reject the alternate hypothesis
D) Too close; reserve judgment
Unlock Deck
Unlock for access to all 129 flashcards in this deck.
Unlock Deck
k this deck
46
To analyze data cross-classified in a contingency table, how are the degrees of freedom computed?
A) N - 1
B) Rows - Columns
C) (Rows) x (Columns)
D) (Rows - 1) x (Columns - 1)
A) N - 1
B) Rows - Columns
C) (Rows) x (Columns)
D) (Rows - 1) x (Columns - 1)
Unlock Deck
Unlock for access to all 129 flashcards in this deck.
Unlock Deck
k this deck
47
The educational level and the social activity of a sample of executives follow. What does the expected frequency for the "above average" social activity and "high school" education equal?
A) 9.50
B) 60.00
C) 22.50
D) 28.50
What does the expected frequency for the "above average" social activity and "high school" education equal?A) 9.50
B) 60.00
C) 22.50
D) 28.50
Unlock Deck
Unlock for access to all 129 flashcards in this deck.
Unlock Deck
k this deck
48
The chi-square statistic
A) is greater than or equal to zero.
B) is less than or equal to zero.
C) can be any value.
D) is equal to zero.
A) is greater than or equal to zero.
B) is less than or equal to zero.
C) can be any value.
D) is equal to zero.
Unlock Deck
Unlock for access to all 129 flashcards in this deck.
Unlock Deck
k this deck
49
What is our decision for a goodness-of-fit test with a computed value of chi-square of 1.273 and a critical value of 13.388?
A) Do not reject the null hypothesis
B) Reject the null hypothesis
C) Unable to reject or not reject the null hypothesis based on data
D) Should take a larger sample
A) Do not reject the null hypothesis
B) Reject the null hypothesis
C) Unable to reject or not reject the null hypothesis based on data
D) Should take a larger sample
Unlock Deck
Unlock for access to all 129 flashcards in this deck.
Unlock Deck
k this deck
50
Three new colors have been proposed for the Jeep Grand Cherokee vehicle. They are silvered-blue, almond, and willow green. The null hypothesis for a goodness-of-fit test would be
A) willow green is preferred over the other colors.
B) that there is no preference between the colors.
C) any one color is preferred over the other colors.
D) impossible to determine.
A) willow green is preferred over the other colors.
B) that there is no preference between the colors.
C) any one color is preferred over the other colors.
D) impossible to determine.
Unlock Deck
Unlock for access to all 129 flashcards in this deck.
Unlock Deck
k this deck
51
The chi-square statistic has
A) one distribution.
B) two distributions.
C) a family of distributions.
D) a uniform distribution.
A) one distribution.
B) two distributions.
C) a family of distributions.
D) a uniform distribution.
Unlock Deck
Unlock for access to all 129 flashcards in this deck.
Unlock Deck
k this deck
52
Which of the following are correct statements regarding the chi-square distribution?
A) Distribution is negatively skewed.
B) Chi-square is based on two sets of degrees of freedom, one for the numerator and one for the denominator.
C) Its shape is based on the degrees of freedom.
D) The variance is equal to one.
A) Distribution is negatively skewed.
B) Chi-square is based on two sets of degrees of freedom, one for the numerator and one for the denominator.
C) Its shape is based on the degrees of freedom.
D) The variance is equal to one.
Unlock Deck
Unlock for access to all 129 flashcards in this deck.
Unlock Deck
k this deck
53
The chi-square distribution becomes more symmetrical as
A) number of variables increase.
B) the chi-square value increases.
C) degrees of freedom decrease.
D) degrees of freedom increase.
A) number of variables increase.
B) the chi-square value increases.
C) degrees of freedom decrease.
D) degrees of freedom increase.
Unlock Deck
Unlock for access to all 129 flashcards in this deck.
Unlock Deck
k this deck
54
Which of the following assumptions is necessary to apply a goodness-of-fit test?
A) Normal population is required.
B) The data are measured with a nominal or ordinal scale.
C) Population variance must be known.
D) Both "a" and "c".
A) Normal population is required.
B) The data are measured with a nominal or ordinal scale.
C) Population variance must be known.
D) Both "a" and "c".
Unlock Deck
Unlock for access to all 129 flashcards in this deck.
Unlock Deck
k this deck
55
The chi-square distribution is
A) positively skewed.
B) negatively skewed.
C) normally distributed.
D) negatively or positively skewed.
A) positively skewed.
B) negatively skewed.
C) normally distributed.
D) negatively or positively skewed.
Unlock Deck
Unlock for access to all 129 flashcards in this deck.
Unlock Deck
k this deck
56
What is the critical value at the 0.05 level of significance for a goodness-of-fit test if there are six categories?
A) 3.841
B) 5.991
C) 7.815
D) 11.070
A) 3.841
B) 5.991
C) 7.815
D) 11.070
Unlock Deck
Unlock for access to all 129 flashcards in this deck.
Unlock Deck
k this deck
57
For any chi-square goodness-of-fit problem, the number of degrees of freedom is found by
A) n - k - 1.
B) k - 1.
C) n + 1.
D) n + k.
A) n - k - 1.
B) k - 1.
C) n + 1.
D) n + k.
Unlock Deck
Unlock for access to all 129 flashcards in this deck.
Unlock Deck
k this deck
58
A distributor of personal computers has five locations in the city. The sales in units for the first quarter of the year were as follows: What is the critical value at the 0.01 level of risk?
A) 7.779
B) 15.033
C) 13.277
D) 5.412
What is the critical value at the 0.01 level of risk?A) 7.779
B) 15.033
C) 13.277
D) 5.412
Unlock Deck
Unlock for access to all 129 flashcards in this deck.
Unlock Deck
k this deck
59
For people released from prison, the following table shows their adjustment to civilian life and place of residence. What is the critical value for this contingency table at the 0.01 level of significance?
A) 9.488
B) 2.070
C) 11.345
D) 13.277
What is the critical value for this contingency table at the 0.01 level of significance?A) 9.488
B) 2.070
C) 11.345
D) 13.277
Unlock Deck
Unlock for access to all 129 flashcards in this deck.
Unlock Deck
k this deck
60
Two chi-square distributions were plotted on the same chart. One distribution was for 3 degrees of freedom and the other was for 12 degrees of freedom. Which distribution would tend to approach a normal distribution?
A) 3 degrees
B) 12 degrees
C) 15 degrees
D) All would
A) 3 degrees
B) 12 degrees
C) 15 degrees
D) All would
Unlock Deck
Unlock for access to all 129 flashcards in this deck.
Unlock Deck
k this deck
61
A personnel manager is concerned about absenteeism. She decides to sample the records to determine if absenteeism is distributed evenly throughout the six-day workweek. The null hypothesis to be tested is: Absenteeism is distributed evenly throughout the week. The 0.01 level is to be used. The sample results are: What is the expected frequency?
A) 9
B) 10
C) 11
D) 12
What is the expected frequency?A) 9
B) 10
C) 11
D) 12
Unlock Deck
Unlock for access to all 129 flashcards in this deck.
Unlock Deck
k this deck
62
A personnel manager is concerned about absenteeism. She decides to sample the records to determine if absenteeism is distributed evenly throughout the six-day workweek. The null hypothesis to be tested is: Absenteeism is distributed evenly throughout the week. The 0.01 level is to be used. The sample results are: What kind of frequencies are the numbers 12, 9, 11, 10, 9, and 9 called?
A) Acceptance
B) Critical value
C) Expected
D) Observed
What kind of frequencies are the numbers 12, 9, 11, 10, 9, and 9 called?A) Acceptance
B) Critical value
C) Expected
D) Observed
Unlock Deck
Unlock for access to all 129 flashcards in this deck.
Unlock Deck
k this deck
63
A recent study of the relationship between social activity and education showed the following results. Using 0.05 as the significance level, what is the critical value for the test statistic?
A) 9.488
B) 5.991
C) 7.815
D) 3.841
Using 0.05 as the significance level, what is the critical value for the test statistic?A) 9.488
B) 5.991
C) 7.815
D) 3.841
Unlock Deck
Unlock for access to all 129 flashcards in this deck.
Unlock Deck
k this deck
64
For a chi-square test involving a contingency table, suppose the null hypothesis is rejected. We conclude that the two variables are
A) linear.
B) curvilinear.
C) not related.
D) related.
A) linear.
B) curvilinear.
C) not related.
D) related.
Unlock Deck
Unlock for access to all 129 flashcards in this deck.
Unlock Deck
k this deck
65
A recent study of the relationship between social activity and education showed the following results. Based on the analysis, what can be concluded?
A) Social activity and education are correlated.
B) Social activity and education are not related.
C) Social activity and education are related.
D) No conclusion is possible.
Based on the analysis, what can be concluded?A) Social activity and education are correlated.
B) Social activity and education are not related.
C) Social activity and education are related.
D) No conclusion is possible.
Unlock Deck
Unlock for access to all 129 flashcards in this deck.
Unlock Deck
k this deck
66
The computed chi-square value is positive because the difference between the observed and expected frequencies is
A) squared.
B) linear.
C) uniform.
D) always positive.
A) squared.
B) linear.
C) uniform.
D) always positive.
Unlock Deck
Unlock for access to all 129 flashcards in this deck.
Unlock Deck
k this deck
67
A recent study of the relationship between social activity and education showed the following results. The appropriate test statistic for the analysis is a:
A) F-statistic
B) T-statistic
C) Chi-square statistic
D) Z-statistic
The appropriate test statistic for the analysis is a:A) F-statistic
B) T-statistic
C) Chi-square statistic
D) Z-statistic
Unlock Deck
Unlock for access to all 129 flashcards in this deck.
Unlock Deck
k this deck
68
A recent study of the relationship between social activity and education showed the following results. The null hypothesis for the analysis is:
A) There is no relationship between social activity and education.
B) The correlation between social activity and education is zero.
C) As social activity increases, education increases.
D) The mean of social activity equals the mean of education.
The null hypothesis for the analysis is:A) There is no relationship between social activity and education.
B) The correlation between social activity and education is zero.
C) As social activity increases, education increases.
D) The mean of social activity equals the mean of education.
Unlock Deck
Unlock for access to all 129 flashcards in this deck.
Unlock Deck
k this deck
69
A personnel manager is concerned about absenteeism. She decides to sample the records to determine if absenteeism is distributed evenly throughout the six-day workweek. The null hypothesis to be tested is: Absenteeism is distributed evenly throughout the week. The 0.01 level is to be used. The sample results are: How many degrees of freedom are there?
A) 0
B) 3
C) 4
D) 5
How many degrees of freedom are there?A) 0
B) 3
C) 4
D) 5
Unlock Deck
Unlock for access to all 129 flashcards in this deck.
Unlock Deck
k this deck
70
Recently, students in a marketing research class were interested in the driving behavior of students. Specifically, the marketing students were interested if exceeding the speed limit was related to social activity. They collected the following responses from 100 randomly selected students: The null hypothesis for the analysis is:
A) There is no relationship between gender and driving behavior.
B) The correlation between driving behavior and gender is zero.
C) As driving behavior increases, gender increases.
D) The mean of driving behavior equals the mean of gender.
The null hypothesis for the analysis is:A) There is no relationship between gender and driving behavior.
B) The correlation between driving behavior and gender is zero.
C) As driving behavior increases, gender increases.
D) The mean of driving behavior equals the mean of gender.
Unlock Deck
Unlock for access to all 129 flashcards in this deck.
Unlock Deck
k this deck
71
A personnel manager is concerned about absenteeism. She decides to sample the records to determine if absenteeism is distributed evenly throughout the six-day workweek. The null hypothesis to be tested is: Absenteeism is distributed evenly throughout the week. The 0.01 level is to be used. The sample results are: What is the calculated value of chi-square?
A) 1.0
B) 0.5
C) 0.8
D) 8.0
What is the calculated value of chi-square?A) 1.0
B) 0.5
C) 0.8
D) 8.0
Unlock Deck
Unlock for access to all 129 flashcards in this deck.
Unlock Deck
k this deck
72
Which of the following can be used to test the hypothesis that two nominal variables are related?
A) a contingency table.
B) a chi-square table.
C) an ANOVA table.
D) a scatter diagram.
A) a contingency table.
B) a chi-square table.
C) an ANOVA table.
D) a scatter diagram.
Unlock Deck
Unlock for access to all 129 flashcards in this deck.
Unlock Deck
k this deck
73
A recent study of the relationship between social activity and education showed the following results. The appropriate test to analyze the relationship between social activity and education is:
A) Regression analysis
B) Analysis of variance
C) Contingency table analysis
D) Goodness-of-fit
The appropriate test to analyze the relationship between social activity and education is:A) Regression analysis
B) Analysis of variance
C) Contingency table analysis
D) Goodness-of-fit
Unlock Deck
Unlock for access to all 129 flashcards in this deck.
Unlock Deck
k this deck
74
A personnel manager is concerned about absenteeism. She decides to sample the records to determine if absenteeism is distributed evenly throughout the six-day workweek. The null hypothesis to be tested is: Absenteeism is distributed evenly throughout the week. The 0.01 level is to be used. The sample results are:
What is the critical value of chi-square with = 0.05?
A) 11.070
B) 12.592
C) 13.388
D) 15.033
What is the critical value of chi-square with = 0.05?
A) 11.070
B) 12.592
C) 13.388
D) 15.033
Unlock Deck
Unlock for access to all 129 flashcards in this deck.
Unlock Deck
k this deck
75
When determining how well an observed set of frequencies fit an expected set of frequencies, what is the test statistic?
A) F-statistic.
B) t-statistic.
C) statistic.
D) z-statistic.
A) F-statistic.
B) t-statistic.
C)
statistic.D) z-statistic.
Unlock Deck
Unlock for access to all 129 flashcards in this deck.
Unlock Deck
k this deck
76
Recently, students in a marketing research class were interested in the driving behavior of students. Specifically, the marketing students were interested if exceeding the speed limit was related to social activity. They collected the following responses from 100 randomly selected students: The degrees of freedom for the analysis is:
A) 1
B) 2
C) 3
D) 4
The degrees of freedom for the analysis is:A) 1
B) 2
C) 3
D) 4
Unlock Deck
Unlock for access to all 129 flashcards in this deck.
Unlock Deck
k this deck
77
A recent study of the relationship between social activity and education showed the following results. The degrees of freedom for the analysis is:
A) 1
B) 2
C) 3
D) 4
The degrees of freedom for the analysis is:A) 1
B) 2
C) 3
D) 4
Unlock Deck
Unlock for access to all 129 flashcards in this deck.
Unlock Deck
k this deck
78
A recent study of the relationship between social activity and education showed the following results. What is the value of the test statistic?
A) 100
B) 83.67
C) 50
D) 4.94
What is the value of the test statistic?A) 100
B) 83.67
C) 50
D) 4.94
Unlock Deck
Unlock for access to all 129 flashcards in this deck.
Unlock Deck
k this deck
79
In a goodness-of-fit test, the null hypothesis (no difference between sets of observed and expected frequencies) is rejected when the
A) computed chi-square is less than the critical value.
B) difference between the observed and expected frequencies is significantly large.
C) difference between the observed and expected frequencies is small.
D) difference between the observed and expected frequencies occurs by chance.
A) computed chi-square is less than the critical value.
B) difference between the observed and expected frequencies is significantly large.
C) difference between the observed and expected frequencies is small.
D) difference between the observed and expected frequencies occurs by chance.
Unlock Deck
Unlock for access to all 129 flashcards in this deck.
Unlock Deck
k this deck
80
Recently, students in a marketing research class were interested in the driving behavior of students. Specifically, the marketing students were interested if exceeding the speed limit was related to social activity. They collected the following responses from 100 randomly selected students: Using 0.05 as the significance level, what is the critical value for the test statistic?
A) 9.488
B) 5.991
C) 7.815
D) 3.841
Using 0.05 as the significance level, what is the critical value for the test statistic?A) 9.488
B) 5.991
C) 7.815
D) 3.841
Unlock Deck
Unlock for access to all 129 flashcards in this deck.
Unlock Deck
k this deck
Unlock Deck
Unlock for access to all 129 flashcards in this deck.


