Exam 17: Nonparametric Methods: Goodness-Of-Fit Tests
Exam 1: What Is Statistics79 Questions
Exam 2: Describing Data: Frequency Tables, Frequency Distributions, and Graphic Presentation129 Questions
Exam 3: Describing Data: Numerical Measures132 Questions
Exam 4: Describing Data: Displaying and Exploring Data108 Questions
Exam 5: A Survey of Probability Concepts130 Questions
Exam 6: Discrete Probability Distributions128 Questions
Exam 7: Continuous Probability Distributions131 Questions
Exam 8: Sampling Methods and the Central Limit Theorem115 Questions
Exam 9: Estimation and Confidence Intervals129 Questions
Exam 10: One-Sample Tests of Hypothesis134 Questions
Exam 11: Two-Sample Tests of Hypothesis130 Questions
Exam 12: Analysis of Variance128 Questions
Exam 13: Correlation and Linear Regression130 Questions
Exam 14: Multiple Regression Analysis129 Questions
Exam 15: Index Numbers129 Questions
Exam 16: Time Series and Forecasting129 Questions
Exam 17: Nonparametric Methods: Goodness-Of-Fit Tests129 Questions
Exam 18: Nonparametric Methods: Analysis of Ranked Data129 Questions
Exam 19: Statistical Process Control and Quality Management129 Questions
Exam 20: An Introduction to Decision Theory115 Questions
Select questions type
A scatter plot is a useful graphical method to determine if a set of sample data is from a normal population.
Free
(True/False)
4.9/5  (39)
(39)
Correct Answer: Verified
False
The claim that "male and female students at Coastal Carolina University prefer different parking lots on campus" is an example of a chi-square null hypothesis.
Free
(True/False)
4.9/5 (36)
Correct Answer:Verified
False
For hypothesis tests using a chi-square statistic, the rejection region is in the _____________ tail of the chi-square distribution.
Free
(Short Answer)
4.7/5 (36)
Correct Answer:Verified
Right
We are interested in knowing if the following frequency distribution is normally distributed. The mean and standard deviation of the data is 600 and 160. 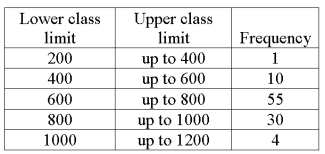 To test the hypothesis that the frequency distribution is normally distributed, the value of the chi-square test statistic is 12.19. What is the decision regarding the null hypothesis tested at the .05 level of significance?
(Essay)
4.9/5 (36)
A personnel manager is concerned about absenteeism. She decides to sample the records to determine if absenteeism is distributed evenly throughout the six-day workweek. The null hypothesis to be tested is: Absenteeism is distributed evenly throughout the week. The 0.01 level is to be used. The sample results are: 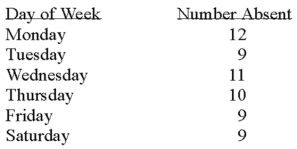 What is the expected frequency?
(Multiple Choice)
4.8/5 (30)
A survey of the opinions of property owners about a street widening project was taken to determine whether the property owners' opinions were related to their property's distance (front-footage) from the street. A randomly selected sample of 100 property owners was contacted and the results are shown below. 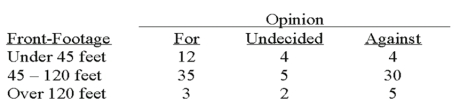 What kind of table is this classification?
(Short Answer)
4.9/5 (37)
For the goodness-of-fit test, the use of the chi-square statistic would be permissible in the following problem. 
(True/False)
4.8/5 (45)
To test for a normal distribution of a frequency distribution with 5 classes, we need to
(Multiple Choice)
4.9/5 (35)
A survey of the opinions of property owners about a street widening project was taken to determine whether the property owners' opinions were related to their property's distance (front-footage) from the street. A randomly selected sample of 100 property owners was contacted and the results are shown below. 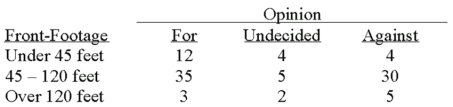 What is the null hypothesis?
(Essay)
4.8/5 (42)
Recently, students in a marketing research class were interested in the driving behavior of students. Specifically, the marketing students were interested if exceeding the speed limit was related to social activity. They collected the following responses from 100 randomly selected students: 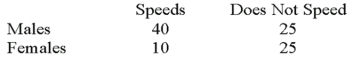 The degrees of freedom for the analysis is:
(Multiple Choice)
4.7/5 (36)
For any chi-square goodness-of-fit problem, the number of degrees of freedom is found by
(Multiple Choice)
4.8/5 (39)
What is the degree of freedom for a chi-square goodness-of-fit test? ____________________________
(Short Answer)
4.8/5 (28)
A recent study of the relationship between social activity and education showed the following results. 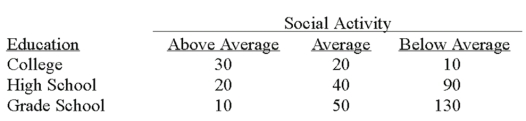 The null hypothesis for the analysis is:
(Multiple Choice)
4.8/5 (31)
When determining how well an observed set of frequencies fit an expected set of frequencies, what is the test statistic?
(Multiple Choice)
4.8/5 (27)
A sample of 100 production workers is obtained. The workers are classified by gender (male, female) and by age (under 20, 20-29, 30-39 and 40 or over). How many degrees of freedom are there?
(Multiple Choice)
4.8/5 (37)
A personnel manager is concerned about absenteeism. She decides to sample the records to determine if absenteeism is distributed evenly throughout the six-day workweek. The null hypothesis to be tested is: Absenteeism is distributed evenly throughout the week. The 0.01 level is to be used. The sample results are: 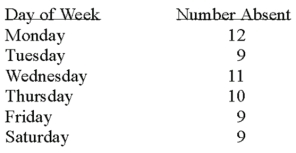 How many degrees of freedom are there?
(Multiple Choice)
4.9/5 (28)
What is the shape of the chi-square distribution? ___________________
(Short Answer)
5.0/5 (17)
A survey of the opinions of property owners about a street widening project was taken to determine whether the resulting opinion was related to the distance from the street. A randomly selected sample of 100 property owners was contacted and the results are shown below. 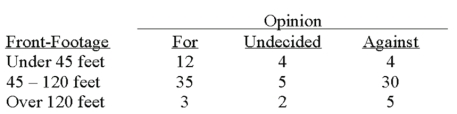 What is the expected frequency for people who are undecided about the project and have property front-footage between 45 and 120 feet?
(Multiple Choice)
4.8/5 (28)
To verify that a frequency distribution for sample data is normally distributed, a _____________ statistic is used to test the hypothesis that the sample data is normally distributed.
(Short Answer)
4.8/5 (39)
To test for a normal distribution of a frequency distribution with 5 classes, we need to find
(Multiple Choice)
4.7/5 (30)
Filters
- Essay(0)
- Multiple Choice(0)
- Short Answer(0)
- True False(0)
- Matching(0)