Deck 2: Displaying and Describing Categorical Data
Full screen (f)
Question
A company held a blood pressure screening clinic for its employees.The results are summarized in the table below by age group and blood pressure level. 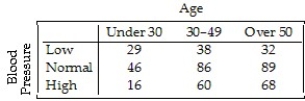
Find the marginal distribution of blood pressure level.
A)20% low,40% normal,41% high
B)20% under 30,40% between 30-49,41% over 50
C)21% low,48% normal,31% high
D)32% low,51% normal,18% high
E)27% low,91% normal,45% high
Find the marginal distribution of blood pressure level.
A)20% low,40% normal,41% high
B)20% under 30,40% between 30-49,41% over 50
C)21% low,48% normal,31% high
D)32% low,51% normal,18% high
E)27% low,91% normal,45% high
Question
A poll asked adults which activities they had engaged in during the past month.The results are listed below. 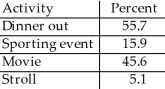
Is it reasonable to conclude that 61.5% of those polled had seen a movie or gone to a sporting event during the past month?
A)Yes,because these categories do not overlap.
B)No,because the percentages in relative frequencies tables can never be added.
C)Yes,because the percentages can always be added in relative frequency tables.
D)No,because these categories overlap.
E)No,because the poll is not based on a large enough number of individuals.
Question
The City of Windsor Department of Parks and Recreation is planning to build a recreation centre in one of the city's parks.They conducted a poll to find out the types of physical activities the local population would be interested in.The poll was based on telephone responses from 1013 randomly selected adults.The table shows the percentages of people who expressed interest in various activities. 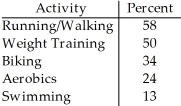
What percent of adults polled did not express interest in any of these activities?
A)21%
B)179%
C)79%
D)90%
E)The percent cannot be determined from the given percentages because the categories overlap.
What percent of adults polled did not express interest in any of these activities?
A)21%
B)179%
C)79%
D)90%
E)The percent cannot be determined from the given percentages because the categories overlap.
Question
A newspaper surveyed its subscribers as to which section of the paper they read first.The results are listed below. 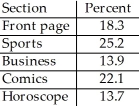
What percent of subscribers read a section of the paper not listed above first?
A)6.8%
B)4.7%
C)7.2%
D)8.3%
E)The percent cannot be determined from the given percentages because the categories overlap.
What percent of subscribers read a section of the paper not listed above first?
A)6.8%
B)4.7%
C)7.2%
D)8.3%
E)The percent cannot be determined from the given percentages because the categories overlap.
Question
Students in a political science course were asked to describe their politics as "Liberal","Moderate",or "Conservative." Here are the results: 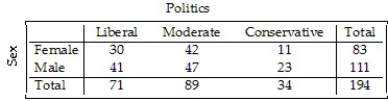
What percent of the class considers themselves to be "Liberal"?
A)36.1%
B)57.7%
C)21.1%
D)36.6%
E)15.5%
What percent of the class considers themselves to be "Liberal"?
A)36.1%
B)57.7%
C)21.1%
D)36.6%
E)15.5%
Question
A survey of automobiles parked in student and staff lots at a large university classified the brands by country of origin,as seen in the table. 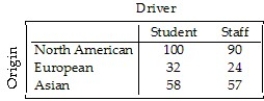
What is the conditional distribution of origin for students?
A)53% North American,16% European,32% Asian
B)25% North American,7% European,16% Asian
C)53% North American,14% European,33% Asian
D)53% North American,17% European,31% Asian
E)28% North American,9% European,16% Asian
What is the conditional distribution of origin for students?
A)53% North American,16% European,32% Asian
B)25% North American,7% European,16% Asian
C)53% North American,14% European,33% Asian
D)53% North American,17% European,31% Asian
E)28% North American,9% European,16% Asian
Question
The City of Windsor Department of Parks and Recreation is planning to build a recreation centre in one of the city's parks.They conducted a poll to find out the types of physical activities the local population would be interested in.The poll was based on telephone responses from 1013 randomly selected adults.The table shows the percentages of people who expressed interest in various activities. 
Is it reasonable to conclude that 59% expressed interest in either biking or aerobics?
A)Yes,because these categories do not overlap.
B)No,because the poll is not based on a large-enough number of individuals.
C)No,because these categories overlap.
D)No,because the percentages in relative frequencies tables can never be added.
E)Yes,because the percentages can always be added in relative frequency tables.
Question
A company held a blood pressure screening clinic for its employees.The results are summarized in the table below by age group and blood pressure level. 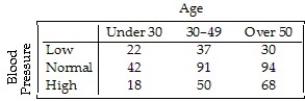
Find the conditional distribution of blood pressure level for employees between 30 and 49.
A)27% low,51% normal,22% high
B)8% low,20% normal,11% high
C)20% low,50% normal,30% high
D)21% low,51% normal,28% high
E)16% low,49% normal,35% high
Find the conditional distribution of blood pressure level for employees between 30 and 49.
A)27% low,51% normal,22% high
B)8% low,20% normal,11% high
C)20% low,50% normal,30% high
D)21% low,51% normal,28% high
E)16% low,49% normal,35% high
Question
Students in a political science course were asked to describe their politics as "Liberal","Moderate",or "Conservative." Here are the results: 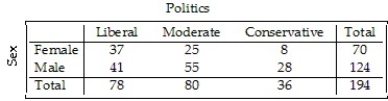
What percent of all males in the class are "Liberals"?
A)21.1%
B)33.1%
C)40.2%
D)52.9%
E)52.6%
What percent of all males in the class are "Liberals"?
A)21.1%
B)33.1%
C)40.2%
D)52.9%
E)52.6%
Question
Statistics Canada gives the following mortality data for Canada in 2007. 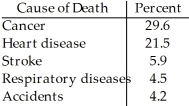
Is it reasonable to conclude that cancer or accidents were the cause of approximately 33.8% of deaths in 2002?
A)No,because the percentages do not add up to 100%.
B)Yes,because these categories do not overlap.
C)Yes,because the percentages can always be added in relative frequency tables.
D)No,because the percentages in relative frequencies tables can never be added.
E)No,because these categories overlap.
Question
Question
Students in a political science course were asked to describe their politics as "Liberal","Moderate",or "Conservative." Here are the results: 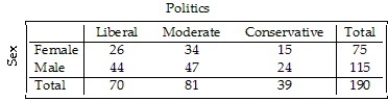
What percent of the females in the class consider themselves to be "Liberal"?
A)38.3%
B)45.3%
C)34.7%
D)37.1%
E)36.8%
What percent of the females in the class consider themselves to be "Liberal"?
A)38.3%
B)45.3%
C)34.7%
D)37.1%
E)36.8%
Question
A survey of automobiles parked in student and staff lots at a large university classified the brands by country of origin,as seen in the table. 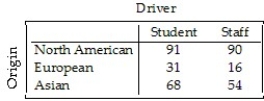
What is the marginal distribution of origin?
A)52% North American,13% European,35% Asian
B)56% North American,10% European,34% Asian
C)54% Students,46% Staff
D)107% North American,16% European,54% Asian
E)48% North American,16% European,36% Asian
What is the marginal distribution of origin?
A)52% North American,13% European,35% Asian
B)56% North American,10% European,34% Asian
C)54% Students,46% Staff
D)107% North American,16% European,54% Asian
E)48% North American,16% European,36% Asian
Question
A real estate company kept a database on the apartments in a certain city.The percentages of various types of apartments are listed below. 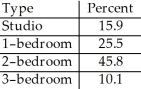
What percentage of the apartments in the city are 1-bedroom or 2-bedroom apartments?
A)69.9%
B)69.4%
C)71.3%
D)73.3%
E)The percent cannot be determined from the given percentages because the categories overlap.
What percentage of the apartments in the city are 1-bedroom or 2-bedroom apartments?
A)69.9%
B)69.4%
C)71.3%
D)73.3%
E)The percent cannot be determined from the given percentages because the categories overlap.
Question
Statistics Canada gives the following mortality data for Canada in 2007. 
What percent of deaths were from causes not listed here?
A)58.5%
B)34.3%
C)36%
D)65.7%
E)The percent cannot be determined from the given percentages because the categories overlap.
What percent of deaths were from causes not listed here?
A)58.5%
B)34.3%
C)36%
D)65.7%
E)The percent cannot be determined from the given percentages because the categories overlap.
Question
A company held a blood pressure screening clinic for its employees.The results are summarized in the table below by age group and blood pressure level. 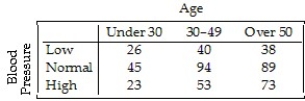
Find the conditional distribution of blood pressure level for employees over 50.
A)8% low,19% normal,15% high
B)21% low,50% normal,28% high
C)28% low,48% normal,24% high
D)19% low,45% normal,37% high
E)22% low,47% normal,31% high
Find the conditional distribution of blood pressure level for employees over 50.
A)8% low,19% normal,15% high
B)21% low,50% normal,28% high
C)28% low,48% normal,24% high
D)19% low,45% normal,37% high
E)22% low,47% normal,31% high
Question
A newspaper surveyed its subscribers as to which section of the paper they read first.The results are listed below. 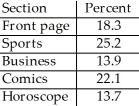
Is it reasonable to conclude that 39.1% of the paper's subscribers read the business or sports sections first?
A)Yes,because the percentages can always be added in relative frequency tables.
B)No,because the percentages in relative frequencies tables can never be added.
C)No,because the percentages do not add up to 100%.
D)No,because these categories overlap.
E)Yes,because these categories do not overlap.
Question
A company held a blood pressure screening clinic for its employees.The results are summarized in the table below by age group and blood pressure level. 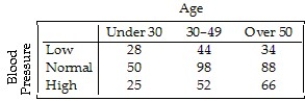
Find the conditional distribution of blood pressure level for employees under 30.
A)18% low,47% normal,35% high
B)23% low,51% normal,27% high
C)22% low,49% normal,29% high
D)27% low,49% normal,24% high
E)6% low,10% normal,5% high
Find the conditional distribution of blood pressure level for employees under 30.
A)18% low,47% normal,35% high
B)23% low,51% normal,27% high
C)22% low,49% normal,29% high
D)27% low,49% normal,24% high
E)6% low,10% normal,5% high
Question
A survey of automobiles parked in student and staff lots at a large university classified the brands by country of origin,as seen in the table. 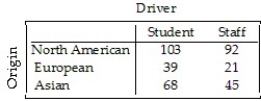
What is the conditional distribution of origin for staff?
A)25% North American,6% European,12% Asian
B)49% North American,19% European,32% Asian
C)28% North American,11% European,18% Asian
D)53% North American,16% European,31% Asian
E)58% North American,13% European,28% Asian
What is the conditional distribution of origin for staff?
A)25% North American,6% European,12% Asian
B)49% North American,19% European,32% Asian
C)28% North American,11% European,18% Asian
D)53% North American,16% European,31% Asian
E)58% North American,13% European,28% Asian
Question
Question
A college examined the impact of an applicant's ethnicity on the likelihood of admission to a particular program.The data are summarized in the table below. 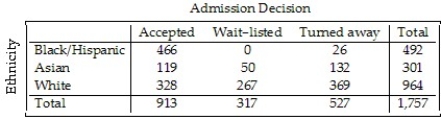
What percent of all applicants were Black or Hispanic?
A)28%
B)26.5%
C)53.9%
D)48%
E)17.1%
What percent of all applicants were Black or Hispanic?
A)28%
B)26.5%
C)53.9%
D)48%
E)17.1%
Question
A survey of automobiles parked in student and staff lots at a large university classified the brands by country of origin,as seen in the table. 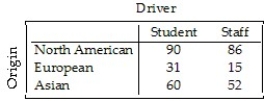
What percent of the North American cars were owned by staff?
A)48.9%
B)51.1%
C)56.2%
D)25.7%
E)128.4%
What percent of the North American cars were owned by staff?
A)48.9%
B)51.1%
C)56.2%
D)25.7%
E)128.4%
Question
A survey of automobiles parked in student and staff lots at a large university classified the brands by country of origin,as seen in the table. 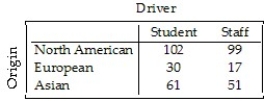
What percent of all the cars surveyed were foreign?
A)44.2%
B)18.9%
C)13.1%
D)25.3%
E)31.1%
What percent of all the cars surveyed were foreign?
A)44.2%
B)18.9%
C)13.1%
D)25.3%
E)31.1%
Question
Just how accurate are the weather forecasts we hear every day? The table below compares the daily forecast with a city's actual weather for a year. 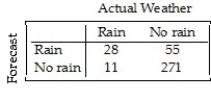
What percent of the time was the forecast correct?
A)74.2%
B)7.7%
C)81.9%
D)77.3%
E)18.1%
What percent of the time was the forecast correct?
A)74.2%
B)7.7%
C)81.9%
D)77.3%
E)18.1%
Question
A college examined the impact of an applicant's ethnicity on the likelihood of admission to a particular program.The data are summarized in the table below. 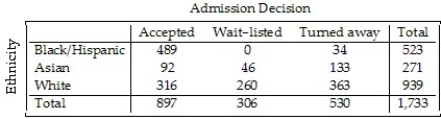
What percent of all students were turned away?
A)51.8%
B)17.7%
C)30.2%
D)30.6%
E)44.1%
What percent of all students were turned away?
A)51.8%
B)17.7%
C)30.2%
D)30.6%
E)44.1%
Question
Just how accurate are the weather forecasts we hear every day? The table below compares the daily forecast with a city's actual weather for a year. 
On what percent of days was rain predicted?
A)14.8%
B)24.1%
C)38.6%
D)9.3%
E)11.5%
On what percent of days was rain predicted?
A)14.8%
B)24.1%
C)38.6%
D)9.3%
E)11.5%
Question
Most patients who undergo surgery make routine recoveries and are discharged as planned,but some patients experience complications and their discharge is delayed.A small city has a large hospital and a small hospital,each performing major and minor surgeries.Data is collected at each hospital to see how many surgical patients have their discharges delayed by postsurgical complications.The results are shown in the following table. 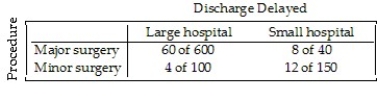
Overall,for what percent of surgical patients was discharge delayed?
A)1.8%
B)9.4%
C)42%
D)9.1%
E)7.6%
Overall,for what percent of surgical patients was discharge delayed?
A)1.8%
B)9.4%
C)42%
D)9.1%
E)7.6%
Question
Most patients who undergo surgery make routine recoveries and are discharged as planned,but some patients experience complications and their discharge is delayed.A small city has a large hospital and a small hospital,each performing major and minor surgeries.Data is collected at each hospital to see how many surgical patients have their discharges delayed by postsurgical complications.The results are shown in the following table. 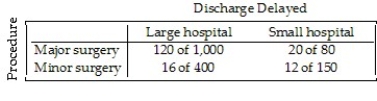
What were the discharge delay rates for each kind of surgery?
A)Major surgery: 13%
Minor surgery: 5.1%
B)Major surgery: 10.3%
Minor surgery: 10.3%
C)Major surgery: 9.7%
Minor surgery: 13.9%
D)Major surgery: 8.6%
Minor surgery: 1.7%
E)Major surgery: 37%
Minor surgery: 12%
What were the discharge delay rates for each kind of surgery?
A)Major surgery: 13%
Minor surgery: 5.1%
B)Major surgery: 10.3%
Minor surgery: 10.3%
C)Major surgery: 9.7%
Minor surgery: 13.9%
D)Major surgery: 8.6%
Minor surgery: 1.7%
E)Major surgery: 37%
Minor surgery: 12%
Question
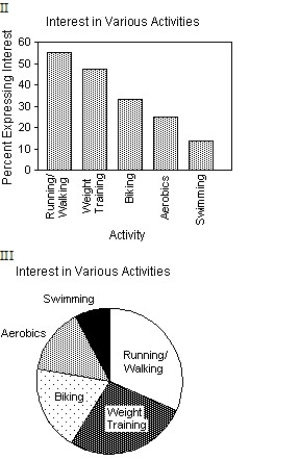
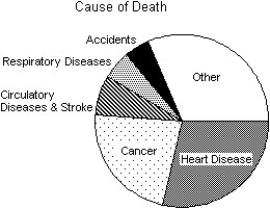
The Centers for Disease Control in the U.S.A.lists causes of death for individual states in 2002.The mortality data for one state is given. 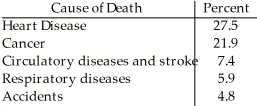
Which of the following displays is/are appropriate for these data? (More than one display may be appropriate. )
I II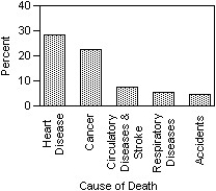
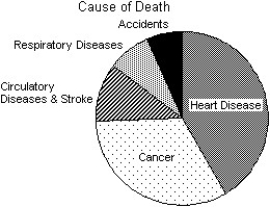
III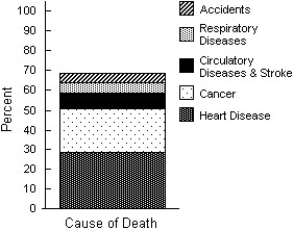
A)I,II
B)I
C)I,III
D)I,II,III
E)None of these displays are appropriate.
Which of the following displays is/are appropriate for these data? (More than one display may be appropriate. )
I II
III
A)I,II
B)I
C)I,III
D)I,II,III
E)None of these displays are appropriate.
Question
A survey of automobiles parked in student and staff lots at a large university classified the brands by country of origin,as seen in the table. 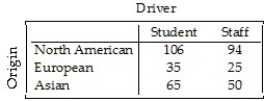
What percent of the foreign cars were owned by students?
A)42.9%
B)57.1%
C)37.1%
D)20%
E)26.7%
What percent of the foreign cars were owned by students?
A)42.9%
B)57.1%
C)37.1%
D)20%
E)26.7%
Question
Students in a political science course were asked to describe their politics as "Liberal","Moderate",or "Conservative." Here are the results: 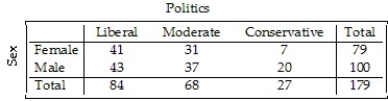
What percent of all students in the class are males who consider themselves to be "Liberal"?
A)51.2%
B)43%
C)24%
D)46.9%
E)22.9%
What percent of all students in the class are males who consider themselves to be "Liberal"?
A)51.2%
B)43%
C)24%
D)46.9%
E)22.9%
Question
A college examined the impact of an applicant's ethnicity on the likelihood of admission to a particular program.The data are summarized in the table below. 
What percent of Asians were wait-listed?
A)17.5%
B)3.3%
C)18.5%
D)36.1%
E)45.4%
What percent of Asians were wait-listed?
A)17.5%
B)3.3%
C)18.5%
D)36.1%
E)45.4%
Question
Students in a political science course were asked to describe their politics as "Liberal","Moderate",or "Conservative." Here are the results: 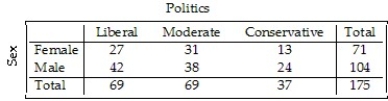
What percent of all "Moderates" in the class are male?
A)44.9%
B)55.1%
C)21.7%
D)36.5%
E)39.4%
What percent of all "Moderates" in the class are male?
A)44.9%
B)55.1%
C)21.7%
D)36.5%
E)39.4%
Question
A survey of automobiles parked in student and staff lots at a large university classified the brands by country of origin,as seen in the table. 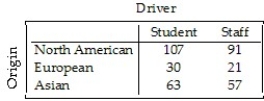
What percent of the staff owned North American cars?
A)24.7%
B)116.7%
C)53.8%
D)53.5%
E)46%
What percent of the staff owned North American cars?
A)24.7%
B)116.7%
C)53.8%
D)53.5%
E)46%
Question
The Centers for Disease Control in the U.S.A.lists causes of death for individual states in 2002.The mortality data for one state is given. 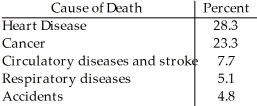
Which of the following displays is/are appropriate for these data? (More than one display may be appropriate. )
I II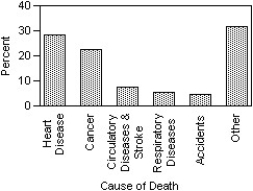

III
A)II,III
B)I,II,III
C)I
D)I,II
E)None of these displays are appropriate.
Which of the following displays is/are appropriate for these data? (More than one display may be appropriate. )
I II
III
A)II,III
B)I,II,III
C)I
D)I,II
E)None of these displays are appropriate.
Question
A college examined the impact of an applicant's ethnicity on the likelihood of admission to a particular program.The data are summarized in the table below. 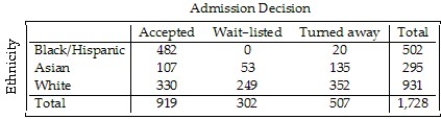
What percent of White students were accepted?
A)26.7%
B)35.4%
C)37.8%
D)35.9%
E)19.1%
What percent of White students were accepted?
A)26.7%
B)35.4%
C)37.8%
D)35.9%
E)19.1%
Question
The Centers for Disease Control in the U.S.A.lists causes of death for individual states in 2002.The mortality data for one state is given. 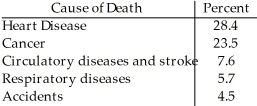
Which of the following displays is/are appropriate for these data? (More than one display may be appropriate. )
I II

III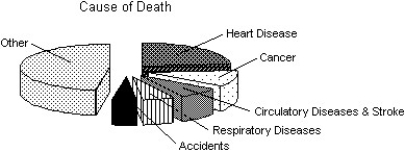
A)I,II
B)I,II,III
C)I
D)II
E)None of these displays are appropriate.
Which of the following displays is/are appropriate for these data? (More than one display may be appropriate. )
I II
III
A)I,II
B)I,II,III
C)I
D)II
E)None of these displays are appropriate.
Question
A college examined the impact of an applicant's ethnicity on the likelihood of admission to a particular program.The data are summarized in the table below. 
What percent of the students accepted were Black or Hispanic?
A)108.6%
B)6.9%
C)92.3%
D)52.1%
E)26.4%
What percent of the students accepted were Black or Hispanic?
A)108.6%
B)6.9%
C)92.3%
D)52.1%
E)26.4%
Question
Just how accurate are the weather forecasts we hear every day? The table below compares the daily forecast with a city's actual weather for a year. 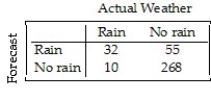
On what percent of days did it actually rain?
A)2.7%
B)11.5%
C)76.2%
D)8.8%
E)23.8%
On what percent of days did it actually rain?
A)2.7%
B)11.5%
C)76.2%
D)8.8%
E)23.8%
Question
Most patients who undergo surgery make routine recoveries and are discharged as planned,but some patients experience complications and their discharge is delayed.A small city has a large hospital and a small hospital,each performing major and minor surgeries.Data is collected at each hospital to see how many surgical patients have their discharges delayed by postsurgical complications.The results are shown in the following table. 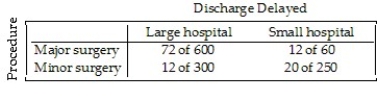
What were the discharge delay rates at each hospital?
A)Large hospital: 12.7%
Small hospital: 8.9%
B)Large hospital: 9.6%
Small hospital: 9.6%
C)Large hospital: 16%
Small hospital: 28%
D)Large hospital: 9.6%
Small hospital: 2.6%
E)Large hospital: 9.3%
Small hospital: 10.3%
What were the discharge delay rates at each hospital?
A)Large hospital: 12.7%
Small hospital: 8.9%
B)Large hospital: 9.6%
Small hospital: 9.6%
C)Large hospital: 16%
Small hospital: 28%
D)Large hospital: 9.6%
Small hospital: 2.6%
E)Large hospital: 9.3%
Small hospital: 10.3%
Question
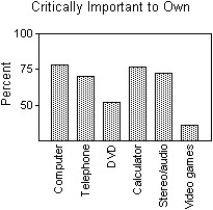
The focus of a recent survey was was on teenagers' familiarity with and use of modern technology.The teenagers were asked if they used each of the following technologies on a daily basis and if the technology was critically important to own.For each question,the percentage of those responding "Yes" is given.Subtracting the "Use daily" percentage from the "Critically important to own" percentage gives the "Importance Gap." Here are the results: 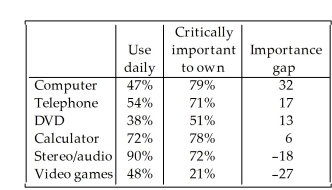
Create a bar chart for the "Importance Gap".
Create a bar chart for the "Importance Gap".
Question
The City of Windsor Department of Parks and Recreation is planning to build a recreation centre in one of the city's parks.They conducted a poll to find out the types of physical activities the local population would be interested in.The poll was based on telephone responses from 1013 randomly selected adults.The table shows the percentages of people who expressed interest in various activities. 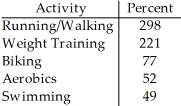
Create a bar chart for these data.
Create a bar chart for these data.
Question
An article in a magazine examined the graduate admissions process at a university for evidence of gender bias.The table below shows the number of applicants accepted to each of four graduate programs. 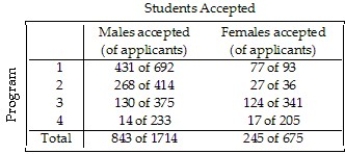
After reading this article,a classmate claims that there is gender bias because the university clearly accepted more males than females.Do you agree with your classmate? Explain.
A)Yes.Overall,49.2% of males were accepted,compared to 36.3% of females were accepted.The overall percentages are always the most valid comparison.
B)No.Overall,49.2% of males were accepted,compared to 36.3% of females were accepted.However,the comparison of the acceptance rate within each program shows that females had a higher acceptance rate for all four programs.
C)Yes.Overall,49.2% of males were accepted,compared to 36.3% of females were accepted.Additionally,the comparison of the acceptance rate within each program shows that males had a higher acceptance rate for all four programs.
D)No.Overall,49.2% of females were accepted,compared to 36.3% of males were accepted.Additionally,the comparison of the acceptance rate within each program shows that females had a higher acceptance rate for all four programs.
E)No.This is an example of Simpson's paradox and unfair averaging.Since the overall percentages and the individual percentages disagree on which gender was favored,the study is useless.Nothing can be determined from these data.
Question
A survey of salesmen was conducted to examine the possibility of a relationship between men's height and annual income.The company interested in the results of the survey believes that taller men are more successful at getting sales,resulting in a higher annual income.The table shows the percentages of income levels for each height category.A graphical display of the conditional distributions of income levels by height is given. 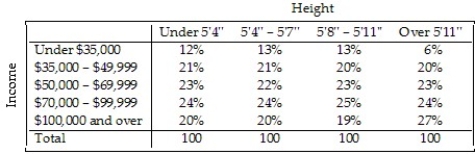
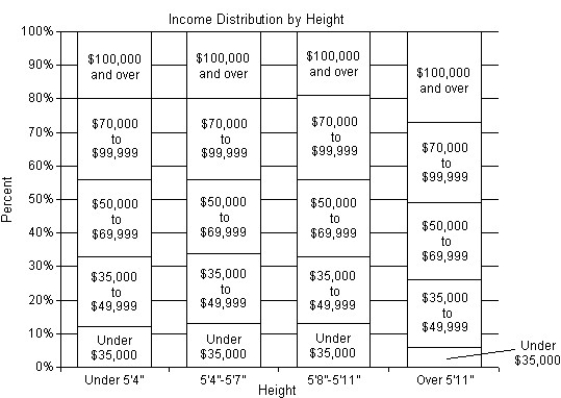
Do these data support the company's belief: taller men are more successful salesmen? Explain.
A)Yes.The percentages in all income levels for salesmen over 5'11'' are higher than the percentages in the same income levels for men 5'11'' or shorter.
B)Yes,to a certain extent.The percent of salesmen over 5'11'' that make $100,000 or more is 27%,compared to the 19% or 20% for men 5'11'' or shorter.Similarly,the percent of salesmen over 5'11'' that make under $35,000 is 6%,compared to the 12% or 13% for men 5'11'' or shorter.However,with these two exceptions,the percentages in the remaining income levels did not vary by more than 1%.
C)No.The percentages in the income levels for the different height categories did not vary by more than 1%,with the exception of salesmen over 5'11' in the under $35,000 category and the $100,000 or over category.These data should be ignored.
D)No.The percentages in all income levels for all height categories of salesmen are too similar to make this claim.
E)Yes.The percent of salesmen over 5'11'' that make $100,000 or more is 27%,compared to the 19% or 20% for men 5'11'' or shorter.Similarly,the percent of salesmen over 5'11'' that make under $35,000 is 6%,compared to the 12% or 13% for men 5'11'' or shorter.
Question
A survey of automobiles parked in student and staff lots at a large university classified the brands by country of origin.The results are listed in the table below,and a graphical display of the conditional distributions of origin by driver is given. 
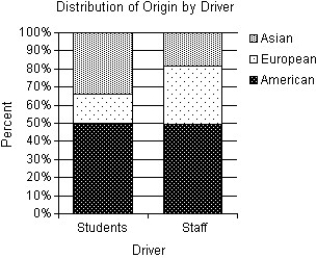
Do you think that origin of the car is independent of the type of driver? Explain.
A)Yes.The conditional distributions of origin by driver have similarities and differences.The two groups own nearly the same percentage of American cars.Therefore,because of this one similarity,driver and origin must be independent.
B)No.The conditional distributions of origin by driver have similarities and differences.Although students appear to own a higher percentage of Asian cars and a smaller percentage of European cars than the staff,the two groups own nearly the same percentage of American cars.However,because of the differences,there is evidence of an association between driver and origin.
C)No.The conditional distributions of origin by driver have similarities and differences.Students own a higher percentage of Asian and European cars than the staff.Therefore,because of this difference,there must be an association between driver and origin.
D)No.The conditional distributions of origin by driver have similarities and differences.Although staff appear to own a higher percentage of Asian cars and a smaller percentage of European cars than the students,the two groups own nearly the same percentage of American cars.However,because of the differences,there is evidence of an association between driver and origin.
E)Yes.The conditional distributions of origin by driver have similarities and differences.Although students appear to own a higher percentage of Asian cars and a smaller percentage of European cars than the staff,the two groups own nearly the same percentage of American cars.However,because there are more students than staff,an association between driver and origin cannot be claimed.
Question
At a university in the U.S.A. ,the incoming freshman were surveyed about their chosen majors.The university organized the data by placing the majors into the appropriate colleges.The table displays the results for males and females by colleges.A graphical display of the conditional distributions of colleges by gender is given. 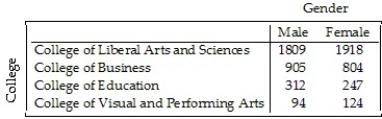
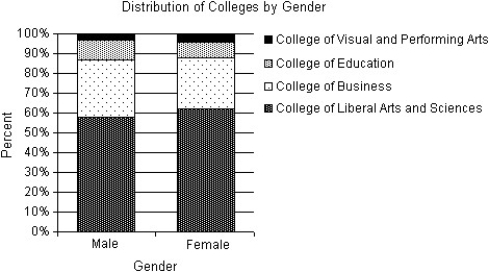
Do you think that the college the freshmen will be entering is independent of the gender of the student? Explain.
A)Yes.The conditional distributions of colleges by gender are similar.Since the distributions of colleges is essentially the same for males and females,there is evidence of an association between gender and colleges.
B)Yes.The conditional distributions of colleges by gender are similar.Since the distributions of colleges is essentially the same for males and females,there is no evidence of an association between gender and colleges.
C)No.The conditional distributions of colleges by gender varies.More male students will be entering the College of Business and the College of Education than female students.This is sufficient evidence of an association between gender and colleges.
D)No.The conditional distributions of colleges by gender are similar.Since the distributions of colleges is essentially the same for males and females,there is no evidence of an association between gender and colleges.
E)No.The conditional distributions of colleges by gender are similar.Since the distributions of colleges is essentially the same for males and females,there is evidence of an association between gender and colleges.
Question
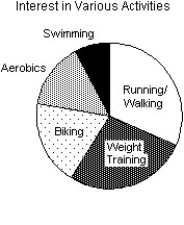
The City of Windsor Department of Parks and Recreation is planning to build a recreation centre in one of the city's parks.They conducted a poll to find out the types of physical activities the local population would be interested in.The poll was based on telephone responses from 1013 randomly selected adults.The table shows the percentages of people who expressed interest in various activities. 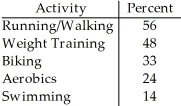
Which of the following displays is/are appropriate for these data? (More than one display may be appropriate. )
I II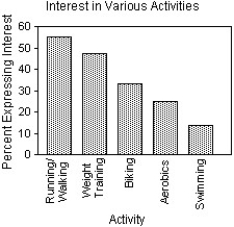

III
A)I
B)I,II
C)I,II,III
D)II
E)None of these displays are appropriate.
Which of the following displays is/are appropriate for these data? (More than one display may be appropriate. )
I II
III
A)I
B)I,II
C)I,II,III
D)II
E)None of these displays are appropriate.
Question
The City of Windsor Department of Parks and Recreation is planning to build a recreation centre in one of the city's parks.They conducted a poll to find out the types of physical activities the local population would be interested in.The poll was based on telephone responses from 1013 randomly selected adults.The table shows the percentages of people who expressed interest in various activities. 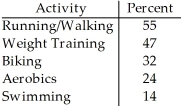
Which of the following displays is/are appropriate for these data? (More than one display may be appropriate. )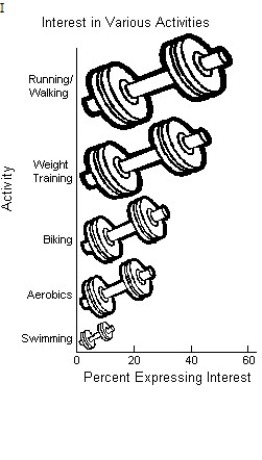
A)I,II,III
B)II,III
C)II
D)III
E)None of these displays are appropriate.
Which of the following displays is/are appropriate for these data? (More than one display may be appropriate. )
A)I,II,III
B)II,III
C)II
D)III
E)None of these displays are appropriate.
Question
Statistics Canada gives the following mortality data for Canada in 2000. 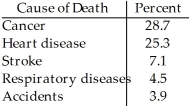
Create a bar chart for these data.
Create a bar chart for these data.
Question
The Centers for Disease Control in the U.S.A.lists causes of death for individual states in 2002.The mortality data for one state is given. 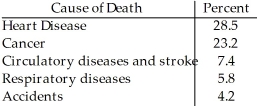
Which of the following displays is/are appropriate for these data? (More than one display may be appropriate. )
I II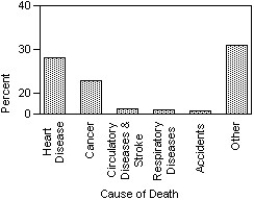
III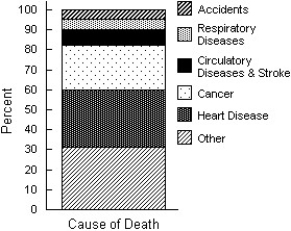
A)I,II
B)I,II,III
C)II,III
D)II
E)None of these displays are appropriate.
Which of the following displays is/are appropriate for these data? (More than one display may be appropriate. )
I II
III
A)I,II
B)I,II,III
C)II,III
D)II
E)None of these displays are appropriate.
Question
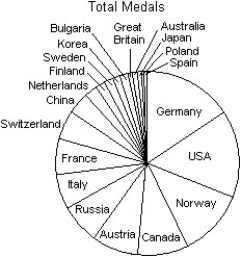
A prediction of the number of medals to be won by various countries in the 2010 Winter Olympics was made using past Olympics data.The predicted values are listed in the table below. 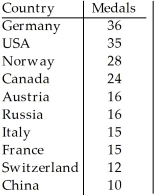
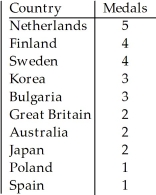
Which of the following displays is the most appropriate for these data?
I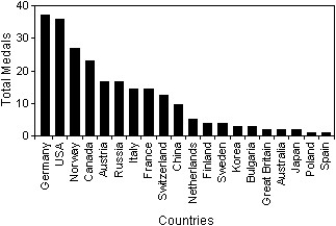
II III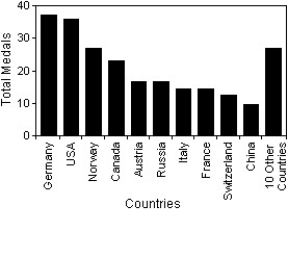
A)I
B)III
C)II
D)All of these displays are equally appropriate.
E)None of these displays are appropriate.
Which of the following displays is the most appropriate for these data?
I
II III
A)I
B)III
C)II
D)All of these displays are equally appropriate.
E)None of these displays are appropriate.
Question
The City of Windsor Department of Parks and Recreation is planning to build a recreation centre in one of the city's parks.They conducted a poll to find out the types of physical activities the local population would be interested in.The poll was based on telephone responses from 1013 randomly selected adults.The table shows the percentages of people who expressed interest in various activities. 
Which of the following displays is/are appropriate for these data? (More than one display may be appropriate. )
I II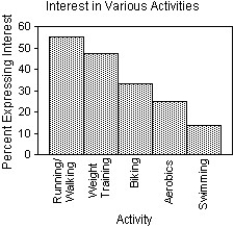
III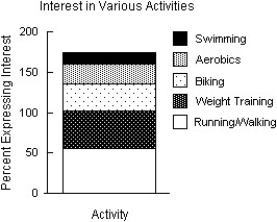
A)II
B)I,II,III
C)I,II
D)I
E)None of these displays are appropriate.
Which of the following displays is/are appropriate for these data? (More than one display may be appropriate. )
I II
III
A)II
B)I,II,III
C)I,II
D)I
E)None of these displays are appropriate.
Question
Students in a Political Science course were asked to describe their politics as "Liberal","Moderate",or "Conservative." Here are the results: 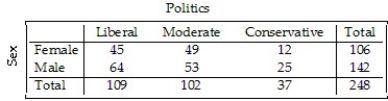
Which graphical display shows the conditional distribution of politics among the males?
I II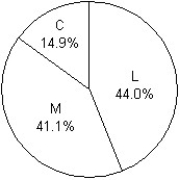
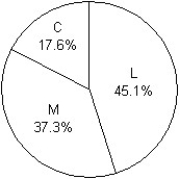
III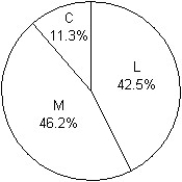
A)I
B)III
C)II
D)II,III
E)None of these displays show the conditional distribution of politics among the males.
Which graphical display shows the conditional distribution of politics among the males?
I II
III
A)I
B)III
C)II
D)II,III
E)None of these displays show the conditional distribution of politics among the males.
Question
Statistics Canada gives the following mortality data for Canada in 2007. 
Create a bar chart for these data.
Create a bar chart for these data.
Question
Most women who have had a mastectomy can have breast reconstruction surgery.The reconstruction surgery can be performed at the same time as the mastectomy,an immediate reconstruction,or after the patient has healed from the mastectomy,second surgery reconstruction.Some women opt not to have reconstruction surgery.The table shows the percentages of women's choices regarding reconstruction for three age categories.A graphical display of the conditional distributions of reconstruction choice by age is given. 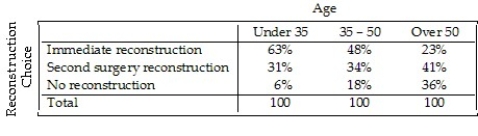
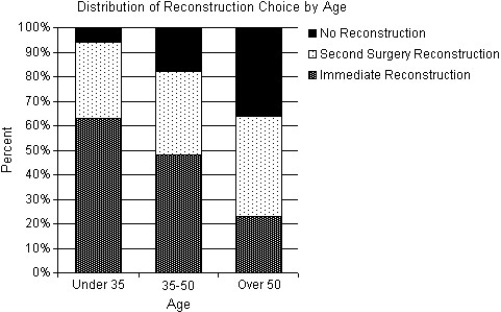
Does there appear to be an association between reconstruction choice and age? Explain.
A)No.The number of women over 50 who were included in these data was probably higher than the number who were under 35.Using this assumption,there is not enough evidence to show an association between reconstruction choice and age.
B)Yes.A higher percentage of older women,especially over 50,who have had mastectomies choose not to have reconstruction surgery.Likewise,a higher percentage of younger patients choose to have immediate reconstruction.It appears that as the age of women having mastectomies increases,the importance of having reconstructive breast surgery decreases.
C)No.The percentages of women who have had mastectomies who choose to have second surgery reconstruction do not vary significantly.There is not enough evidence to show an association between reconstruction choice and age.
D)No.In all age groups,most women want reconstruction surgery.
E)Yes.A higher percentage of older women,especially over 50,who have had mastectomies choose to have second surgery reconstruction.It appears that as the age of women having mastectomies increases,the importance of having reconstructive breast surgery increases.
Question
The table below compares what students at a small Canadian college did after graduating with a bachelor's degree in 1992,1998,and 2003.A graphical display of the conditional distributions of what students did after graduation by year is given. 
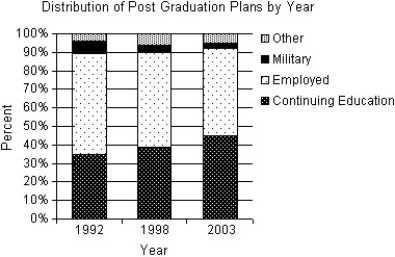
Does this study present any evidence that postgraduation plans have changed over this 11-year period? Explain.
A)Yes.There is evidence that the percentage of graduates entering the work force after graduation has increased from 1992 to 2003.Likewise,the percentage of graduates continuing their education appears to have decreased from 1992 to 2003.
B)Yes.There is evidence that the percentage of graduates continuing their education has increased from 1992 to 2003.Likewise,the percentage of graduates entering the work force after graduation appears to have decreased from 1992 to 2003.
C)No.The percentage of graduates continuing their education has increased from 1992 to 2003.Likewise,the percentage of graduates entering the work force after graduation appears to have decreased from 1992 to 2003.However,this is not sufficient evidence to show any change due to the fact that those entering the military or seeking other options remained relatively constant.
D)No.The percentage of graduates continuing their education has increased from 1992 to 2003.Likewise,the percentage of graduates entering the work force after graduation appears to have decreased from 1992 to 2003.However,this is not sufficient evidence to show any change due to the fact that the number of students graduating has increased over this same time period.
E)Yes.There is evidence that the percentage of graduates continuing their education and entering the work force after graduation has increased from 1992 to 2003.
Question
The focus of a recent survey was was on teenagers' familiarity with and use of modern technology.The teenagers were asked if they used each of the following technologies on a daily basis and if the technology was critically important to own.For each question,the percentage of those responding "Yes" is given.Subtracting the "Use daily" percentage from the "Critically important to own" percentage gives the "Importance Gap".Here are the results: 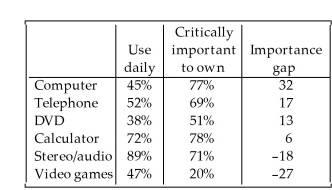
Which of the following displays is the most appropriate for these data?
I II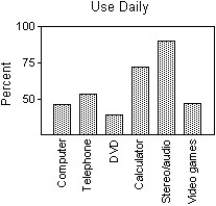
III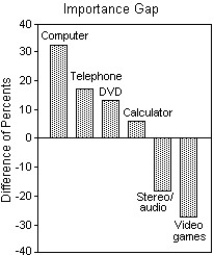
A)III
B)I
C)II
D)All of these displays are equally appropriate.
E)None of these displays are appropriate.
Which of the following displays is the most appropriate for these data?
I II
III
A)III
B)I
C)II
D)All of these displays are equally appropriate.
E)None of these displays are appropriate.
Question
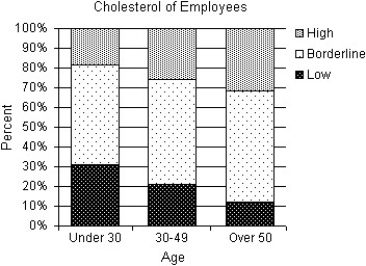
A company held a cholesterol screening clinic for its employees.The results are summarized in the table below by age group and cholesterol level.A graphical display of the conditional distributions of cholesterol levels by age is given. 
Does this prove that aging causes increased cholesterol levels? Explain.
A)No.There is sufficient evidence of an association between age and cholesterol level.However,the percentage of employees with low cholesterol increased with age.Likewise,the percentage of employees with high cholesterol decreased with age.
B)No.Generally,an association between two variables does not imply a cause-and-effect relationship.Specifically,these data come from only one company and cannot be applied to all people.Only a controlled experiment can isolate the relationship between age and cholesterol level.
C)No.Generally,an association between two variables does imply a cause-and-effect relationship.Specifically,these data come from only one company and cannot be applied to all people.However,if more companies provided cholesterol screenings and these data were compiled,then the claim could be proven.
D)Yes.Generally,an association between two variables does imply a cause-and-effect relationship.However,these data come from only one company and cannot necessarily be applied to all people.A controlled experiment that can isolate the relationship between age and cholesterol level would make this a stronger claim.
E)Yes.There is evidence of an association between age and cholesterol level.The percentage of employees with high cholesterol increased with age.Likewise,the percentage of employees with low cholesterol decreased with age.
Question
A company must decide which of two delivery services they will contract with.During a recent trial period they shipped numerous packages with each service,and have kept track of how often deliveries did not arrive on time.Here are the data: 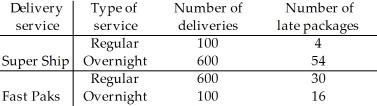
Based on the results,the company decided to hire Fast Paks.Do you agree they deliver on time more often? Explain.
A)Yes.Fast Paks only delivers 4% of its regular packages late,compared to Super Ship,who deliver 5% of its regular packages late.Additionally,Fast Paks only delivers 9% of its overnight packages late,compared to Super Ship,who delivers 16% of its overnight packages late.Fast Paks is better at delivering regular and overnight packages.
B)No.Super Ship only delivers 4% of its regular packages late,compared to Fast Paks,who deliver 5% of its regular packages late.Additionally,Super Ship only delivers 9% of its overnight packages late,compared to Fast Paks,who delivers 16% of its overnight packages late.Super Ship is better at delivering regular and overnight packages.
C)No.Fast Paks only delivers 0.08% of its packages late,compared to Super Ship,who delivers 0.07% of its packages late.Super Ship is better at delivering regular and overnight packages.
D)Yes.Fast Paks only delivers 0.07% of its packages late,compared to Super Ship,who delivers 0.08% of its packages late.Fast Paks is better at delivering regular and overnight packages.
E)No.This is an example of Simpson's paradox and unfair averaging.Since the overall percentages and the individual percentages disagree on which delivery service is better,both services can be considered equal.It cannot be determined whether Super Ship or Fast Paks deliver packages on time more often.
Question
Students in a political science course were asked to describe their politics as "Liberal","Moderate",or "Conservative." The results are listed in the table below,and a graphical display of the conditional distributions of sex among the three categories of politics is given. 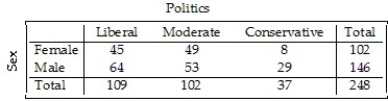
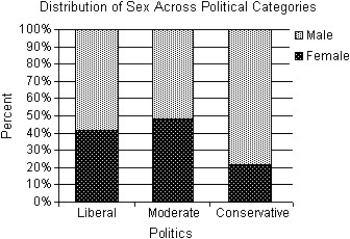
The political science instructor states that sex and politics are independent.Is this an accurate statement? Explain.
A)No.The percentage of males and females varies across political categories.The percentage of Liberals and Moderates who are female is approximately twice that of Conservatives who are female.This would suggest that sex and politics are not independent.
B)No.The percentage of males and females varies across political categories.The percentage of Liberals and Moderates who are male is approximately twice that of Conservatives who are male.This would suggest that sex and politics are not independent.
C)Yes.The percentage of males and females varies across political categories;however,there are more males in the class than females.There is not enough evidence to make an association between sex and politics.Sex and politics are independent.
D)No.The percentage of males and females is similar across political categories.This would suggest that sex and politics are not independent.
E)Yes.The percentage of males and females is similar across political categories.This would suggest that sex and politics are independent.
Question
A survey of automobiles parked in student and staff lots at a large university classified the brands by country of origin.The results are listed in the table below. 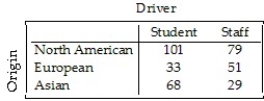
Create a segmented bar graph which shows the conditional distributions of origin for both students and staff.
Create a segmented bar graph which shows the conditional distributions of origin for both students and staff.
Question
Students in a Political Science course were asked to describe their politics as "Liberal","Moderate",or "Conservative." The results are listed in the table below. 
Create a segmented bar graph which shows the conditional distributions by gender for each political category.
Create a segmented bar graph which shows the conditional distributions by gender for each political category.
Question
A company held a cholesterol screening clinic for its employees.The results are summarized in the table below by age group and cholesterol level. 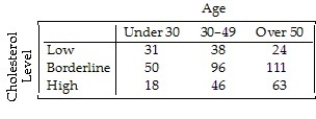
Create a segmented bar graph which shows the conditional distributions of cholesterol levels for each age group.
Create a segmented bar graph which shows the conditional distributions of cholesterol levels for each age group.
Question
Students in a Political Science course were asked to describe their politics as "Liberal","Moderate",or "Conservative." Here are the results: 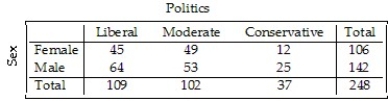
Produce a pie chart that shows the marginal distribution of politics in the class.
Produce a pie chart that shows the marginal distribution of politics in the class.
Question
The table compares what students at a Canadian college did after graduating in 1992,1998,and 2003. 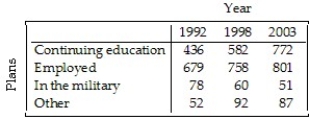
Create a segmented bar graph which shows the conditional distributions of plans for each of the three years.
Create a segmented bar graph which shows the conditional distributions of plans for each of the three years.

Unlock Deck
Sign up to unlock the cards in this deck!
Unlock Deck
Unlock Deck
1/65
Play
Full screen (f)
Deck 2: Displaying and Describing Categorical Data
1
A company held a blood pressure screening clinic for its employees.The results are summarized in the table below by age group and blood pressure level.
Find the marginal distribution of blood pressure level.
A)20% low,40% normal,41% high
B)20% under 30,40% between 30-49,41% over 50
C)21% low,48% normal,31% high
D)32% low,51% normal,18% high
E)27% low,91% normal,45% high
Find the marginal distribution of blood pressure level.
A)20% low,40% normal,41% high
B)20% under 30,40% between 30-49,41% over 50
C)21% low,48% normal,31% high
D)32% low,51% normal,18% high
E)27% low,91% normal,45% high
21% low,48% normal,31% high
2
A poll asked adults which activities they had engaged in during the past month.The results are listed below.
Is it reasonable to conclude that 61.5% of those polled had seen a movie or gone to a sporting event during the past month?
A)Yes,because these categories do not overlap.
B)No,because the percentages in relative frequencies tables can never be added.
C)Yes,because the percentages can always be added in relative frequency tables.
D)No,because these categories overlap.
E)No,because the poll is not based on a large enough number of individuals.
No,because these categories overlap.
3
The City of Windsor Department of Parks and Recreation is planning to build a recreation centre in one of the city's parks.They conducted a poll to find out the types of physical activities the local population would be interested in.The poll was based on telephone responses from 1013 randomly selected adults.The table shows the percentages of people who expressed interest in various activities.
What percent of adults polled did not express interest in any of these activities?
A)21%
B)179%
C)79%
D)90%
E)The percent cannot be determined from the given percentages because the categories overlap.
What percent of adults polled did not express interest in any of these activities?
A)21%
B)179%
C)79%
D)90%
E)The percent cannot be determined from the given percentages because the categories overlap.
The percent cannot be determined from the given percentages because the categories overlap.
4
A newspaper surveyed its subscribers as to which section of the paper they read first.The results are listed below.
What percent of subscribers read a section of the paper not listed above first?
A)6.8%
B)4.7%
C)7.2%
D)8.3%
E)The percent cannot be determined from the given percentages because the categories overlap.
What percent of subscribers read a section of the paper not listed above first?
A)6.8%
B)4.7%
C)7.2%
D)8.3%
E)The percent cannot be determined from the given percentages because the categories overlap.
Unlock Deck
Unlock for access to all 65 flashcards in this deck.
Unlock Deck
k this deck
5
Students in a political science course were asked to describe their politics as "Liberal","Moderate",or "Conservative." Here are the results:
What percent of the class considers themselves to be "Liberal"?
A)36.1%
B)57.7%
C)21.1%
D)36.6%
E)15.5%
What percent of the class considers themselves to be "Liberal"?
A)36.1%
B)57.7%
C)21.1%
D)36.6%
E)15.5%
Unlock Deck
Unlock for access to all 65 flashcards in this deck.
Unlock Deck
k this deck
6
A survey of automobiles parked in student and staff lots at a large university classified the brands by country of origin,as seen in the table.
What is the conditional distribution of origin for students?
A)53% North American,16% European,32% Asian
B)25% North American,7% European,16% Asian
C)53% North American,14% European,33% Asian
D)53% North American,17% European,31% Asian
E)28% North American,9% European,16% Asian
What is the conditional distribution of origin for students?
A)53% North American,16% European,32% Asian
B)25% North American,7% European,16% Asian
C)53% North American,14% European,33% Asian
D)53% North American,17% European,31% Asian
E)28% North American,9% European,16% Asian
Unlock Deck
Unlock for access to all 65 flashcards in this deck.
Unlock Deck
k this deck
7
The City of Windsor Department of Parks and Recreation is planning to build a recreation centre in one of the city's parks.They conducted a poll to find out the types of physical activities the local population would be interested in.The poll was based on telephone responses from 1013 randomly selected adults.The table shows the percentages of people who expressed interest in various activities.
Is it reasonable to conclude that 59% expressed interest in either biking or aerobics?
A)Yes,because these categories do not overlap.
B)No,because the poll is not based on a large-enough number of individuals.
C)No,because these categories overlap.
D)No,because the percentages in relative frequencies tables can never be added.
E)Yes,because the percentages can always be added in relative frequency tables.
Unlock Deck
Unlock for access to all 65 flashcards in this deck.
Unlock Deck
k this deck
8
A company held a blood pressure screening clinic for its employees.The results are summarized in the table below by age group and blood pressure level.
Find the conditional distribution of blood pressure level for employees between 30 and 49.
A)27% low,51% normal,22% high
B)8% low,20% normal,11% high
C)20% low,50% normal,30% high
D)21% low,51% normal,28% high
E)16% low,49% normal,35% high
Find the conditional distribution of blood pressure level for employees between 30 and 49.
A)27% low,51% normal,22% high
B)8% low,20% normal,11% high
C)20% low,50% normal,30% high
D)21% low,51% normal,28% high
E)16% low,49% normal,35% high
Unlock Deck
Unlock for access to all 65 flashcards in this deck.
Unlock Deck
k this deck
9
Students in a political science course were asked to describe their politics as "Liberal","Moderate",or "Conservative." Here are the results:
What percent of all males in the class are "Liberals"?
A)21.1%
B)33.1%
C)40.2%
D)52.9%
E)52.6%
What percent of all males in the class are "Liberals"?
A)21.1%
B)33.1%
C)40.2%
D)52.9%
E)52.6%
Unlock Deck
Unlock for access to all 65 flashcards in this deck.
Unlock Deck
k this deck
10
Statistics Canada gives the following mortality data for Canada in 2007.
Is it reasonable to conclude that cancer or accidents were the cause of approximately 33.8% of deaths in 2002?
A)No,because the percentages do not add up to 100%.
B)Yes,because these categories do not overlap.
C)Yes,because the percentages can always be added in relative frequency tables.
D)No,because the percentages in relative frequencies tables can never be added.
E)No,because these categories overlap.
Unlock Deck
Unlock for access to all 65 flashcards in this deck.
Unlock Deck
k this deck
11
Of the 1,470 applicants to a college program,760 were accepted,269 were wait-listed,and 441 were turned away for lack of space.Find the relative frequency distribution of the decisions made,and write a sentence describing it.
A)1,470 students applied for admission to the college program.52% were accepted,18% were wait-listed,and 30% were turned away.
B)1,470 students applied for admission to the college program.52% were accepted,and 48% were turned away.
C)1,470 students applied for admission to the college program.52% were accepted,35% were wait-listed,and 30% were turned away.
D)1,470 students applied for admission to the college program.52% were accepted,35% were wait-listed,and 58% were turned away.
E)1,470 students applied for admission to the college program.70% were accepted,and 30% were turned away.
Unlock Deck
Unlock for access to all 65 flashcards in this deck.
Unlock Deck
k this deck
12
Students in a political science course were asked to describe their politics as "Liberal","Moderate",or "Conservative." Here are the results:
What percent of the females in the class consider themselves to be "Liberal"?
A)38.3%
B)45.3%
C)34.7%
D)37.1%
E)36.8%
What percent of the females in the class consider themselves to be "Liberal"?
A)38.3%
B)45.3%
C)34.7%
D)37.1%
E)36.8%
Unlock Deck
Unlock for access to all 65 flashcards in this deck.
Unlock Deck
k this deck
13
A survey of automobiles parked in student and staff lots at a large university classified the brands by country of origin,as seen in the table.
What is the marginal distribution of origin?
A)52% North American,13% European,35% Asian
B)56% North American,10% European,34% Asian
C)54% Students,46% Staff
D)107% North American,16% European,54% Asian
E)48% North American,16% European,36% Asian
What is the marginal distribution of origin?
A)52% North American,13% European,35% Asian
B)56% North American,10% European,34% Asian
C)54% Students,46% Staff
D)107% North American,16% European,54% Asian
E)48% North American,16% European,36% Asian
Unlock Deck
Unlock for access to all 65 flashcards in this deck.
Unlock Deck
k this deck
14
A real estate company kept a database on the apartments in a certain city.The percentages of various types of apartments are listed below.
What percentage of the apartments in the city are 1-bedroom or 2-bedroom apartments?
A)69.9%
B)69.4%
C)71.3%
D)73.3%
E)The percent cannot be determined from the given percentages because the categories overlap.
What percentage of the apartments in the city are 1-bedroom or 2-bedroom apartments?
A)69.9%
B)69.4%
C)71.3%
D)73.3%
E)The percent cannot be determined from the given percentages because the categories overlap.
Unlock Deck
Unlock for access to all 65 flashcards in this deck.
Unlock Deck
k this deck
15
Statistics Canada gives the following mortality data for Canada in 2007.
What percent of deaths were from causes not listed here?
A)58.5%
B)34.3%
C)36%
D)65.7%
E)The percent cannot be determined from the given percentages because the categories overlap.
What percent of deaths were from causes not listed here?
A)58.5%
B)34.3%
C)36%
D)65.7%
E)The percent cannot be determined from the given percentages because the categories overlap.
Unlock Deck
Unlock for access to all 65 flashcards in this deck.
Unlock Deck
k this deck
16
A company held a blood pressure screening clinic for its employees.The results are summarized in the table below by age group and blood pressure level.
Find the conditional distribution of blood pressure level for employees over 50.
A)8% low,19% normal,15% high
B)21% low,50% normal,28% high
C)28% low,48% normal,24% high
D)19% low,45% normal,37% high
E)22% low,47% normal,31% high
Find the conditional distribution of blood pressure level for employees over 50.
A)8% low,19% normal,15% high
B)21% low,50% normal,28% high
C)28% low,48% normal,24% high
D)19% low,45% normal,37% high
E)22% low,47% normal,31% high
Unlock Deck
Unlock for access to all 65 flashcards in this deck.
Unlock Deck
k this deck
17
A newspaper surveyed its subscribers as to which section of the paper they read first.The results are listed below.
Is it reasonable to conclude that 39.1% of the paper's subscribers read the business or sports sections first?
A)Yes,because the percentages can always be added in relative frequency tables.
B)No,because the percentages in relative frequencies tables can never be added.
C)No,because the percentages do not add up to 100%.
D)No,because these categories overlap.
E)Yes,because these categories do not overlap.
Unlock Deck
Unlock for access to all 65 flashcards in this deck.
Unlock Deck
k this deck
18
A company held a blood pressure screening clinic for its employees.The results are summarized in the table below by age group and blood pressure level.
Find the conditional distribution of blood pressure level for employees under 30.
A)18% low,47% normal,35% high
B)23% low,51% normal,27% high
C)22% low,49% normal,29% high
D)27% low,49% normal,24% high
E)6% low,10% normal,5% high
Find the conditional distribution of blood pressure level for employees under 30.
A)18% low,47% normal,35% high
B)23% low,51% normal,27% high
C)22% low,49% normal,29% high
D)27% low,49% normal,24% high
E)6% low,10% normal,5% high
Unlock Deck
Unlock for access to all 65 flashcards in this deck.
Unlock Deck
k this deck
19
A survey of automobiles parked in student and staff lots at a large university classified the brands by country of origin,as seen in the table.
What is the conditional distribution of origin for staff?
A)25% North American,6% European,12% Asian
B)49% North American,19% European,32% Asian
C)28% North American,11% European,18% Asian
D)53% North American,16% European,31% Asian
E)58% North American,13% European,28% Asian
What is the conditional distribution of origin for staff?
A)25% North American,6% European,12% Asian
B)49% North American,19% European,32% Asian
C)28% North American,11% European,18% Asian
D)53% North American,16% European,31% Asian
E)58% North American,13% European,28% Asian
Unlock Deck
Unlock for access to all 65 flashcards in this deck.
Unlock Deck
k this deck
20
Of the 1,606 applicants to a college program,456 were Black or Hispanic,300 were Asian,and 850 were White.Summarize the relative frequency distribution of ethnicity with a sentence or two in the proper context.
A)Of the 1,606 students who applied for admission to the college program,3% were Black or Hispanic,2% were Asian,and 5% were White.
B)Of the 1,606 students who applied for admission to the college program,54% were Black or Hispanic,35% were Asian,and 53% were White.
C)Of the 1,606 students who applied for admission to the college program,14% were Black,14% were Hispanic,19% were Asian,and 53% were White.
D)Of the 1,606 students accepted in the college program,28% were Black or Hispanic,19% were Asian,and 53% were White.
E)Of the 1,606 students who applied for admission to the college program,28% were Black or Hispanic,19% were Asian,and 53% were White.
Unlock Deck
Unlock for access to all 65 flashcards in this deck.
Unlock Deck
k this deck
21
A college examined the impact of an applicant's ethnicity on the likelihood of admission to a particular program.The data are summarized in the table below.
What percent of all applicants were Black or Hispanic?
A)28%
B)26.5%
C)53.9%
D)48%
E)17.1%
What percent of all applicants were Black or Hispanic?
A)28%
B)26.5%
C)53.9%
D)48%
E)17.1%
Unlock Deck
Unlock for access to all 65 flashcards in this deck.
Unlock Deck
k this deck
22
A survey of automobiles parked in student and staff lots at a large university classified the brands by country of origin,as seen in the table.
What percent of the North American cars were owned by staff?
A)48.9%
B)51.1%
C)56.2%
D)25.7%
E)128.4%
What percent of the North American cars were owned by staff?
A)48.9%
B)51.1%
C)56.2%
D)25.7%
E)128.4%
Unlock Deck
Unlock for access to all 65 flashcards in this deck.
Unlock Deck
k this deck
23
A survey of automobiles parked in student and staff lots at a large university classified the brands by country of origin,as seen in the table.
What percent of all the cars surveyed were foreign?
A)44.2%
B)18.9%
C)13.1%
D)25.3%
E)31.1%
What percent of all the cars surveyed were foreign?
A)44.2%
B)18.9%
C)13.1%
D)25.3%
E)31.1%
Unlock Deck
Unlock for access to all 65 flashcards in this deck.
Unlock Deck
k this deck
24
Just how accurate are the weather forecasts we hear every day? The table below compares the daily forecast with a city's actual weather for a year.
What percent of the time was the forecast correct?
A)74.2%
B)7.7%
C)81.9%
D)77.3%
E)18.1%
What percent of the time was the forecast correct?
A)74.2%
B)7.7%
C)81.9%
D)77.3%
E)18.1%
Unlock Deck
Unlock for access to all 65 flashcards in this deck.
Unlock Deck
k this deck
25
A college examined the impact of an applicant's ethnicity on the likelihood of admission to a particular program.The data are summarized in the table below.
What percent of all students were turned away?
A)51.8%
B)17.7%
C)30.2%
D)30.6%
E)44.1%
What percent of all students were turned away?
A)51.8%
B)17.7%
C)30.2%
D)30.6%
E)44.1%
Unlock Deck
Unlock for access to all 65 flashcards in this deck.
Unlock Deck
k this deck
26
Just how accurate are the weather forecasts we hear every day? The table below compares the daily forecast with a city's actual weather for a year.
On what percent of days was rain predicted?
A)14.8%
B)24.1%
C)38.6%
D)9.3%
E)11.5%
On what percent of days was rain predicted?
A)14.8%
B)24.1%
C)38.6%
D)9.3%
E)11.5%
Unlock Deck
Unlock for access to all 65 flashcards in this deck.
Unlock Deck
k this deck
27
Most patients who undergo surgery make routine recoveries and are discharged as planned,but some patients experience complications and their discharge is delayed.A small city has a large hospital and a small hospital,each performing major and minor surgeries.Data is collected at each hospital to see how many surgical patients have their discharges delayed by postsurgical complications.The results are shown in the following table.
Overall,for what percent of surgical patients was discharge delayed?
A)1.8%
B)9.4%
C)42%
D)9.1%
E)7.6%
Overall,for what percent of surgical patients was discharge delayed?
A)1.8%
B)9.4%
C)42%
D)9.1%
E)7.6%
Unlock Deck
Unlock for access to all 65 flashcards in this deck.
Unlock Deck
k this deck
28
Most patients who undergo surgery make routine recoveries and are discharged as planned,but some patients experience complications and their discharge is delayed.A small city has a large hospital and a small hospital,each performing major and minor surgeries.Data is collected at each hospital to see how many surgical patients have their discharges delayed by postsurgical complications.The results are shown in the following table.
What were the discharge delay rates for each kind of surgery?
A)Major surgery: 13%
Minor surgery: 5.1%
B)Major surgery: 10.3%
Minor surgery: 10.3%
C)Major surgery: 9.7%
Minor surgery: 13.9%
D)Major surgery: 8.6%
Minor surgery: 1.7%
E)Major surgery: 37%
Minor surgery: 12%
What were the discharge delay rates for each kind of surgery?
A)Major surgery: 13%
Minor surgery: 5.1%
B)Major surgery: 10.3%
Minor surgery: 10.3%
C)Major surgery: 9.7%
Minor surgery: 13.9%
D)Major surgery: 8.6%
Minor surgery: 1.7%
E)Major surgery: 37%
Minor surgery: 12%
Unlock Deck
Unlock for access to all 65 flashcards in this deck.
Unlock Deck
k this deck
29
The Centers for Disease Control in the U.S.A.lists causes of death for individual states in 2002.The mortality data for one state is given.
Which of the following displays is/are appropriate for these data? (More than one display may be appropriate. )
I II
III
A)I,II
B)I
C)I,III
D)I,II,III
E)None of these displays are appropriate.
Which of the following displays is/are appropriate for these data? (More than one display may be appropriate. )
I II
III
A)I,II
B)I
C)I,III
D)I,II,III
E)None of these displays are appropriate.
Unlock Deck
Unlock for access to all 65 flashcards in this deck.
Unlock Deck
k this deck
30
A survey of automobiles parked in student and staff lots at a large university classified the brands by country of origin,as seen in the table.
What percent of the foreign cars were owned by students?
A)42.9%
B)57.1%
C)37.1%
D)20%
E)26.7%
What percent of the foreign cars were owned by students?
A)42.9%
B)57.1%
C)37.1%
D)20%
E)26.7%
Unlock Deck
Unlock for access to all 65 flashcards in this deck.
Unlock Deck
k this deck
31
Students in a political science course were asked to describe their politics as "Liberal","Moderate",or "Conservative." Here are the results:
What percent of all students in the class are males who consider themselves to be "Liberal"?
A)51.2%
B)43%
C)24%
D)46.9%
E)22.9%
What percent of all students in the class are males who consider themselves to be "Liberal"?
A)51.2%
B)43%
C)24%
D)46.9%
E)22.9%
Unlock Deck
Unlock for access to all 65 flashcards in this deck.
Unlock Deck
k this deck
32
A college examined the impact of an applicant's ethnicity on the likelihood of admission to a particular program.The data are summarized in the table below.
What percent of Asians were wait-listed?
A)17.5%
B)3.3%
C)18.5%
D)36.1%
E)45.4%
What percent of Asians were wait-listed?
A)17.5%
B)3.3%
C)18.5%
D)36.1%
E)45.4%
Unlock Deck
Unlock for access to all 65 flashcards in this deck.
Unlock Deck
k this deck
33
Students in a political science course were asked to describe their politics as "Liberal","Moderate",or "Conservative." Here are the results:
What percent of all "Moderates" in the class are male?
A)44.9%
B)55.1%
C)21.7%
D)36.5%
E)39.4%
What percent of all "Moderates" in the class are male?
A)44.9%
B)55.1%
C)21.7%
D)36.5%
E)39.4%
Unlock Deck
Unlock for access to all 65 flashcards in this deck.
Unlock Deck
k this deck
34
A survey of automobiles parked in student and staff lots at a large university classified the brands by country of origin,as seen in the table.
What percent of the staff owned North American cars?
A)24.7%
B)116.7%
C)53.8%
D)53.5%
E)46%
What percent of the staff owned North American cars?
A)24.7%
B)116.7%
C)53.8%
D)53.5%
E)46%
Unlock Deck
Unlock for access to all 65 flashcards in this deck.
Unlock Deck
k this deck
35
The Centers for Disease Control in the U.S.A.lists causes of death for individual states in 2002.The mortality data for one state is given.
Which of the following displays is/are appropriate for these data? (More than one display may be appropriate. )
I II
III
A)II,III
B)I,II,III
C)I
D)I,II
E)None of these displays are appropriate.
Which of the following displays is/are appropriate for these data? (More than one display may be appropriate. )
I II
III
A)II,III
B)I,II,III
C)I
D)I,II
E)None of these displays are appropriate.
Unlock Deck
Unlock for access to all 65 flashcards in this deck.
Unlock Deck
k this deck
36
A college examined the impact of an applicant's ethnicity on the likelihood of admission to a particular program.The data are summarized in the table below.
What percent of White students were accepted?
A)26.7%
B)35.4%
C)37.8%
D)35.9%
E)19.1%
What percent of White students were accepted?
A)26.7%
B)35.4%
C)37.8%
D)35.9%
E)19.1%
Unlock Deck
Unlock for access to all 65 flashcards in this deck.
Unlock Deck
k this deck
37
The Centers for Disease Control in the U.S.A.lists causes of death for individual states in 2002.The mortality data for one state is given.
Which of the following displays is/are appropriate for these data? (More than one display may be appropriate. )
I II
III
A)I,II
B)I,II,III
C)I
D)II
E)None of these displays are appropriate.
Which of the following displays is/are appropriate for these data? (More than one display may be appropriate. )
I II
III
A)I,II
B)I,II,III
C)I
D)II
E)None of these displays are appropriate.
Unlock Deck
Unlock for access to all 65 flashcards in this deck.
Unlock Deck
k this deck
38
A college examined the impact of an applicant's ethnicity on the likelihood of admission to a particular program.The data are summarized in the table below.
What percent of the students accepted were Black or Hispanic?
A)108.6%
B)6.9%
C)92.3%
D)52.1%
E)26.4%
What percent of the students accepted were Black or Hispanic?
A)108.6%
B)6.9%
C)92.3%
D)52.1%
E)26.4%
Unlock Deck
Unlock for access to all 65 flashcards in this deck.
Unlock Deck
k this deck
39
Just how accurate are the weather forecasts we hear every day? The table below compares the daily forecast with a city's actual weather for a year.
On what percent of days did it actually rain?
A)2.7%
B)11.5%
C)76.2%
D)8.8%
E)23.8%
On what percent of days did it actually rain?
A)2.7%
B)11.5%
C)76.2%
D)8.8%
E)23.8%
Unlock Deck
Unlock for access to all 65 flashcards in this deck.
Unlock Deck
k this deck
40
Most patients who undergo surgery make routine recoveries and are discharged as planned,but some patients experience complications and their discharge is delayed.A small city has a large hospital and a small hospital,each performing major and minor surgeries.Data is collected at each hospital to see how many surgical patients have their discharges delayed by postsurgical complications.The results are shown in the following table.
What were the discharge delay rates at each hospital?
A)Large hospital: 12.7%
Small hospital: 8.9%
B)Large hospital: 9.6%
Small hospital: 9.6%
C)Large hospital: 16%
Small hospital: 28%
D)Large hospital: 9.6%
Small hospital: 2.6%
E)Large hospital: 9.3%
Small hospital: 10.3%
What were the discharge delay rates at each hospital?
A)Large hospital: 12.7%
Small hospital: 8.9%
B)Large hospital: 9.6%
Small hospital: 9.6%
C)Large hospital: 16%
Small hospital: 28%
D)Large hospital: 9.6%
Small hospital: 2.6%
E)Large hospital: 9.3%
Small hospital: 10.3%
Unlock Deck
Unlock for access to all 65 flashcards in this deck.
Unlock Deck
k this deck
41
The focus of a recent survey was was on teenagers' familiarity with and use of modern technology.The teenagers were asked if they used each of the following technologies on a daily basis and if the technology was critically important to own.For each question,the percentage of those responding "Yes" is given.Subtracting the "Use daily" percentage from the "Critically important to own" percentage gives the "Importance Gap." Here are the results:
Create a bar chart for the "Importance Gap".
Create a bar chart for the "Importance Gap".
Unlock Deck
Unlock for access to all 65 flashcards in this deck.
Unlock Deck
k this deck
42
The City of Windsor Department of Parks and Recreation is planning to build a recreation centre in one of the city's parks.They conducted a poll to find out the types of physical activities the local population would be interested in.The poll was based on telephone responses from 1013 randomly selected adults.The table shows the percentages of people who expressed interest in various activities.
Create a bar chart for these data.
Create a bar chart for these data.
Unlock Deck
Unlock for access to all 65 flashcards in this deck.
Unlock Deck
k this deck
43
An article in a magazine examined the graduate admissions process at a university for evidence of gender bias.The table below shows the number of applicants accepted to each of four graduate programs.
After reading this article,a classmate claims that there is gender bias because the university clearly accepted more males than females.Do you agree with your classmate? Explain.
A)Yes.Overall,49.2% of males were accepted,compared to 36.3% of females were accepted.The overall percentages are always the most valid comparison.
B)No.Overall,49.2% of males were accepted,compared to 36.3% of females were accepted.However,the comparison of the acceptance rate within each program shows that females had a higher acceptance rate for all four programs.
C)Yes.Overall,49.2% of males were accepted,compared to 36.3% of females were accepted.Additionally,the comparison of the acceptance rate within each program shows that males had a higher acceptance rate for all four programs.
D)No.Overall,49.2% of females were accepted,compared to 36.3% of males were accepted.Additionally,the comparison of the acceptance rate within each program shows that females had a higher acceptance rate for all four programs.
E)No.This is an example of Simpson's paradox and unfair averaging.Since the overall percentages and the individual percentages disagree on which gender was favored,the study is useless.Nothing can be determined from these data.
Unlock Deck
Unlock for access to all 65 flashcards in this deck.
Unlock Deck
k this deck
44
A survey of salesmen was conducted to examine the possibility of a relationship between men's height and annual income.The company interested in the results of the survey believes that taller men are more successful at getting sales,resulting in a higher annual income.The table shows the percentages of income levels for each height category.A graphical display of the conditional distributions of income levels by height is given.
Do these data support the company's belief: taller men are more successful salesmen? Explain.
A)Yes.The percentages in all income levels for salesmen over 5'11'' are higher than the percentages in the same income levels for men 5'11'' or shorter.
B)Yes,to a certain extent.The percent of salesmen over 5'11'' that make $100,000 or more is 27%,compared to the 19% or 20% for men 5'11'' or shorter.Similarly,the percent of salesmen over 5'11'' that make under $35,000 is 6%,compared to the 12% or 13% for men 5'11'' or shorter.However,with these two exceptions,the percentages in the remaining income levels did not vary by more than 1%.
C)No.The percentages in the income levels for the different height categories did not vary by more than 1%,with the exception of salesmen over 5'11' in the under $35,000 category and the $100,000 or over category.These data should be ignored.
D)No.The percentages in all income levels for all height categories of salesmen are too similar to make this claim.
E)Yes.The percent of salesmen over 5'11'' that make $100,000 or more is 27%,compared to the 19% or 20% for men 5'11'' or shorter.Similarly,the percent of salesmen over 5'11'' that make under $35,000 is 6%,compared to the 12% or 13% for men 5'11'' or shorter.
Unlock Deck
Unlock for access to all 65 flashcards in this deck.
Unlock Deck
k this deck
45
A survey of automobiles parked in student and staff lots at a large university classified the brands by country of origin.The results are listed in the table below,and a graphical display of the conditional distributions of origin by driver is given.
Do you think that origin of the car is independent of the type of driver? Explain.
A)Yes.The conditional distributions of origin by driver have similarities and differences.The two groups own nearly the same percentage of American cars.Therefore,because of this one similarity,driver and origin must be independent.
B)No.The conditional distributions of origin by driver have similarities and differences.Although students appear to own a higher percentage of Asian cars and a smaller percentage of European cars than the staff,the two groups own nearly the same percentage of American cars.However,because of the differences,there is evidence of an association between driver and origin.
C)No.The conditional distributions of origin by driver have similarities and differences.Students own a higher percentage of Asian and European cars than the staff.Therefore,because of this difference,there must be an association between driver and origin.
D)No.The conditional distributions of origin by driver have similarities and differences.Although staff appear to own a higher percentage of Asian cars and a smaller percentage of European cars than the students,the two groups own nearly the same percentage of American cars.However,because of the differences,there is evidence of an association between driver and origin.
E)Yes.The conditional distributions of origin by driver have similarities and differences.Although students appear to own a higher percentage of Asian cars and a smaller percentage of European cars than the staff,the two groups own nearly the same percentage of American cars.However,because there are more students than staff,an association between driver and origin cannot be claimed.
Unlock Deck
Unlock for access to all 65 flashcards in this deck.
Unlock Deck
k this deck
46
At a university in the U.S.A. ,the incoming freshman were surveyed about their chosen majors.The university organized the data by placing the majors into the appropriate colleges.The table displays the results for males and females by colleges.A graphical display of the conditional distributions of colleges by gender is given.
Do you think that the college the freshmen will be entering is independent of the gender of the student? Explain.
A)Yes.The conditional distributions of colleges by gender are similar.Since the distributions of colleges is essentially the same for males and females,there is evidence of an association between gender and colleges.
B)Yes.The conditional distributions of colleges by gender are similar.Since the distributions of colleges is essentially the same for males and females,there is no evidence of an association between gender and colleges.
C)No.The conditional distributions of colleges by gender varies.More male students will be entering the College of Business and the College of Education than female students.This is sufficient evidence of an association between gender and colleges.
D)No.The conditional distributions of colleges by gender are similar.Since the distributions of colleges is essentially the same for males and females,there is no evidence of an association between gender and colleges.
E)No.The conditional distributions of colleges by gender are similar.Since the distributions of colleges is essentially the same for males and females,there is evidence of an association between gender and colleges.
Unlock Deck
Unlock for access to all 65 flashcards in this deck.
Unlock Deck
k this deck
47
The City of Windsor Department of Parks and Recreation is planning to build a recreation centre in one of the city's parks.They conducted a poll to find out the types of physical activities the local population would be interested in.The poll was based on telephone responses from 1013 randomly selected adults.The table shows the percentages of people who expressed interest in various activities.
Which of the following displays is/are appropriate for these data? (More than one display may be appropriate. )
I II
III
A)I
B)I,II
C)I,II,III
D)II
E)None of these displays are appropriate.
Which of the following displays is/are appropriate for these data? (More than one display may be appropriate. )
I II
III
A)I
B)I,II
C)I,II,III
D)II
E)None of these displays are appropriate.
Unlock Deck
Unlock for access to all 65 flashcards in this deck.
Unlock Deck
k this deck
48
The City of Windsor Department of Parks and Recreation is planning to build a recreation centre in one of the city's parks.They conducted a poll to find out the types of physical activities the local population would be interested in.The poll was based on telephone responses from 1013 randomly selected adults.The table shows the percentages of people who expressed interest in various activities.
Which of the following displays is/are appropriate for these data? (More than one display may be appropriate. )
A)I,II,III
B)II,III
C)II
D)III
E)None of these displays are appropriate.
Which of the following displays is/are appropriate for these data? (More than one display may be appropriate. )
A)I,II,III
B)II,III
C)II
D)III
E)None of these displays are appropriate.
Unlock Deck
Unlock for access to all 65 flashcards in this deck.
Unlock Deck
k this deck
49
Statistics Canada gives the following mortality data for Canada in 2000.
Create a bar chart for these data.
Create a bar chart for these data.
Unlock Deck
Unlock for access to all 65 flashcards in this deck.
Unlock Deck
k this deck
50
The Centers for Disease Control in the U.S.A.lists causes of death for individual states in 2002.The mortality data for one state is given.
Which of the following displays is/are appropriate for these data? (More than one display may be appropriate. )
I II
III
A)I,II
B)I,II,III
C)II,III
D)II
E)None of these displays are appropriate.
Which of the following displays is/are appropriate for these data? (More than one display may be appropriate. )
I II
III
A)I,II
B)I,II,III
C)II,III
D)II
E)None of these displays are appropriate.
Unlock Deck
Unlock for access to all 65 flashcards in this deck.
Unlock Deck
k this deck
51
A prediction of the number of medals to be won by various countries in the 2010 Winter Olympics was made using past Olympics data.The predicted values are listed in the table below.
Which of the following displays is the most appropriate for these data?
I
II III
A)I
B)III
C)II
D)All of these displays are equally appropriate.
E)None of these displays are appropriate.
Which of the following displays is the most appropriate for these data?
I
II III
A)I
B)III
C)II
D)All of these displays are equally appropriate.
E)None of these displays are appropriate.
Unlock Deck
Unlock for access to all 65 flashcards in this deck.
Unlock Deck
k this deck
52
The City of Windsor Department of Parks and Recreation is planning to build a recreation centre in one of the city's parks.They conducted a poll to find out the types of physical activities the local population would be interested in.The poll was based on telephone responses from 1013 randomly selected adults.The table shows the percentages of people who expressed interest in various activities.
Which of the following displays is/are appropriate for these data? (More than one display may be appropriate. )
I II
III
A)II
B)I,II,III
C)I,II
D)I
E)None of these displays are appropriate.
Which of the following displays is/are appropriate for these data? (More than one display may be appropriate. )
I II
III
A)II
B)I,II,III
C)I,II
D)I
E)None of these displays are appropriate.
Unlock Deck
Unlock for access to all 65 flashcards in this deck.
Unlock Deck
k this deck
53
Students in a Political Science course were asked to describe their politics as "Liberal","Moderate",or "Conservative." Here are the results:
Which graphical display shows the conditional distribution of politics among the males?
I II
III
A)I
B)III
C)II
D)II,III
E)None of these displays show the conditional distribution of politics among the males.
Which graphical display shows the conditional distribution of politics among the males?
I II
III
A)I
B)III
C)II
D)II,III
E)None of these displays show the conditional distribution of politics among the males.
Unlock Deck
Unlock for access to all 65 flashcards in this deck.
Unlock Deck
k this deck
54
Statistics Canada gives the following mortality data for Canada in 2007.
Create a bar chart for these data.
Create a bar chart for these data.
Unlock Deck
Unlock for access to all 65 flashcards in this deck.
Unlock Deck
k this deck
55
Most women who have had a mastectomy can have breast reconstruction surgery.The reconstruction surgery can be performed at the same time as the mastectomy,an immediate reconstruction,or after the patient has healed from the mastectomy,second surgery reconstruction.Some women opt not to have reconstruction surgery.The table shows the percentages of women's choices regarding reconstruction for three age categories.A graphical display of the conditional distributions of reconstruction choice by age is given.
Does there appear to be an association between reconstruction choice and age? Explain.
A)No.The number of women over 50 who were included in these data was probably higher than the number who were under 35.Using this assumption,there is not enough evidence to show an association between reconstruction choice and age.
B)Yes.A higher percentage of older women,especially over 50,who have had mastectomies choose not to have reconstruction surgery.Likewise,a higher percentage of younger patients choose to have immediate reconstruction.It appears that as the age of women having mastectomies increases,the importance of having reconstructive breast surgery decreases.
C)No.The percentages of women who have had mastectomies who choose to have second surgery reconstruction do not vary significantly.There is not enough evidence to show an association between reconstruction choice and age.
D)No.In all age groups,most women want reconstruction surgery.
E)Yes.A higher percentage of older women,especially over 50,who have had mastectomies choose to have second surgery reconstruction.It appears that as the age of women having mastectomies increases,the importance of having reconstructive breast surgery increases.
Unlock Deck
Unlock for access to all 65 flashcards in this deck.
Unlock Deck
k this deck
56
The table below compares what students at a small Canadian college did after graduating with a bachelor's degree in 1992,1998,and 2003.A graphical display of the conditional distributions of what students did after graduation by year is given.
Does this study present any evidence that postgraduation plans have changed over this 11-year period? Explain.
A)Yes.There is evidence that the percentage of graduates entering the work force after graduation has increased from 1992 to 2003.Likewise,the percentage of graduates continuing their education appears to have decreased from 1992 to 2003.
B)Yes.There is evidence that the percentage of graduates continuing their education has increased from 1992 to 2003.Likewise,the percentage of graduates entering the work force after graduation appears to have decreased from 1992 to 2003.
C)No.The percentage of graduates continuing their education has increased from 1992 to 2003.Likewise,the percentage of graduates entering the work force after graduation appears to have decreased from 1992 to 2003.However,this is not sufficient evidence to show any change due to the fact that those entering the military or seeking other options remained relatively constant.
D)No.The percentage of graduates continuing their education has increased from 1992 to 2003.Likewise,the percentage of graduates entering the work force after graduation appears to have decreased from 1992 to 2003.However,this is not sufficient evidence to show any change due to the fact that the number of students graduating has increased over this same time period.
E)Yes.There is evidence that the percentage of graduates continuing their education and entering the work force after graduation has increased from 1992 to 2003.
Unlock Deck
Unlock for access to all 65 flashcards in this deck.
Unlock Deck
k this deck
57
The focus of a recent survey was was on teenagers' familiarity with and use of modern technology.The teenagers were asked if they used each of the following technologies on a daily basis and if the technology was critically important to own.For each question,the percentage of those responding "Yes" is given.Subtracting the "Use daily" percentage from the "Critically important to own" percentage gives the "Importance Gap".Here are the results:
Which of the following displays is the most appropriate for these data?
I II
III
A)III
B)I
C)II
D)All of these displays are equally appropriate.
E)None of these displays are appropriate.
Which of the following displays is the most appropriate for these data?
I II
III
A)III
B)I
C)II
D)All of these displays are equally appropriate.
E)None of these displays are appropriate.
Unlock Deck
Unlock for access to all 65 flashcards in this deck.
Unlock Deck
k this deck
58
A company held a cholesterol screening clinic for its employees.The results are summarized in the table below by age group and cholesterol level.A graphical display of the conditional distributions of cholesterol levels by age is given.
Does this prove that aging causes increased cholesterol levels? Explain.
A)No.There is sufficient evidence of an association between age and cholesterol level.However,the percentage of employees with low cholesterol increased with age.Likewise,the percentage of employees with high cholesterol decreased with age.
B)No.Generally,an association between two variables does not imply a cause-and-effect relationship.Specifically,these data come from only one company and cannot be applied to all people.Only a controlled experiment can isolate the relationship between age and cholesterol level.
C)No.Generally,an association between two variables does imply a cause-and-effect relationship.Specifically,these data come from only one company and cannot be applied to all people.However,if more companies provided cholesterol screenings and these data were compiled,then the claim could be proven.
D)Yes.Generally,an association between two variables does imply a cause-and-effect relationship.However,these data come from only one company and cannot necessarily be applied to all people.A controlled experiment that can isolate the relationship between age and cholesterol level would make this a stronger claim.
E)Yes.There is evidence of an association between age and cholesterol level.The percentage of employees with high cholesterol increased with age.Likewise,the percentage of employees with low cholesterol decreased with age.
Unlock Deck
Unlock for access to all 65 flashcards in this deck.
Unlock Deck
k this deck
59
A company must decide which of two delivery services they will contract with.During a recent trial period they shipped numerous packages with each service,and have kept track of how often deliveries did not arrive on time.Here are the data:
Based on the results,the company decided to hire Fast Paks.Do you agree they deliver on time more often? Explain.
A)Yes.Fast Paks only delivers 4% of its regular packages late,compared to Super Ship,who deliver 5% of its regular packages late.Additionally,Fast Paks only delivers 9% of its overnight packages late,compared to Super Ship,who delivers 16% of its overnight packages late.Fast Paks is better at delivering regular and overnight packages.
B)No.Super Ship only delivers 4% of its regular packages late,compared to Fast Paks,who deliver 5% of its regular packages late.Additionally,Super Ship only delivers 9% of its overnight packages late,compared to Fast Paks,who delivers 16% of its overnight packages late.Super Ship is better at delivering regular and overnight packages.
C)No.Fast Paks only delivers 0.08% of its packages late,compared to Super Ship,who delivers 0.07% of its packages late.Super Ship is better at delivering regular and overnight packages.
D)Yes.Fast Paks only delivers 0.07% of its packages late,compared to Super Ship,who delivers 0.08% of its packages late.Fast Paks is better at delivering regular and overnight packages.
E)No.This is an example of Simpson's paradox and unfair averaging.Since the overall percentages and the individual percentages disagree on which delivery service is better,both services can be considered equal.It cannot be determined whether Super Ship or Fast Paks deliver packages on time more often.
Unlock Deck
Unlock for access to all 65 flashcards in this deck.
Unlock Deck
k this deck
60
Students in a political science course were asked to describe their politics as "Liberal","Moderate",or "Conservative." The results are listed in the table below,and a graphical display of the conditional distributions of sex among the three categories of politics is given.
The political science instructor states that sex and politics are independent.Is this an accurate statement? Explain.
A)No.The percentage of males and females varies across political categories.The percentage of Liberals and Moderates who are female is approximately twice that of Conservatives who are female.This would suggest that sex and politics are not independent.
B)No.The percentage of males and females varies across political categories.The percentage of Liberals and Moderates who are male is approximately twice that of Conservatives who are male.This would suggest that sex and politics are not independent.
C)Yes.The percentage of males and females varies across political categories;however,there are more males in the class than females.There is not enough evidence to make an association between sex and politics.Sex and politics are independent.
D)No.The percentage of males and females is similar across political categories.This would suggest that sex and politics are not independent.
E)Yes.The percentage of males and females is similar across political categories.This would suggest that sex and politics are independent.
Unlock Deck
Unlock for access to all 65 flashcards in this deck.
Unlock Deck
k this deck
61
A survey of automobiles parked in student and staff lots at a large university classified the brands by country of origin.The results are listed in the table below.
Create a segmented bar graph which shows the conditional distributions of origin for both students and staff.
Create a segmented bar graph which shows the conditional distributions of origin for both students and staff.
Unlock Deck
Unlock for access to all 65 flashcards in this deck.
Unlock Deck
k this deck
62
Students in a Political Science course were asked to describe their politics as "Liberal","Moderate",or "Conservative." The results are listed in the table below.
Create a segmented bar graph which shows the conditional distributions by gender for each political category.
Create a segmented bar graph which shows the conditional distributions by gender for each political category.
Unlock Deck
Unlock for access to all 65 flashcards in this deck.
Unlock Deck
k this deck
63
A company held a cholesterol screening clinic for its employees.The results are summarized in the table below by age group and cholesterol level.
Create a segmented bar graph which shows the conditional distributions of cholesterol levels for each age group.
Create a segmented bar graph which shows the conditional distributions of cholesterol levels for each age group.
Unlock Deck
Unlock for access to all 65 flashcards in this deck.
Unlock Deck
k this deck
64
Students in a Political Science course were asked to describe their politics as "Liberal","Moderate",or "Conservative." Here are the results:
Produce a pie chart that shows the marginal distribution of politics in the class.
Produce a pie chart that shows the marginal distribution of politics in the class.
Unlock Deck
Unlock for access to all 65 flashcards in this deck.
Unlock Deck
k this deck
65
The table compares what students at a Canadian college did after graduating in 1992,1998,and 2003.
Create a segmented bar graph which shows the conditional distributions of plans for each of the three years.
Create a segmented bar graph which shows the conditional distributions of plans for each of the three years.
Unlock Deck
Unlock for access to all 65 flashcards in this deck.
Unlock Deck
k this deck
Unlock Deck
Unlock for access to all 65 flashcards in this deck.


