Exam 2: Displaying and Describing Categorical Data
Exam 1: Data30 Questions
Exam 2: Displaying and Describing Categorical Data65 Questions
Exam 3: Displaying and Summarizing Quantitative Data93 Questions
Exam 4: Understanding and Comparing Distributions102 Questions
Exam 5: The Standard Deviation As a Ruler and the Normal Model131 Questions
Exam 6: Scatterplots, association, and Correlation74 Questions
Exam 7: Linear Regression57 Questions
Exam 8: Regression Wisdom32 Questions
Exam 9: Re-Expressing Data: Get It Straight51 Questions
Exam 10: Understanding Randomness26 Questions
Exam 11: Sample Surveys50 Questions
Exam 12: Experiments and Observational Surveys87 Questions
Exam 13: From Randomness to Probability64 Questions
Exam 14: Probability Rules90 Questions
Exam 15: Random Variables112 Questions
Exam 16: Probability Models114 Questions
Exam 17: Sampling Distribution Models45 Questions
Exam 18: Confidence Intervals for Proportions56 Questions
Exam 19: Testing Hypotheses About Proportions50 Questions
Exam 20: More About Tests69 Questions
Exam 21: Comparing Two Proportions52 Questions
Exam 22: Inferences About Means106 Questions
Exam 23: Comparing Means43 Questions
Exam 24: Paired Samples and Blocks33 Questions
Exam 25: Comparing Counts78 Questions
Exam 26: Inferences for Regression51 Questions
Exam 27: Analysis of Variance39 Questions
Exam 28: Multifactor Analysis of Variance22 Questions
Exam 29: Multiple Regression22 Questions
Exam 30: Multiple Regression Wisdom21 Questions
Exam 31: Rank-Based Nonparametric Tests29 Questions
Exam 32: The Bootstrap31 Questions
Select questions type
A college examined the impact of an applicant's ethnicity on the likelihood of admission to a particular program.The data are summarized in the table below. 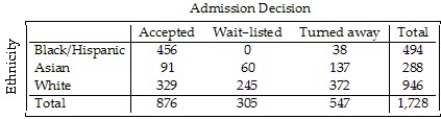 What percent of the students accepted were Black or Hispanic?
Free
(Multiple Choice)
5.0/5  (32)
(32)
Correct Answer: Verified
D
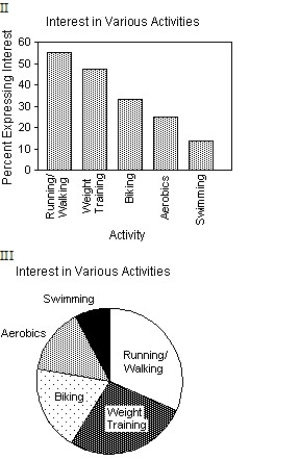
The City of Windsor Department of Parks and Recreation is planning to build a recreation centre in one of the city's parks.They conducted a poll to find out the types of physical activities the local population would be interested in.The poll was based on telephone responses from 1013 randomly selected adults.The table shows the percentages of people who expressed interest in various activities. 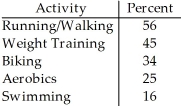 Is it reasonable to conclude that 59% expressed interest in either biking or aerobics?
Free
(Multiple Choice)
4.7/5 (30)
Correct Answer:Verified
C
Students in a political science course were asked to describe their politics as "Liberal","Moderate",or "Conservative." Here are the results: 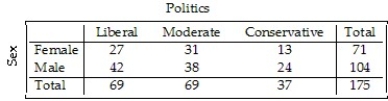 What percent of all "Moderates" in the class are male?
Free
(Multiple Choice)
4.9/5 (31)
Correct Answer:Verified
B
Of the 1,470 applicants to a college program,760 were accepted,269 were wait-listed,and 441 were turned away for lack of space.Find the relative frequency distribution of the decisions made,and write a sentence describing it.
(Multiple Choice)
4.8/5 (43)
A college examined the impact of an applicant's ethnicity on the likelihood of admission to a particular program.The data are summarized in the table below. 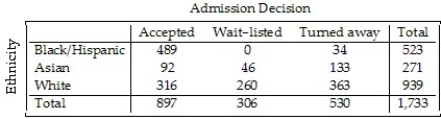 What percent of all students were turned away?
(Multiple Choice)
4.9/5 (30)
Statistics Canada gives the following mortality data for Canada in 2007.  Create a bar chart for these data.
(Essay)
4.8/5 (37)
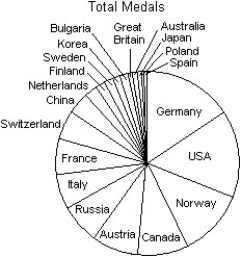
A prediction of the number of medals to be won by various countries in the 2010 Winter Olympics was made using past Olympics data.The predicted values are listed in the table below. 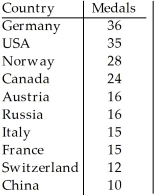
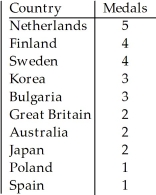 Which of the following displays is the most appropriate for these data?
I
Which of the following displays is the most appropriate for these data?
I 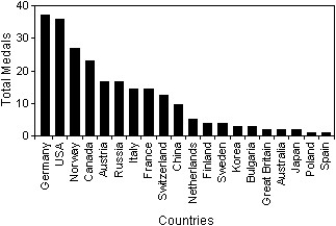 II III
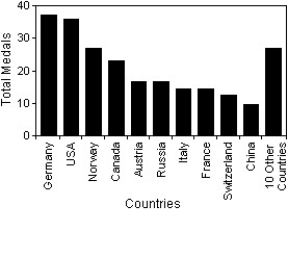
(Multiple Choice)
4.8/5 (31)
A survey of automobiles parked in student and staff lots at a large university classified the brands by country of origin.The results are listed in the table below,and a graphical display of the conditional distributions of origin by driver is given. 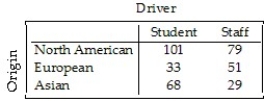
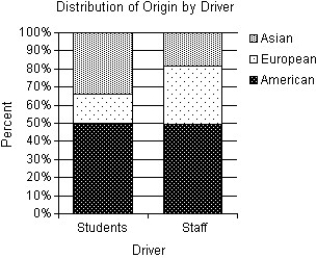 Do you think that origin of the car is independent of the type of driver? Explain.
(Multiple Choice)
4.8/5 (28)
Students in a political science course were asked to describe their politics as "Liberal","Moderate",or "Conservative." Here are the results: 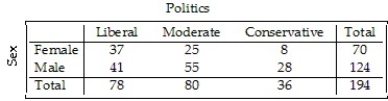 What percent of all males in the class are "Liberals"?
(Multiple Choice)
4.8/5 (27)
Statistics Canada gives the following mortality data for Canada in 2000. 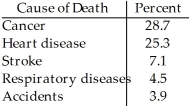 Create a bar chart for these data.
(Essay)
4.8/5 (30)
A survey of automobiles parked in student and staff lots at a large university classified the brands by country of origin,as seen in the table. 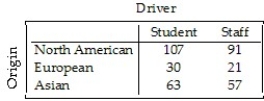 What percent of the staff owned North American cars?
(Multiple Choice)
4.8/5 (37)
A company must decide which of two delivery services they will contract with.During a recent trial period they shipped numerous packages with each service,and have kept track of how often deliveries did not arrive on time.Here are the data: 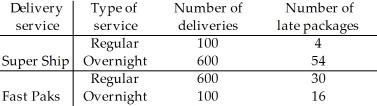 Based on the results,the company decided to hire Fast Paks.Do you agree they deliver on time more often? Explain.
(Multiple Choice)
4.9/5 (39)
A company held a blood pressure screening clinic for its employees.The results are summarized in the table below by age group and blood pressure level. 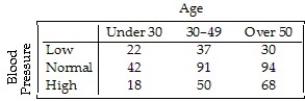 Find the conditional distribution of blood pressure level for employees between 30 and 49.
(Multiple Choice)
4.8/5 (38)
The Centers for Disease Control in the U.S.A.lists causes of death for individual states in 2002.The mortality data for one state is given. 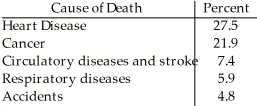 Which of the following displays is/are appropriate for these data? (More than one display may be appropriate. )
I II
Which of the following displays is/are appropriate for these data? (More than one display may be appropriate. )
I II 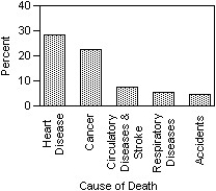
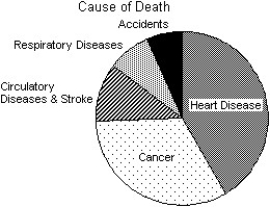 III
III 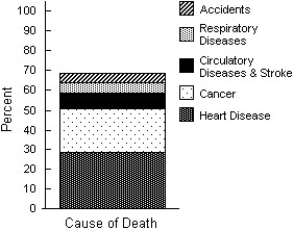
(Multiple Choice)
4.7/5 (28)
A poll asked adults which activities they had engaged in during the past month.The results are listed below. 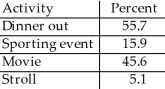 Is it reasonable to conclude that 61.5% of those polled had seen a movie or gone to a sporting event during the past month?
(Multiple Choice)
4.9/5 (36)
The Centers for Disease Control in the U.S.A.lists causes of death for individual states in 2002.The mortality data for one state is given. 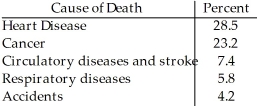 Which of the following displays is/are appropriate for these data? (More than one display may be appropriate. )
I II
Which of the following displays is/are appropriate for these data? (More than one display may be appropriate. )
I II 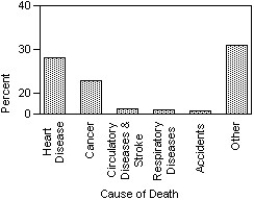
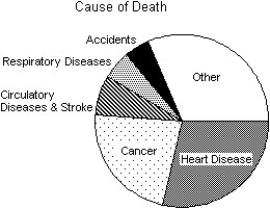 III
III 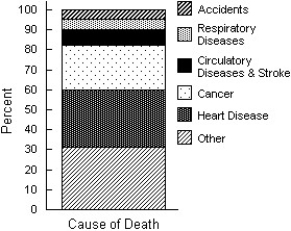
(Multiple Choice)
4.8/5 (36)
Statistics Canada gives the following mortality data for Canada in 2007. 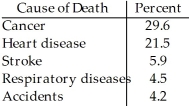 What percent of deaths were from causes not listed here?
(Multiple Choice)
4.7/5 (35)
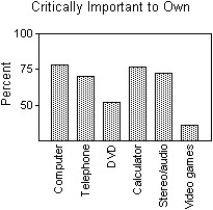
The focus of a recent survey was was on teenagers' familiarity with and use of modern technology.The teenagers were asked if they used each of the following technologies on a daily basis and if the technology was critically important to own.For each question,the percentage of those responding "Yes" is given.Subtracting the "Use daily" percentage from the "Critically important to own" percentage gives the "Importance Gap".Here are the results: 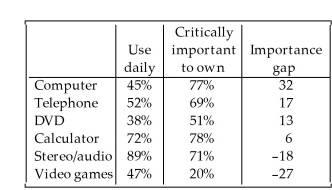 Which of the following displays is the most appropriate for these data?
I II
Which of the following displays is the most appropriate for these data?
I II 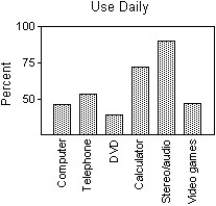
 III
III 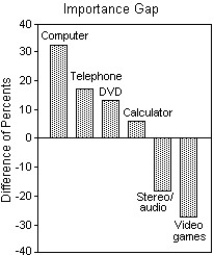
(Multiple Choice)
4.8/5 (31)
The City of Windsor Department of Parks and Recreation is planning to build a recreation centre in one of the city's parks.They conducted a poll to find out the types of physical activities the local population would be interested in.The poll was based on telephone responses from 1013 randomly selected adults.The table shows the percentages of people who expressed interest in various activities. 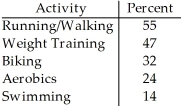 Which of the following displays is/are appropriate for these data? (More than one display may be appropriate. )
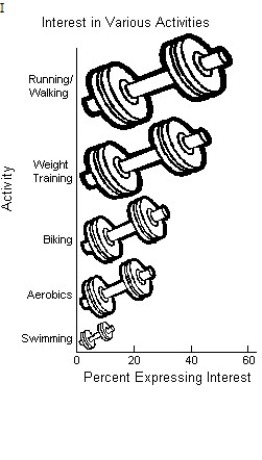
(Multiple Choice)
4.8/5 (33)
A company held a blood pressure screening clinic for its employees.The results are summarized in the table below by age group and blood pressure level. 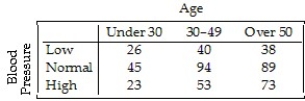 Find the conditional distribution of blood pressure level for employees over 50.
(Multiple Choice)
4.8/5 (38)
Filters
- Essay(0)
- Multiple Choice(0)
- Short Answer(0)
- True False(0)
- Matching(0)