Deck 4: Understanding and Comparing Distributions
Full screen (f)
Question
Question
Question
Question
Three statistics classes (50 students each)took the same test.Shown below are histograms of the scores for the classes.Use the histograms to answer the question. 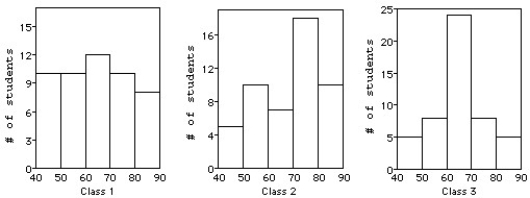
Which class had the highest median score?
A)Class 2
B)Class 1 and class 3
C)Class 3
D)Class 1
E)None,because the classes had the same median.
Which class had the highest median score?
A)Class 2
B)Class 1 and class 3
C)Class 3
D)Class 1
E)None,because the classes had the same median.
Question
Question
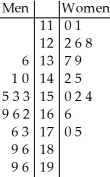
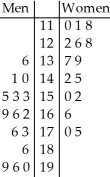
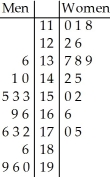
The centre for health in a certain country compiles data on the length of stay by patients in short-term hospitals and publishes its statistical findings annually.Data from a sample of 67 male patients and 63 female patients on length of stay (in days)are displayed in the histograms below. 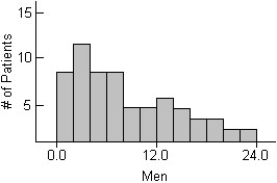
i)What would you suggest be changed about these histograms to make them easier to compare?
ii)Describe these distributions by writing a few sentences comparing the duration of hospitalization for men and women.
Iii)Can you suggest a reason for the peak in women's length of stay?
A)i)They should be put on the same scale,from 0 to 40 days.
Ii)Men have a mode near 1 day,then tapering off from there.Women have a mode near 6 days with a sharp drop afterward.
Iii)A possible reason is childbirth.
B)i)They should be put on the same scale,from 0 to 33 days.
Ii)Men have a mode near 3 days,then tapering off from there.Women have a mode near 8 days with a sharp drop afterward.
Iii)A possible reason is childbirth.
C)i)They should be put on the same scale,from 0 to 25 days.
Ii)Men have a mode near 2 days,then tapering off from there.Women have a mode near 4 days with a sharp drop afterward.
Iii)A possible reason is childbirth.
D)i)They should be put on the same scale,from 0 to 15 days.
Ii)Men have a mode near 3 days,then tapering off from there.Women have a mode near 10 days with a sharp drop afterward.
Iii)A possible reason is childbirth.
E)i)They should be put on the same scale,from 0 to 18 days.
Ii)Men have a mode near 7 days,then tapering off from there.Women have a mode near 1 day with a sharp drop afterward.
Iii)A possible reason is childbirth.
Question
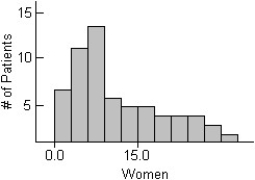
The histograms display the body fat percentages of 42 female students and 48 male students taking a college health course. 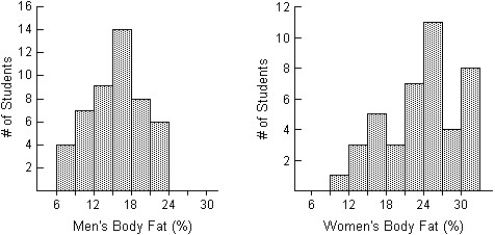
Compare the distributions (shape,centre,spread,unusual features).
A)The distribution of body fat percentages for men is unimodal and symmetric,with a centre at around 15%.Body fat percentages vary from approximately 6% to 24%.The distribution of body fat percentages for women is unimodal and slightly skewed to the left,with a typical value of 24%.The women's body fat percentages vary from approximately 9% to 33%.In general,the body fat percentages of men are higher than the body fat percentages of women.Additionally,the body fat percentages of men appear more consistent then the body fat percentages for women.
B)The distribution of body fat percentages for men is unimodal and symmetric,with a centre at around 15%.Body fat percentages vary from approximately 6% to 24%.The distribution of body fat percentages for women is unimodal and slightly skewed to the left,with a typical value of 24%.The women's body fat percentages vary from approximately 9% to 33%.In general,the body fat percentages of men are lower than the body fat percentages of women.Additionally,the body fat percentages of women appear more consistent then the body fat percentages for men.
C)The distribution of body fat percentages for men is unimodal and symmetric,with a centre at around 15%.Body fat percentages vary from approximately 6% to 24%.The distribution of body fat percentages for women is unimodal and slightly skewed to the left,with a typical value of 24%.The women's body fat percentages vary from approximately 9% to 33%.In general,the body fat percentages of men are lower than the body fat percentages of women.Additionally,the body fat percentages of men appear more consistent then the body fat percentages for women.
D)The distribution of body fat percentages for men is unimodal and symmetric,with a centre at around 24%.Body fat percentages vary from approximately 6% to 30%.The distribution of body fat percentages for women is unimodal and slightly skewed to the left,with a typical value of 24%.The women's body fat percentages vary from approximately 6% to 30%.In general,the body fat percentages of men and women are the same;however,the body fat percentages of men appear more consistent then the body fat percentages for women.
E)The distribution of body fat percentages for men is unimodal and symmetric,with a centre at around 15%.Body fat percentages vary from approximately 6% to 24%.The distribution of body fat percentages for women is unimodal and slightly skewed to the right,with a typical value of 24%.The women's body fat percentages vary from approximately 9% to 33%.In general,the body fat percentages of men are lower than the body fat percentages of women.Additionally,the body fat percentages of men appear more consistent then the body fat percentages for women.
Question
The back-to-back stem-and-leaf display compares the annual precipitation,in millimetres,of of two towns over a period of 14 years.The lower stem contains leaves with the digits 0-4 and the upper stem contains leaves with digits 5-9. 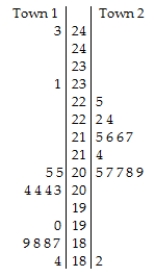
Key:
20 | 7 = 20.7 millimetres
A)The distribution of annual precipitation in Town 1 is bimodal,with one cluster centred around the mid 20s and another cluster in the high 18s.There are two high outliers of 23.1 and 24.3 mm for Town 1.In Town 2,the distribution of annual precipitation is unimodal and skewed right,clustered predominantly between 20.5 and 22.4.There is a low outlier of 18.2 mm for Town 2.The annual precipitation is generally higher and more sporadic in Town 1.
B)The distribution of annual precipitation in Town 1 is bimodal,with one cluster centred around the mid 20s and another cluster in the high 18s.There are two high outliers of 23.1 and 24.3 mm for Town 1.In Town 2,the distribution of annual precipitation is unimodal and skewed right,clustered predominantly between 20.5 and 22.4.There is a low outlier of 18.2 mm for Town 2.The annual precipitation is more consistent in Town 2;but overall,both cities have the same average annual precipitation.
C)The distribution of annual precipitation in Town 1 is bimodal,with one cluster centred around the mid 20s and another cluster in the high 18s.There are two high outliers of 23.1 and 24.3 mm for Town 1.In Town 2,the distribution of annual precipitation is unimodal and skewed left,clustered predominantly between 20.5 and 22.4.There is a low outlier of 18.2 mm for Town 2.The annual precipitation is generally higher and more consistent in Town 2.
D)The distribution of annual precipitation in Town 1 is bimodal,with one cluster centred around the mid 20s and another cluster in the high 18s.In Town 2,the distribution of annual precipitation is unimodal and skewed right,clustered predominantly between 20.5 and 22.4.The annual precipitation is generally higher and more consistent in Town 2.
E)The distribution of annual precipitation in Town 1 is bimodal,with one cluster centred around the mid 20s and another cluster in the high 18s.There are two high outliers of 23.1 and 24.3 mm for Town 1.In Town 2,the distribution of annual precipitation is unimodal and skewed right,clustered predominantly between 20.5 and 22.4.There is a low outlier of 18.2 mm for Town 2.The annual precipitation is generally higher and more consistent in Town 2.
Question
Question
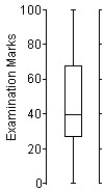
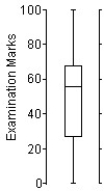
Match each class with the corresponding boxplot below. 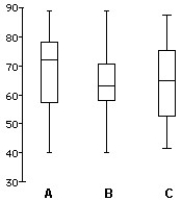
A)Class 1 is B
Class 2 is C
Class 3 is A
B)Class 1 is B
Class 2 is A
Class 3 is C
C)Class 1 is A
Class 2 is B
Class 3 is C
D)Class 1 is C
Class 2 is A
Class 3 is B
E)Class 1 is C
Class 2 is B
Class 3 is A
A)Class 1 is B
Class 2 is C
Class 3 is A
B)Class 1 is B
Class 2 is A
Class 3 is C
C)Class 1 is A
Class 2 is B
Class 3 is C
D)Class 1 is C
Class 2 is A
Class 3 is B
E)Class 1 is C
Class 2 is B
Class 3 is A
Question
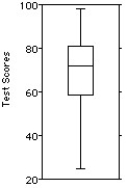
Shown below are the boxplot and the histogram for the weights (in pounds)of 30 newborn babies in the U.S.A.. 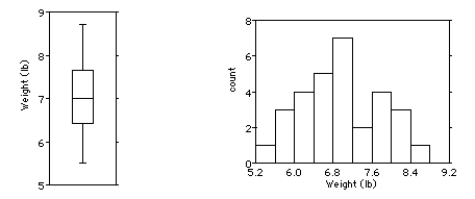
i.What features of the distribution can you see in both the histogram and the boxplot?
ii.What features of the distribution can you see in the histogram that you could not see in the boxplot?
A)i)The distribution is bimodal and symmetric.There are two outliers at about 5.4 and 8.6.The mean and median values are about the same.
ii.The dip at about 7.4 lb,for example,is apparent only from the histogram.
B)i)The distribution is unimodal and skewed to the right.There are no outliers.The mean is greater than the median.
ii.The dip at about 7.4 lb,for example,is apparent only from the histogram.
C)i)The distribution is unimodal and symmetric.There are two outliers at about 5.4 and 8.6.The mean and median values are about the same.
ii.The dip at about 7.4 lb,for example,is apparent only from the histogram.
D)i)The distribution is unimodal and skewed to the left.There are no outliers.The mean is less than the median.
ii.The dip at about 7.4 lb,for example,is apparent only from the histogram.
E)i)The distribution is unimodal and symmetric.There are no outliers.The mean and median values are about the same.
ii.The dip at about 7.4 lb,for example,is apparent only from the histogram.
Question
Three statistics classes (50 students each)took the same test.Shown below are histograms of the scores for the classes.Use the histograms to answer the question.
For which class are the mean and median most different?
A)Class 2,because the shape is symmetric.
B)Class 2,because the shape is skewed to the right.
C)Class 1,because the shape is skewed to the left.
D)Class 3,because the shape is symmetric.
E)Class 2,because the shape is skewed to the left.
For which class are the mean and median most different?
A)Class 2,because the shape is symmetric.
B)Class 2,because the shape is skewed to the right.
C)Class 1,because the shape is skewed to the left.
D)Class 3,because the shape is symmetric.
E)Class 2,because the shape is skewed to the left.
Question
Question
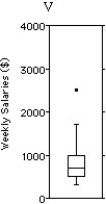
Shown below are the boxplot and the histogram for the weekly salaries (in dollars)of 24 randomly selected employees of a company: 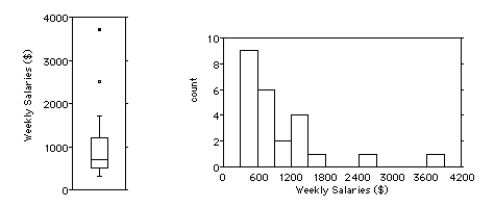
i.What features of the distribution can you see in both the histogram and the boxplot?
ii.What features of the distribution can you see in the boxplot that you could not see in the histogram?
A)i)The distribution is unimodal and skewed to the right,with two outliers at $2500 and about $3700.The mean is greater than the median because of the skewedness.
ii.You can more easily tell from the boxplot that the median is about $700 with quartiles at about $500 and $1200.
B)i)The distribution is symmetrical,with two outliers at $2900 and about $3000.The mean and median are about the same.
ii.You can more easily tell from the boxplot that the mean is about $500 with quartiles at about $700 and $1800.
C)i)The distribution is unimodal and skewed to the left,with two outliers at $2500 and about $3700.The mean is lower than the median because of the skewedness.
ii.You can more easily tell from the boxplot that the median is about $900 with quartiles at about $1100 and $1600.
D)i)The distribution is unimodal and skewed to the right,with two outliers at $2900 and about $3000.The mean is greater than the median because of the skewedness.
ii.You can more easily tell from the boxplot that the median is about $700 with quartiles at about $500 and $1200.
E)i)The distribution is symmetrical,with two outliers at $2500 and about $3700.The mean and median are about the same.
ii.You can more easily tell from the boxplot that the mean is about $700 with quartiles at about $500 and $1200.
Question
Describe what these boxplots tell you about the relationship between the provinces and salary,based on the same occupation. 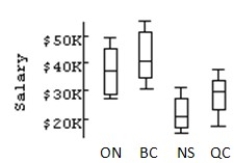
A)ON and BC have very comparable salaries.The average salaries for these provinces are just above $40K,and their spreads are very close.NS is very comparable to ON and BC.The upper 50% of salaries for NS corresponds to the lower 50% of QC salaries.
B)ON and BC have very comparable salaries.The average salaries for these provinces are just below $40K,but their spreads are different.NS is not very comparable to either ON and BC.The upper 50% of salaries for NS corresponds to the lower 50% of QC salaries.
C)ON and BC don't have very comparable salaries.The average salaries for these provinces are just below $40K,and their spreads are different.NS is not very comparable to either ON and BC.The upper 50% of salaries for QC corresponds to the lower 50% of NS salaries.
D)ON and BC have very comparable salaries.The average salaries for these provinces are just below $40K,and their spreads are very close.NS's average is the highest.The upper 50% of salaries for NS corresponds to the lower 50% of QC salaries.
E)ON and BC have very comparable salaries.The average salaries for these provinces are just below $40K,and their spreads are very close.NS is not very comparable to either ON or BC.The upper 50% of salaries for NS corresponds to the lower 50% of QC salaries.
Question
Do men and women run a 5-kilometre race at the same pace? Here are boxplots of the time (in minutes)for a race recently run in Victoria,B.C..Write a brief report discussing what these data show. 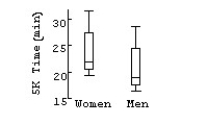
A)Women appear to run about 3 minutes faster than men,but the two distributions are very similar in shape and spread.
B)Men appear to run about 3 minutes faster than women,but the two distributions are very similar in shape and spread.
C)Women appear to run about 3 minutes faster than men,and the two distributions have different IQR.
D)Men appear to run about 3 minutes faster than women,and the two distributions have different IQR.
E)Men appear to run about 10 minutes faster than women,but the two distributions are very similar in shape and spread.
Question
Three statistics classes (50 students each)took the same test.Shown below are histograms of the scores for the classes.Use the histograms to answer the question.
Which class had the highest mean score?
A)Class 3
B)Class 2
C)Class 1
D)Class 1 and class 3
E)None,because the classes had the same mean.
Which class had the highest mean score?
A)Class 3
B)Class 2
C)Class 1
D)Class 1 and class 3
E)None,because the classes had the same mean.
Question
Shown below are the boxplot and the histogram for the highest temperatures ever recorded (in °F)in 32 different states in the U.S.A. 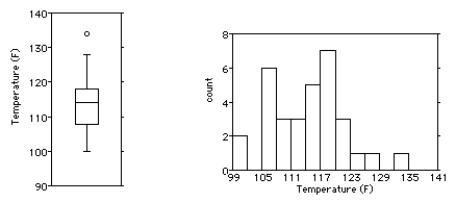
i)What features of the distribution can you see in both the histogram and the boxplot?
ii)What features of the distribution can you see in the histogram that you could not see in the boxplot?
A)i)The distribution is highly skewed to the right,with two outliers at 128°F and 134°F.Most high temperatures are between 105°F and 129°F.
ii)When looking at the histogram,the distribution appears to be bimodal.This is not obvious from the boxplot.
B)i)The distribution is highly skewed to the left,with an outlier at 134°F.Most high temperatures are between 108°F and 130°F.
ii)When looking at the histogram,the distribution appears to be bimodal.This is not obvious from the boxplot.
C)i)The distribution is fairly symmetric,with no outliers.Most high temperatures are between 99°F and 117°F.
ii)When looking at the histogram,the distribution appears to be bimodal.This is not obvious from the boxplot.
D)i)The distribution is highly skewed to the right,with an outlier at 134°F.Most high temperatures are between 105°F and 129°F.
ii)When looking at the histogram,the distribution appears to be bimodal.This is not obvious from the boxplot.
E)i)The distribution is fairly symmetric,with an outlier at 134°F (although this value is only obvious from the boxplot).Most high temperatures are between 107°F and 118°F.
ii)When looking at the histogram,the distribution appears to be bimodal.This is not obvious from the boxplot.
Question
The histograms show the cost of living,in dollars,for 32 Canadian cities.The histogram on the left shows the cost of living for the 32 cities using bins $10 wide,and the histogram on the right displays the same data using bins that are $6 wide. 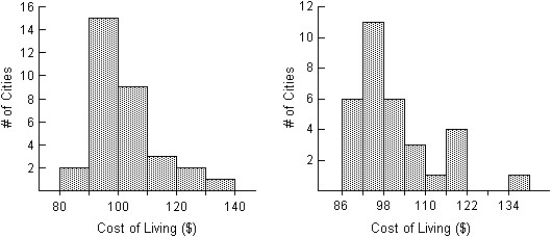
Compare the distributions (shape,centre,spread,unusual features).
A)The distribution in the left histogram of the cost of living in the 32 Canadian cities is unimodal and skewed to the right.The distribution is centred around $100,and spread out,with values ranging from $80 to $140.The distribution in the right histogram appears bimodal,with many cities costing just under $104 and another smaller cluster around $119.There also appears to be an outlier in the right histogram at $134 that was not apparent in the histogram on the left.
B)The distribution in the left histogram of the cost of living in the 32 Canadian cities is unimodal and skewed to the right.The distribution is centred around $100,and spread out,with values ranging from $80 to $140.The distribution in the right histogram is unimodal and symmetric.The distribution is centred around $104,and spread out,with values ranging from $86 to $140.There also appears to be an outlier in the right histogram at $134 that was not apparent in the histogram on the left.
C)The distribution in the left histogram of the cost of living in the 32 Canadian cities is unimodal and skewed to the left.The distribution is centred around $100,and spread out,with values ranging from $80 to $140.The distribution in the right histogram appears bimodal,with many cities costing just under $104 and another smaller cluster around $119.There also appears to be an outlier in the right histogram at $134 that was not apparent in the histogram on the left.
D)The distribution in the left histogram of the cost of living in the 32 Canadian cities is unimodal and skewed to the right.The distribution is centred around $100,and spread out,with values ranging from $80 to $140.The distribution in the right histogram is also unimodal and skewed to the right.The distribution is centred around $104,and spread out,with values ranging from $86 to $140.There also appears to be an outlier in the right histogram at $134 that was not apparent in the histogram on the left.
E)The distribution in the left histogram of the cost of living in the 32 Canadian cities is unimodal and skewed to the right.The distribution is centred around $100,and spread out,with values ranging from $80 to $140.The distribution in the right histogram appears bimodal,with many cities costing just under $104 and another smaller cluster around $119.
Question
The back-to-back stem-and-leaf display compares the percent growth in sales for a retail chain's stores located in two regions of Canada.The lower stem contains leaves with the digits 0-4 and the upper stem contains leaves with digits 5-9. 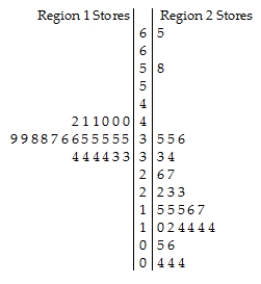
Key:
3 | 5 = 35% sales growth
A)The distribution of sales growth in Region 1 stores is unimodal,symmetric and tightly clustered around 35% growth.The distribution of sales growth in Region 2 stores is much more spread out,with most stores having sales growth between 5% and 35%.A typical Region 2 store had about 15% growth.There were two outliers,one store with 58% growth and another with 65% growth.Generally,the sales growth rates in the Region 2 stores were higher and more variable than the rates in the Region 1 stores.
B)The distribution of sales growth in the Region 1 stores is unimodal,symmetric and tightly clustered around 35% growth.The distribution of sales growth in Region 2 stores is much more spread out,with most stores having sales growth between 5% and 35%.A typical Region 2 store had about 15% growth.There were two outliers,one store with 58% growth and another with 65% growth.Generally,the sales growth rates in the Region 1 stores were higher and less variable than the rates in the Region 2 stores.
C)The distribution of sales growth in Region 1 stores is unimodal,symmetric and tightly clustered around 35% growth.The distribution of sales growth in Region 2 stores is much more spread out,with most stores having sales growth between 5% and 35%.A typical Region 2 store had about 15% growth.There were two outliers,one store with 58% growth and another with 65% growth.Generally,the sales growth rates in the Region 1 stores were higher and more variable than the rates in the Region 2 stores.
D)The distribution of sales growth in Region 1 stores is unimodal,symmetric and tightly clustered around 45% growth.The distribution of sales growth in Region 2 stores is much more spread out,with most stores having sales growth between 5% and 35%.A typical Region 2 store had about 25% growth.There were two outliers,one store with 58% growth and another with 65% growth.Generally,the sales growth rates in the Region 2 stores were higher and more variable than the rates in the Region 1 stores.
E)The distribution of sales growth in Region 1 stores is unimodal,symmetric and tightly clustered around 45% growth.The distribution of sales growth in Region 2 stores is much more spread out,with most stores having sales growth between 5% and 35%.A typical Region 2 store had about 25% growth.There were two outliers,one store with 58% growth and another with 65% growth.Generally,the sales growth rates in the Region 1 stores were higher and less variable than the rates in the Region 2 stores.
Question
The weekly salaries (in dollars)of 24 randomly selected employees of a company are shown below,and displayed on the following boxplot. 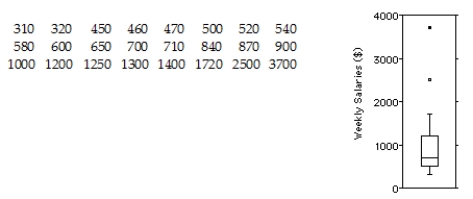
Find the mean and the median.Which is the most appropriate measure of centre?
A)Mean: $979;Median: $705
The median is the most appropriate measure of centre,because the outliers are not significant in the distribution.
B)Mean: $942;Median: $700
The median is the most appropriate measure of centre,because of the outliers.
C)Mean: $979;Median: $705
The mean is the most appropriate measure of centre,because the outliers are not significant in the distribution.
D)Mean: $979;Median: $705
The median is the most appropriate measure of centre,because of the outliers.
E)Mean: $979;Median: $705
The mean is the most appropriate measure of centre,because of the outliers.
Question
The weekly salaries (in dollars)of sixteen government workers are listed below. 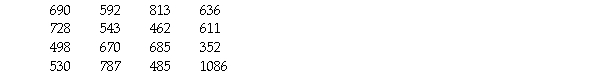
A)352,986
B)611
C)352
D)1086
E)None
A)352,986
B)611
C)352
D)1086
E)None
Question
Here is the stem-and-leaf display of the midterm test scores for a high school typing class. 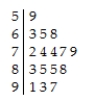
Would you use the median or the mean to describe the centre of this distribution?
A)Mean,because the data are quite symmetric.
B)Mean,because the data are skewed to the right.
C)Median,because the data are skewed to the left.
D)Mean,because the data are skewed to the left.
E)Median,because the data are skewed to the right.
Question
Here are boxplots of the points scored during the first 10 games of the basketball season for both Caroline and Alexandra.Summarize the similarities and differences in their performance so far. 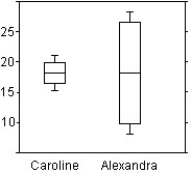
A)Both girls have a median score of about 18 points per game.Alexandra is much more consistent,because her IQR is about 15 points,while Caroline's is over 3.
B)The girls have a different average score per game,but the same median score of about 18 points per game.Their IQR are different,but this does not give anymore information on the girls' performance.
C)Both girls have a median score of about 18 points per game.Caroline is much more consistent,because her IQR is about 6 points,while Alexandra's is over 20.
D)The girls have a different average score per game.Caroline is much more consistent,because her IQR is about 4 points,while Alexandra's is over 15.
E)Both girls have a median score of about 18 points per game.Caroline is much more consistent,because her IQR is about 4 points,while Alexandra's is over 15.
Question
Shown below are the histogram and summary statistics for the reading scores of 29 fifth graders. 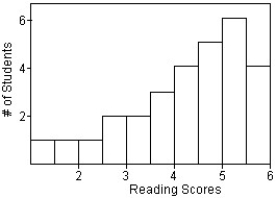

Which measures of centre and spread would you use for this distribution?
A)Mean and standard deviation,because the data is symmetric.
B)Median and IQR,because the data is skewed to the left.
C)Mean and standard deviation,because the data is skewed to the left.
D)Mean and IQR,because the data is skewed to the left.
E)Median and standard deviation,because the data is skewed to the left.
Question
The boxplots display case prices (in dollars)of white wines produced by three vineyards in south-western Ontario.In which vineyard are the wines generally more expensive? 
A)Vineyards A and B,because they have a similar average price,and roughly the same spread.
B)Vineyard C,because it has the highest average price and the smallest spread.
C)Vineyard C,because it has the smallest range.
D)Vineyard B,because it has the highest case price at about $150.
E)Vineyard A,because it has one outlier at about $145.
Question
The weekly salaries (in dollars)of 24 randomly selected employees of a company are shown below,and displayed on the following boxplot. 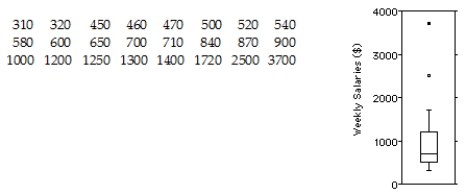
Find the IQR and the standard deviation.Which is the most appropriate measure of spread?
A)IQR: $789.3;standard deviation: $740
The IQR is the most appropriate measure of centre,because of the outliers.
B)IQR: $715;standard deviation: $769
The standard deviation is the most appropriate measure of centre,because of the outliers.
C)IQR: $715;standard deviation: $769
The standard deviation is the most appropriate measure of centre,because the outliers are not significant in the distribution.
D)IQR: $715;standard deviation: $769
The IQR is the most appropriate measure of centre,because the outliers are not significant in the distribution.
E)IQR: $715;standard deviation: $769
The IQR is the most appropriate measure of centre,because of the outliers.
Question
Office workers were asked how long it took them,in minutes,to travel to work one morning.Here is the stem-and-leaf display. 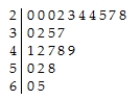
Would you use the median or the mean to describe the centre of this distribution?
A)Mean,because the data are skewed to the right.
B)Mean,because the data are skewed to the left.
C)Mean,because the data are symmetric.
D)Median,because the data are skewed to the right.
E)Median,because the data are skewed to the left.
Question
The boxplots display case prices (in dollars)of white wines produced by three vineyards in south-western Ontario.Which vineyard produces the cheapest wine? 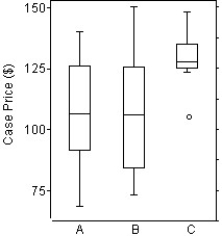
A)Vineyard C,because it has the smallest range.
B)Vineyard B,because it does not have any outliers.
C)Vineyard C,because it has the smallest IQR.
D)Vineyard B,because it has the highest case price at about $150.
E)Vineyard A,because it has the smallest case price at about $60.
A)Vineyard C,because it has the smallest range.
B)Vineyard B,because it does not have any outliers.
C)Vineyard C,because it has the smallest IQR.
D)Vineyard B,because it has the highest case price at about $150.
E)Vineyard A,because it has the smallest case price at about $60.
Question
The times,in minutes,it took for 21 students to finish writing a statistics test are given below. 
A)8.0,60.9,64.5
B)60.9,64.5
C)64.5
D)24.6
E)None
A)8.0,60.9,64.5
B)60.9,64.5
C)64.5
D)24.6
E)None
Question
Here are summary statistics of the last four digits of the credit card number of 500 customers,corresponding to the following histogram. 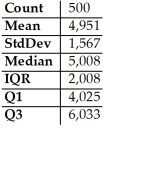
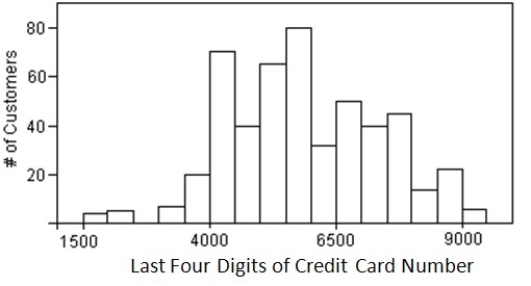
Is the mean or median a "better" summary of the centre of the distribution?
A)Median,because the IQR is smaller than the standard deviation.
B)Median,because of the outliers.
C)Mean,because the distribution is quite symmetric.
D)Neither,because these are not categorical data.
E)Neither,because these are not quantitative data.
Question
Here are 3 boxplots of weekly gas prices at a service station in the U.S.A.(price in $ per gallon).Compare the distribution of prices over the three years. 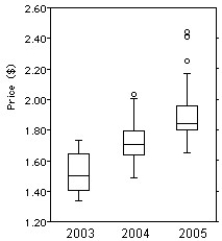
A)Gas price have been increasing on average over the 3-year period,but the spread has been decreasing.The distribution has been skewed to the left,and there were 3 high outliers in 2005.
B)Gas price have been increasing on average over the 3-year period,and the spread has been increasing as well.The distribution has been skewed to the right,and there were 3 high outliers in 2005.
C)Gas price have been decreasing on average over the 3-year period,and the spread has been decreasing.The distribution has been skewed to the left,and there were 3 high outliers in 2005.
D)Gas price have been decreasing on average over the 3-year period,but the spread has been increasing.The distribution has been skewed to the right,and there were 3 high outliers in 2005.
E)Gas price have been increasing on average over the 3-year period,and the spread has been increasing as well.The distribution has been skewed to the left,and there were 3 high outliers in 2005.
Question
The Ontario Ministry of Education collects data on the number of years of teaching experience of high school teachers.A sample taken this year of 19 high school teachers yielded the following data on number of years of teaching experience. 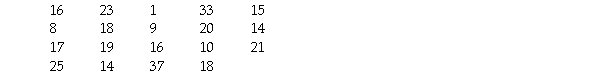
A)33,37
B)1
C)1,33,37
D)1,37
E)None
A)33,37
B)1
C)1,33,37
D)1,37
E)None
Question
Here are boxplots of the points scored during the first 10 games of the basketball season for both Caroline and Alexandra.The coach can take only one player to the state championship.Which one should she take knowing that she would like a safe player? 
A)Alexandra,because she is the more consistent player.
B)Both of them,because both girls have a median score of about 18 points per game.
C)Caroline,because she is the more consistent player.
D)Caroline,because the IQR is the largest.
E)Alexandra,because the IQR is the largest.
A)Alexandra,because she is the more consistent player.
B)Both of them,because both girls have a median score of about 18 points per game.
C)Caroline,because she is the more consistent player.
D)Caroline,because the IQR is the largest.
E)Alexandra,because the IQR is the largest.
Question
Office workers were asked how long it took them,in minutes,to travel to work one morning.Here is the stem-and-leaf display. 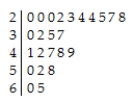
Without actually finding the mean and the median,would you expect the mean to be higher or lower than the median?
A)Lower,because the data are skewed to the left.
B)Higher,because the data are skewed to the left.
C)Lower,because the data are skewed to the right.
D)Higher,because the data are skewed to the right.
E)Neither,because the mean would be equal to the median.
Question
Here are the summary statistics for mathematics scores for one high school graduating class,and the parallel boxplots comparing the scores of male and female students.Write a brief report on these results.Be sure to discuss shape,centre,and spread of the scores. 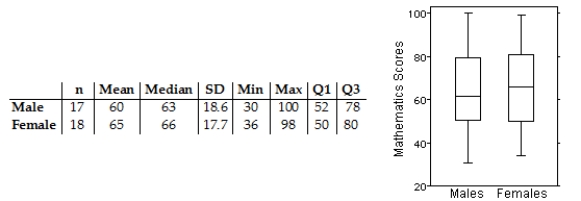
A)Median score by females at 66 points is 3 points higher than that by males,and female mean is higher by 5.The middle 50% for both group is close with a IQR at 26 for the males and 30 for the females.The males have a larger range from 30 to 100.The distribution is right-skewed for the females and symmetric for the males.
B)Median score by females at 66 points is 3 points higher than that by males,and female mean is higher by 5.The middle 50% for both group is close with a IQR at 26 for the males and 30 for the females.The males have a larger range from 30 to 100.Both distributions are right-skewed.
C)Median score by females at 66 points is 3 points higher than that by males,and female mean is higher by 5.The middle 50% for both group is close with a IQR at 26 for the males and 30 for the females.The males have a larger range from 30 to 100.The distribution is right-skewed for the males and symmetric for the females.
D)Median score by females at 66 points is 3 points higher than that by males,and male mean is higher by 5.The middle 50% for both group is close with a IQR at 30 for the males and 26 for the females.The males have a larger range from 30 to 100.The distribution is right-skewed for the males and symmetric for the females.
E)Median score by females at 66 points is 3 points higher than that by males,and female mean is higher by 5.The middle 50% for both group is close with a IQR at 26 for the males and 30 for the females.The males have a smaller range from 30 to 100.Both distributions are left-skewed.
Question
The boxplots display case prices (in dollars)of white wines produced by three vineyards in south-western Ontario.Which vineyard produces the most expensive wine? 
A)Vineyard B,because it has the highest case price at about $150.
B)Vineyard A,because it has one outlier at about $145.
C)Vineyard C,because it has the smallest IQR.
D)Vineyard A,because it has the smallest case price at about $60.
E)Vineyard B,because it has the highest case price at about $120.
A)Vineyard B,because it has the highest case price at about $150.
B)Vineyard A,because it has one outlier at about $145.
C)Vineyard C,because it has the smallest IQR.
D)Vineyard A,because it has the smallest case price at about $60.
E)Vineyard B,because it has the highest case price at about $120.
Question
Shown below are the boxplot and summary statistics for the heights,in centimetres,of a class of Grade 3 students in Halifax,NS. 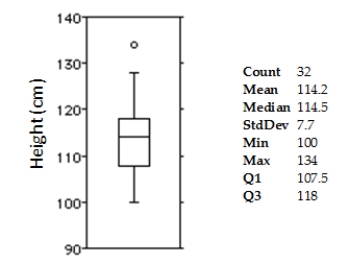
Which measures of centre and spread would you use for this distribution?
A)Median and standard deviation,because the outlier affects the mean.
B)Mean and standard deviation,because the outlier affects the mean.
C)Mean and IQR,because the outlier does not really affect the mean.
D)Median and IQR,because the outlier significantly affects the mean.
E)Mean and standard deviation,because the outlier does not really affect the mean.
Question
The test scores of 15 students are listed below. 
A)33
B)33,49
C)99
D)33,99
E)None
A)33
B)33,49
C)99
D)33,99
E)None
Question
The boxplots display case prices (in dollars)of white wines produced by three vineyards in south-western Ontario.Describe these wine prices. 
A)Vineyards A and B have about the same average price;the boxplots show similar medians and similar IQRs.Vineyard C has higher prices except for one low outlier,and a more consistent pricing as shown by the smaller IQR.The three distributions are roughly symmetric.
B)Vineyards A and B have different average price,but a similar spread.Vineyard C has lower prices except for one low outlier,and a more consistent pricing as shown by the smaller IQR.
C)Vineyards A and B have about the same average price;the boxplots show similar medians and similar IQRs.Vineyard C has consistently higher prices except for one low outlier,and a more consistent pricing as shown by the larger IQR.
D)Vineyards A and B have about the same average price;the boxplots show similar medians and similar IQRs.Vineyard C has higher prices except for one low outlier,and a less consistent pricing as shown by the larger IQR.
E)Vineyards A and B have about the same average price;the boxplots show similar medians and similar IQRs.Vineyard C has higher prices except for one low outlier,and a more consistent pricing as shown by the smaller IQR.
Question
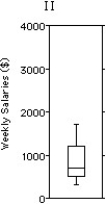
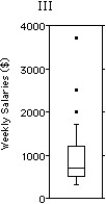
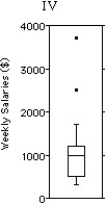
The test scores of 40 students are listed below. 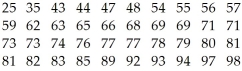
Choose the boxplot that represents the given data.
I II III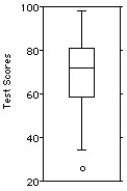
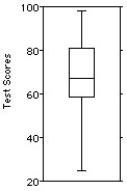
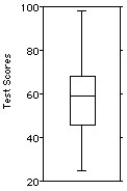
IV V
A)I
B)II
C)III
D)IV
E)V
Choose the boxplot that represents the given data.
I II III
IV V
A)I
B)II
C)III
D)IV
E)V
Question
Here are the average mathematics achievement scores for ninth graders in 34 counties. 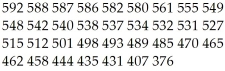
A)376,485,529,555,592
B)376,485,531,549,592
C)376,470,527,549,592
D)376,470,531,549,592
E)376,470,529,549,592
A)376,485,529,555,592
B)376,485,531,549,592
C)376,470,527,549,592
D)376,470,531,549,592
E)376,470,529,549,592
Question
The reaction time of 20 drivers at a stop light was measured,in seconds,as the time between the traffic light turning green and the time it took them to press the gas pedal. 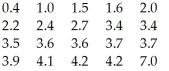
A)0.4,7.0
B)0.4
C)4.2,7.0
D)7.0
E)None
A)0.4,7.0
B)0.4
C)4.2,7.0
D)7.0
E)None
Question
The test scores of 15 students are listed below. 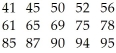
A)41,54,69,86,95
B)41,51.50,72.0,85.5,95
C)41,51.50,69,85.5,95
D)41,52,72.0,87,95
A)41,54,69,86,95
B)41,51.50,72.0,85.5,95
C)41,51.50,69,85.5,95
D)41,52,72.0,87,95
Question
The weights (in kilograms)of 27 dogs are listed below. 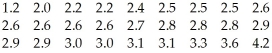
A)1.2,4.2
B)3.6,4.2
C)1.2,2.0
D)1.2,3.6,4.2
E)None
A)1.2,4.2
B)3.6,4.2
C)1.2,2.0
D)1.2,3.6,4.2
E)None
Question
The frequency table shows the weight ,in kilograms,of 120 adults,rounded to the nearest kilogram. 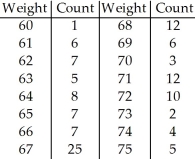
A)60,65,67,70,75 in.
B)60,65,66,70,75 in.
C)60,65,67,71,75 in.
D)60,66,67,70,75 in.
E)60,65,66,71,75 in.
A)60,65,67,70,75 in.
B)60,65,66,70,75 in.
C)60,65,67,71,75 in.
D)60,66,67,70,75 in.
E)60,65,66,71,75 in.
Question
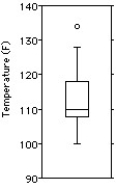
Here are the highest temperatures ever recorded (in °F)in 32 different states in the U.S.A. 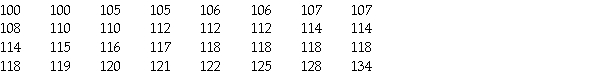
Choose the boxplot that represents the given data.
I II III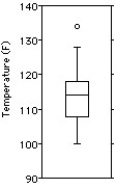
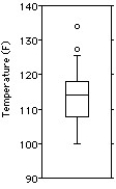
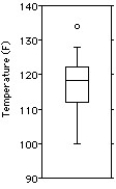
IV V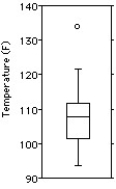
A)I
B)II
C)III
D)IV
E)V
Choose the boxplot that represents the given data.
I II III
IV V
A)I
B)II
C)III
D)IV
E)V
Question
The weights (in pounds)of 30 newborn babies are listed below. 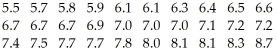
Choose the boxplot that represents the given data.
I II III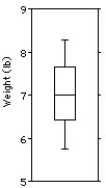
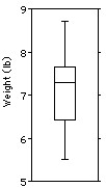
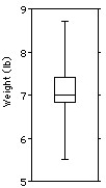
IV V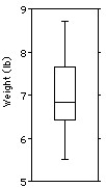
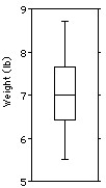
A)I
B)II
C)III
D)IV
E)V
Choose the boxplot that represents the given data.
I II III
IV V
A)I
B)II
C)III
D)IV
E)V
Question
Question
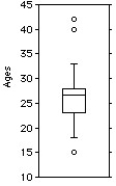
The ages of the 21 members of a track and field team are listed below. 
A)42
B)25
C)15,42
D)40,42
E)None
A)42
B)25
C)15,42
D)40,42
E)None
Question
Here are the test scores of 32 students: 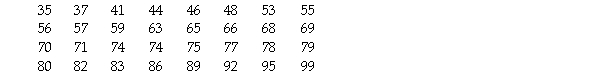
A)35
B)35,99
C)99
D)35,95,99
E)None
A)35
B)35,99
C)99
D)35,95,99
E)None
Question
The heights,in centimetres,of 18 randomly selected Grade 8 students are given below. 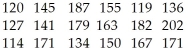
A)114,130.50,150,169.0,202 lb
B)114,130.50,152.5,169.0,202 lb
C)114,134,152.5,171,202 lb
D)114,132.25,150,173.00,202 lb
A)114,130.50,150,169.0,202 lb
B)114,130.50,152.5,169.0,202 lb
C)114,134,152.5,171,202 lb
D)114,132.25,150,173.00,202 lb
Question
The normal annual precipitation (in millimetres)is given below for 21 different cities. 
A)5.1,13.650,22.0,30.500,51.7 in.
B)5.1,14.00,21.05,32.90,51.7 in.
C)5.1,14.7,22.0,31.4,51.7 in.
D)5.1,13.650,21.05,30.500,51.7 in.
A)5.1,13.650,22.0,30.500,51.7 in.
B)5.1,14.00,21.05,32.90,51.7 in.
C)5.1,14.7,22.0,31.4,51.7 in.
D)5.1,13.650,21.05,30.500,51.7 in.
Question
The frequency table shows the weight,in kilograms,of 130 adults,rounded to the nearest kilogram. 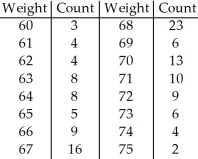
A)60,66,67,70,75 in.
B)60,65.5,68,70,75 in.
C)60,66,67,71,75 in.
D)60,65,68,70,75 in.
E)60,65,68,71,75 in.
A)60,66,67,70,75 in.
B)60,65.5,68,70,75 in.
C)60,66,67,71,75 in.
D)60,65,68,70,75 in.
E)60,65,68,71,75 in.
Question
The weekly salaries (in dollars)of sixteen government workers are listed below. 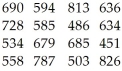
A)451,540,635,718.5,826 dollars
B)451,540,634,718.5,826 dollars
C)451,546,635,709,826 dollars
D)451,534,634,690,826 dollars
A)451,540,635,718.5,826 dollars
B)451,540,634,718.5,826 dollars
C)451,546,635,709,826 dollars
D)451,534,634,690,826 dollars
Question
Here are the average mathematics achievement scores for ninth graders in 32 counties. 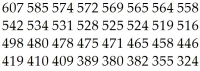
A)324,419,419,542,607
B)324,432.5,507,550,607
C)324,446,507,558,607
D)324,419,516,542,607
E)324,419,507,542,607
A)324,419,419,542,607
B)324,432.5,507,550,607
C)324,446,507,558,607
D)324,419,516,542,607
E)324,419,507,542,607
Question
Shown below are the histogram and summary statistics for the weekly salaries (in dollars)of 24 randomly selected employees of a company: 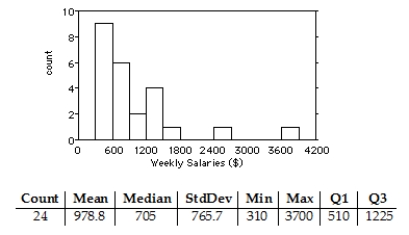
Choose the boxplot that represents the given data.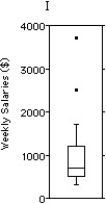
A)I
B)II
C)III
D)IV
E)V
Choose the boxplot that represents the given data.
A)I
B)II
C)III
D)IV
E)V
Question
The weekly salaries (in dollars)of 24 randomly selected employees of a company are shown below. 
A)3700
B)2500
C)310,2500,3700
D)2500,3700
E)None
A)3700
B)2500
C)310,2500,3700
D)2500,3700
E)None
Question
The following data consists of the heights,in centimetres,of 15 randomly selected female high school students and 15 randomly selected male high school students.
Women: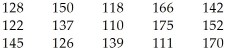
Men: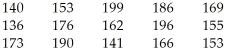
Choose the back-to-back stemplot that represents the given data.
I II III IV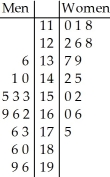
V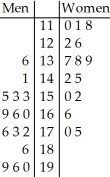
A)I
B)II
C)III
D)IV
E)V
Women:
Men:
Choose the back-to-back stemplot that represents the given data.
I II III IV
V
A)I
B)II
C)III
D)IV
E)V
Question
Here are the heights,in centimetres,of 32 Grade 3 students. 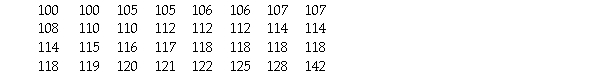
A)142
B)100
C)128,142
D)100,142
E)None
A)142
B)100
C)128,142
D)100,142
E)None
Question
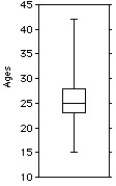
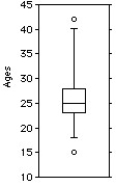
The ages of the 21 members of a track and field team are listed below. 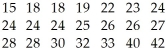
Choose the boxplot that represents the given data.
I II III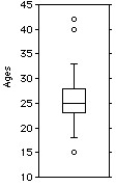
IV V
A)I
B)II
C)III
D)IV
E)V
Choose the boxplot that represents the given data.
I II III
IV V
A)I
B)II
C)III
D)IV
E)V
Question
Question
Here are summary statistics for the time,in minutes,it took for 20 people to complete an information survey at a walk-in medical clinic. 
Write a few sentences about the amount of time these people took to complete the information survey.
A)The 20 times range in length between 0.4 and 7 minutes.The median time is 3.45 minutes,so half are longer and half are shorter.The middle 50% of these times range between 2.1 and 3.8 minutes.The distribution is skewed to the right,with at least the outlier 0.4 minutes.
B)The 20 times range in length between 0.4 and 7 minutes.The median time is 3.23 minutes,so half are longer and half are shorter.The middle 50% of these times range between 2.1 and 3.45 minutes.The distribution is skewed to the right,with at least the outlier 7 minutes.
C)The 20 times range in length between 0.4 and 7 minutes.The median time is 3.45 minutes,so half are longer and half are shorter.The middle 50% of these times range between 2.1 and 3.8 minutes.The distribution is skewed to the right,with no outliers.
D)The 20 times range in length between 0.4 and 7 minutes.The median time is 3.45 minutes,so half are longer and half are shorter.The middle 50% of these times range between 0.4 and 3.8 minutes.The distribution is skewed to the left,with at least the outlier 0.4 minutes.
E)The 20 times range in length between 0.4 and 7 minutes.The median time is 3.45 minutes,so half are longer and half are shorter.The middle 50% of these times range between 2.1 and 3.8 minutes.The distribution is skewed to the left,with at least the outlier 7 minutes.
Question
Question
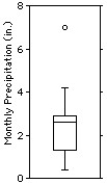
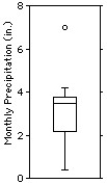
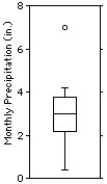
The normal monthly precipitation (in inches)for August is listed for 20 different cities in the U.S.A.. 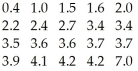
Choose the boxplot that represents the given data.
I II III
IV V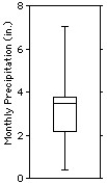
A)I
B)II
C)III
D)IV
E)V
Choose the boxplot that represents the given data.
I II III
IV V
A)I
B)II
C)III
D)IV
E)V
Question
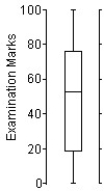
Here is an ogive of the distribution of students' marks on their statistics test. 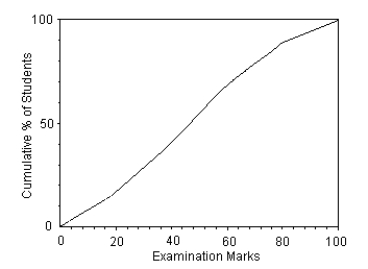
Choose the boxplot that represents the given data.
I II III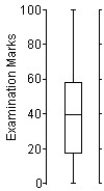
IV V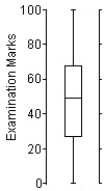
A)I
B)II
C)III
D)IV
E)V
Choose the boxplot that represents the given data.
I II III
IV V
A)I
B)II
C)III
D)IV
E)V
Question
Question
Shown below are the data and summary statistics for the reading scores of 29 fifth graders. 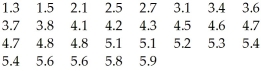

Write a brief summary of the performance of the fifth graders.
A)The distribution is unimodal and skewed to the left.The median is 4.6,while the mean is 4.2,lower than the median score.The middle 50% of the weekly salaries are between 3.6 and 5.2,for an IQR of 1.6.There are no outliers.
B)The distribution is unimodal and skewed to the right.The median is 4.6,while the mean is 4.2,lower than the median score.The middle 50% of the weekly salaries are between 3.6 and 5.2,for an IQR of 1.6.There are no outliers.
C)The distribution is unimodal and skewed to the left.The median is 4.6,while the mean is 4.2,lower than the median score.The middle 50% of the weekly salaries are between 3.6 and 5.2,for an IQR of 1.6.The score of 1.3 is an outlier.
D)The distribution is skewed to the right.The median is 4.2,while the mean is 4.6,higher than the median score.The middle 50% of the weekly salaries are between 3.6 and 5.2,for an IQR of 1.6.There are no outliers.
E)The distribution is unimodal and skewed to the left.The median is 4.2,while the mean is 4.6,higher than the median score.The middle 50% of the weekly salaries are between 3.6 and 5.2,for an IQR of 1.6.There are no outliers.
Question
Question
Question
Here are summary statistics for the time,in minutes,it took for 20 people to complete an information survey at a walk-in medical clinic. 
Would you describe this distribution as symmetric or skewed?
A)Skewed to the left,because the mean is smaller than the median and the upper quartile is farther from the median than the lower quartile.
B)Skewed to the right,because the mean is smaller than the median and the lower quartile is farther from the median than the upper quartile.
C)Symmetric,because the mean and the median are close.
D)Skewed to the right,because the mean is larger than the median and the upper quartile is farther from the median than the lower quartile.
E)Skewed to the left,because the mean is smaller than the median and the lower quartile is farther from the median than the upper quartile.
Question
Shown below are the boxplot,the histogram and summary statistics for the highest temperatures ever recorded (in °F)in 32 different states in the U.S.A. 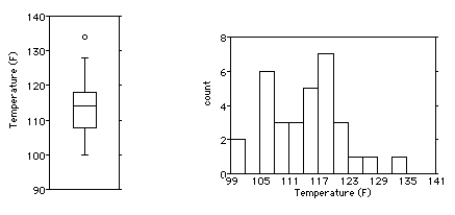

Write a few sentences describing the distribution.
A)The distribution is bimodal,symmetric with a mean of 114.2°F.There is a high outlier that should be investigated.The standard deviation is 7.7°F.The boxplot shows that half of the time,the highest temperatures were between about 107.5°F and 114°F.
B)The distribution is unimodal,symmetric enough with a mean of 114.2°F.There is a high outlier that should be investigated,but it does not influence the mean very much.The standard deviation is 7.7°F.The boxplot shows that half of the time,the highest temperatures were between about 107.5°F and 118°F.
C)The distribution is bimodal,essentially symmetric with a mean of 114.2°F.There is a high outlier that should be investigated,but it does not influence the mean very much.The standard deviation is 7.7°F.The boxplot shows that half of the time,the highest temperature were between about 107.5°F and 118°F.
D)The distribution is unimodal,essentially symmetric with a mean of 114.2°F.There is a high outlier that should be investigated,because it influences the mean.The standard deviation is 7.7°F.The boxplot shows that half of the time,the highest temperatures were between about 107.5°F and 114°F.
E)The distribution is unimodal,essentially symmetric with a mean of 114.2°F.There is a high outlier that should be investigated,but it does not influence the mean very much.The standard deviation is 7.7°F.The boxplot shows that half of the time,the highest temperatures were between about 107.5°F and 114°F.
Question
Here are summary statistics for the time,in minutes,it took 21 students to write a statistics test. 
Would you describe this distribution as symmetric or skewed?
A)Skewed to the right,because the mean is much larger than the median and the upper quartile is farther from the median than the lower quartile.
B)Symmetric,because the mean and the median are close.
C)Skewed to the right,because the mean is much larger than the median and the lower quartile is farther from the median than the upper quartile.
D)Skewed to the left,because the mean is much larger than the median and the lower quartile is farther from the median than the upper quartile.
E)Skewed to the left,because the mean is much larger than the median and the upper quartile is farther from the median than the lower quartile.
Question
Shown below are the boxplot,the histogram and summary statistics for the weights (in pounds)of 30 newborn babies: 

Write a few sentences describing the distribution.
A)The distribution is unimodal and symmetric.There are no outliers.The mean newborn baby weight was 6.9 lb with a standard deviation of 0.8 lb.
B)The distribution is unimodal and symmetric.There are no outliers.The mean newborn baby weight was 7 lb with a standard deviation of 1.3 lb.
C)The distribution is unimodal and skewed to the right.There are no outliers.The mean newborn baby weight was 7 lb with an IQR of 1.3 lb.
D)The distribution is bimodal and symmetric.There are no outliers.The mean newborn baby weight was 6.9 lb with a standard deviation of 0.8 lb.
E)The distribution is unimodal and skewed to the left.There are no outliers.The mean newborn baby weight was 7 lb with an IQR of 1.3 lb.
Question
Here are the summary statistics for mathematics scores for one high-school graduating class. 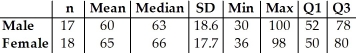
Choose the boxplot that represents the given data.
I II III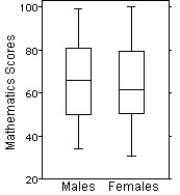

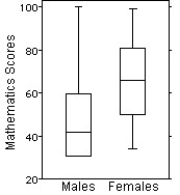
IV V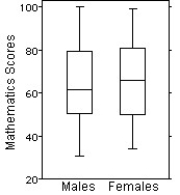
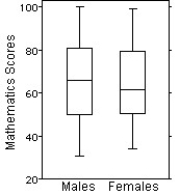
A)I
B)II
C)III
D)IV
E)V
Choose the boxplot that represents the given data.
I II III
IV V
A)I
B)II
C)III
D)IV
E)V
Question
Question
Question
The weekly salaries (in dollars)of 24 randomly selected employees of a company are shown below. 
Choose the boxplot that represents the given data.
I II III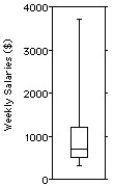
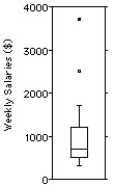

IV V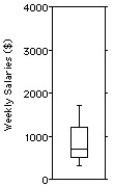
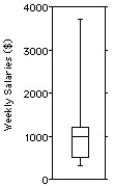
A)I
B)II
C)III
D)IV
E)V
Choose the boxplot that represents the given data.
I II III
IV V
A)I
B)II
C)III
D)IV
E)V
Question
Question
Shown below are the boxplot,the histogram and summary statistics for the weekly salaries (in dollars)of 24 randomly selected employees of a company: 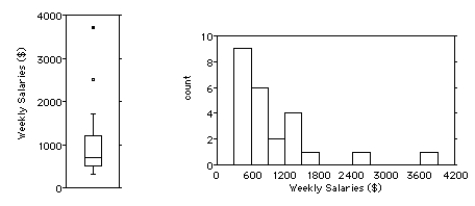

Write a few sentences describing the distribution.
A)The distribution is unimodal and skewed to the right.As shown in the boxplot,there are two outliers,weekly salaries of $2500 and about $3700.The median was 978.8,while the mean was 705,above the median score.The middle 50% of the weekly salaries were between $510 and $1225 for an IQR of $715.
B)The distribution is bimodal and skewed to the right.As shown in the boxplot,there are two outliers,weekly salaries of $2500 and about $3700.The median was 705,while the mean was 978.8,above the median score.The middle 50% of the weekly salaries were between $705 and $1225 for an IQR of $520.
C)The distribution is unimodal and skewed to the left.As shown in the boxplot,there are two outliers,weekly salaries of $2500 and about $3700.The median was 705,while the mean was 978.8,above the median score.The middle 50% of the weekly salaries were between $705 and $1225 for an IQR of $520.
D)The distribution is unimodal and skewed to the right.As shown in the boxplot,there are two outliers,weekly salaries of $2500 and about $3700.The median was 705,while the mean was 978.8,above the median score.The middle 50% of the weekly salaries were between $510 and $1225 for an IQR of $715.
E)The distribution is unimodal and skewed to the left.As shown in the boxplot,there are two outliers,weekly salaries of $2500 and about $3700.The median was 705,while the mean was 978.8,above the median score.The middle 50% of the weekly salaries were between $510 and $1225 for an IQR of $715.

Unlock Deck
Sign up to unlock the cards in this deck!
Unlock Deck
Unlock Deck
1/102
Play
Full screen (f)
Deck 4: Understanding and Comparing Distributions
1
Which class do you think performed better on the test?
A)Class 2,because it has the highest median and 50% of class 2 scored at or above the medians of 1 and 3.
B)Class 3,because 74% of class 3 scored at or above the medians of 1 and 2.
C)Class 1,because it has the smallest median and 70% of class 1 scored at or above the medians of 2 and 3.
D)Class 2,because it has the highest median and 70% of class 2 scored at or above the medians of 1 and 3.
E)Class 2,because it has different mean and median and 70% of class 2 scored at or above the medians of 1 and 3.
Class 2,because it has the highest median and 70% of class 2 scored at or above the medians of 1 and 3.
2
For class 2,compare the mean and the median.
A)Mean is equal to median.
B)Median is lower than mean.
C)Median is higher than mean.
D)Mean is higher than median.
E)No comparison possible
A)Mean is equal to median.
B)Median is lower than mean.
C)Median is higher than mean.
D)Mean is higher than median.
E)No comparison possible
Median is higher than mean.
3
Which class had the largest standard deviation?
A)Class 3,because the shape has the highest number of students.
B)Class 1 or 2,but you can't tell for sure which one.
C)Class 3,because the shape is symmetric.
D)Class 1,because the shape is not perfectly symmetric.
E)None,because the classes had the same standard deviation.
A)Class 3,because the shape has the highest number of students.
B)Class 1 or 2,but you can't tell for sure which one.
C)Class 3,because the shape is symmetric.
D)Class 1,because the shape is not perfectly symmetric.
E)None,because the classes had the same standard deviation.
Class 1 or 2,but you can't tell for sure which one.
4
Three statistics classes (50 students each)took the same test.Shown below are histograms of the scores for the classes.Use the histograms to answer the question.
Which class had the highest median score?
A)Class 2
B)Class 1 and class 3
C)Class 3
D)Class 1
E)None,because the classes had the same median.
Which class had the highest median score?
A)Class 2
B)Class 1 and class 3
C)Class 3
D)Class 1
E)None,because the classes had the same median.
Unlock Deck
Unlock for access to all 102 flashcards in this deck.
Unlock Deck
k this deck
5
How would you describe the shape of each distribution?
A)Class1: left-skewed,spread out ranging from about 40 to 90
Class 2: left-skewed,spread out ranging from about 40 to 90
Class 3: symmetric,spread out ranging from about 40 to 90
B)Class1: fairly symmetric,spread out ranging from about 40 to 90
Class 2: left-skewed,spread out ranging from about 40 to 90
Class 3: asymmetric,spread out ranging from about 40 to 90
C)Class1: left-skewed,spread out ranging from about 40 to 90
Class 2: right-skewed,spread out ranging from about 40 to 90
Class 3: symmetric,spread out ranging from about 40 to 90
D)Class1: fairly symmetric,spread out ranging from about 40 to 90
Class 2: left-skewed,spread out ranging from about 40 to 90
Class 3: symmetric,spread out ranging from about 40 to 90
E)Class1: fairly symmetric,spread out ranging from about 40 to 90
Class 2: right-skewed,spread out ranging from about 40 to 90
Class 3: symmetric,spread out ranging from about 40 to 90
Unlock Deck
Unlock for access to all 102 flashcards in this deck.
Unlock Deck
k this deck
6
The centre for health in a certain country compiles data on the length of stay by patients in short-term hospitals and publishes its statistical findings annually.Data from a sample of 67 male patients and 63 female patients on length of stay (in days)are displayed in the histograms below.
i)What would you suggest be changed about these histograms to make them easier to compare?
ii)Describe these distributions by writing a few sentences comparing the duration of hospitalization for men and women.
Iii)Can you suggest a reason for the peak in women's length of stay?
A)i)They should be put on the same scale,from 0 to 40 days.
Ii)Men have a mode near 1 day,then tapering off from there.Women have a mode near 6 days with a sharp drop afterward.
Iii)A possible reason is childbirth.
B)i)They should be put on the same scale,from 0 to 33 days.
Ii)Men have a mode near 3 days,then tapering off from there.Women have a mode near 8 days with a sharp drop afterward.
Iii)A possible reason is childbirth.
C)i)They should be put on the same scale,from 0 to 25 days.
Ii)Men have a mode near 2 days,then tapering off from there.Women have a mode near 4 days with a sharp drop afterward.
Iii)A possible reason is childbirth.
D)i)They should be put on the same scale,from 0 to 15 days.
Ii)Men have a mode near 3 days,then tapering off from there.Women have a mode near 10 days with a sharp drop afterward.
Iii)A possible reason is childbirth.
E)i)They should be put on the same scale,from 0 to 18 days.
Ii)Men have a mode near 7 days,then tapering off from there.Women have a mode near 1 day with a sharp drop afterward.
Iii)A possible reason is childbirth.
Unlock Deck
Unlock for access to all 102 flashcards in this deck.
Unlock Deck
k this deck
7
The histograms display the body fat percentages of 42 female students and 48 male students taking a college health course.
Compare the distributions (shape,centre,spread,unusual features).
A)The distribution of body fat percentages for men is unimodal and symmetric,with a centre at around 15%.Body fat percentages vary from approximately 6% to 24%.The distribution of body fat percentages for women is unimodal and slightly skewed to the left,with a typical value of 24%.The women's body fat percentages vary from approximately 9% to 33%.In general,the body fat percentages of men are higher than the body fat percentages of women.Additionally,the body fat percentages of men appear more consistent then the body fat percentages for women.
B)The distribution of body fat percentages for men is unimodal and symmetric,with a centre at around 15%.Body fat percentages vary from approximately 6% to 24%.The distribution of body fat percentages for women is unimodal and slightly skewed to the left,with a typical value of 24%.The women's body fat percentages vary from approximately 9% to 33%.In general,the body fat percentages of men are lower than the body fat percentages of women.Additionally,the body fat percentages of women appear more consistent then the body fat percentages for men.
C)The distribution of body fat percentages for men is unimodal and symmetric,with a centre at around 15%.Body fat percentages vary from approximately 6% to 24%.The distribution of body fat percentages for women is unimodal and slightly skewed to the left,with a typical value of 24%.The women's body fat percentages vary from approximately 9% to 33%.In general,the body fat percentages of men are lower than the body fat percentages of women.Additionally,the body fat percentages of men appear more consistent then the body fat percentages for women.
D)The distribution of body fat percentages for men is unimodal and symmetric,with a centre at around 24%.Body fat percentages vary from approximately 6% to 30%.The distribution of body fat percentages for women is unimodal and slightly skewed to the left,with a typical value of 24%.The women's body fat percentages vary from approximately 6% to 30%.In general,the body fat percentages of men and women are the same;however,the body fat percentages of men appear more consistent then the body fat percentages for women.
E)The distribution of body fat percentages for men is unimodal and symmetric,with a centre at around 15%.Body fat percentages vary from approximately 6% to 24%.The distribution of body fat percentages for women is unimodal and slightly skewed to the right,with a typical value of 24%.The women's body fat percentages vary from approximately 9% to 33%.In general,the body fat percentages of men are lower than the body fat percentages of women.Additionally,the body fat percentages of men appear more consistent then the body fat percentages for women.
Unlock Deck
Unlock for access to all 102 flashcards in this deck.
Unlock Deck
k this deck
8
The back-to-back stem-and-leaf display compares the annual precipitation,in millimetres,of of two towns over a period of 14 years.The lower stem contains leaves with the digits 0-4 and the upper stem contains leaves with digits 5-9.
Key:
20 | 7 = 20.7 millimetres
A)The distribution of annual precipitation in Town 1 is bimodal,with one cluster centred around the mid 20s and another cluster in the high 18s.There are two high outliers of 23.1 and 24.3 mm for Town 1.In Town 2,the distribution of annual precipitation is unimodal and skewed right,clustered predominantly between 20.5 and 22.4.There is a low outlier of 18.2 mm for Town 2.The annual precipitation is generally higher and more sporadic in Town 1.
B)The distribution of annual precipitation in Town 1 is bimodal,with one cluster centred around the mid 20s and another cluster in the high 18s.There are two high outliers of 23.1 and 24.3 mm for Town 1.In Town 2,the distribution of annual precipitation is unimodal and skewed right,clustered predominantly between 20.5 and 22.4.There is a low outlier of 18.2 mm for Town 2.The annual precipitation is more consistent in Town 2;but overall,both cities have the same average annual precipitation.
C)The distribution of annual precipitation in Town 1 is bimodal,with one cluster centred around the mid 20s and another cluster in the high 18s.There are two high outliers of 23.1 and 24.3 mm for Town 1.In Town 2,the distribution of annual precipitation is unimodal and skewed left,clustered predominantly between 20.5 and 22.4.There is a low outlier of 18.2 mm for Town 2.The annual precipitation is generally higher and more consistent in Town 2.
D)The distribution of annual precipitation in Town 1 is bimodal,with one cluster centred around the mid 20s and another cluster in the high 18s.In Town 2,the distribution of annual precipitation is unimodal and skewed right,clustered predominantly between 20.5 and 22.4.The annual precipitation is generally higher and more consistent in Town 2.
E)The distribution of annual precipitation in Town 1 is bimodal,with one cluster centred around the mid 20s and another cluster in the high 18s.There are two high outliers of 23.1 and 24.3 mm for Town 1.In Town 2,the distribution of annual precipitation is unimodal and skewed right,clustered predominantly between 20.5 and 22.4.There is a low outlier of 18.2 mm for Town 2.The annual precipitation is generally higher and more consistent in Town 2.
Unlock Deck
Unlock for access to all 102 flashcards in this deck.
Unlock Deck
k this deck
9
Which class had the smallest standard deviation?
A)Class 3,because the shape is symmetric and unimodal.
B)Class 1,because the shape is fairly symmetric and uniform.
C)Class 3,because the shape has the highest number of students.
D)Class 2,because the shape is skewed.
E)None,because the classes had the same standard deviation.
A)Class 3,because the shape is symmetric and unimodal.
B)Class 1,because the shape is fairly symmetric and uniform.
C)Class 3,because the shape has the highest number of students.
D)Class 2,because the shape is skewed.
E)None,because the classes had the same standard deviation.
Unlock Deck
Unlock for access to all 102 flashcards in this deck.
Unlock Deck
k this deck
10
Match each class with the corresponding boxplot below.
A)Class 1 is B
Class 2 is C
Class 3 is A
B)Class 1 is B
Class 2 is A
Class 3 is C
C)Class 1 is A
Class 2 is B
Class 3 is C
D)Class 1 is C
Class 2 is A
Class 3 is B
E)Class 1 is C
Class 2 is B
Class 3 is A
A)Class 1 is B
Class 2 is C
Class 3 is A
B)Class 1 is B
Class 2 is A
Class 3 is C
C)Class 1 is A
Class 2 is B
Class 3 is C
D)Class 1 is C
Class 2 is A
Class 3 is B
E)Class 1 is C
Class 2 is B
Class 3 is A
Unlock Deck
Unlock for access to all 102 flashcards in this deck.
Unlock Deck
k this deck
11
Shown below are the boxplot and the histogram for the weights (in pounds)of 30 newborn babies in the U.S.A..
i.What features of the distribution can you see in both the histogram and the boxplot?
ii.What features of the distribution can you see in the histogram that you could not see in the boxplot?
A)i)The distribution is bimodal and symmetric.There are two outliers at about 5.4 and 8.6.The mean and median values are about the same.
ii.The dip at about 7.4 lb,for example,is apparent only from the histogram.
B)i)The distribution is unimodal and skewed to the right.There are no outliers.The mean is greater than the median.
ii.The dip at about 7.4 lb,for example,is apparent only from the histogram.
C)i)The distribution is unimodal and symmetric.There are two outliers at about 5.4 and 8.6.The mean and median values are about the same.
ii.The dip at about 7.4 lb,for example,is apparent only from the histogram.
D)i)The distribution is unimodal and skewed to the left.There are no outliers.The mean is less than the median.
ii.The dip at about 7.4 lb,for example,is apparent only from the histogram.
E)i)The distribution is unimodal and symmetric.There are no outliers.The mean and median values are about the same.
ii.The dip at about 7.4 lb,for example,is apparent only from the histogram.
Unlock Deck
Unlock for access to all 102 flashcards in this deck.
Unlock Deck
k this deck
12
Three statistics classes (50 students each)took the same test.Shown below are histograms of the scores for the classes.Use the histograms to answer the question.
For which class are the mean and median most different?
A)Class 2,because the shape is symmetric.
B)Class 2,because the shape is skewed to the right.
C)Class 1,because the shape is skewed to the left.
D)Class 3,because the shape is symmetric.
E)Class 2,because the shape is skewed to the left.
For which class are the mean and median most different?
A)Class 2,because the shape is symmetric.
B)Class 2,because the shape is skewed to the right.
C)Class 1,because the shape is skewed to the left.
D)Class 3,because the shape is symmetric.
E)Class 2,because the shape is skewed to the left.
Unlock Deck
Unlock for access to all 102 flashcards in this deck.
Unlock Deck
k this deck
13
Which class had the smallest IQR?
A)Class 1,because the shape is fairly symmetric and uniform.
B)Class 3,because the shape has the highest number of students.
C)Class 2,because the shape is skewed.
D)Class 3,because the shape is symmetric and unimodal.
E)None,because all the classes had the same IQR.
A)Class 1,because the shape is fairly symmetric and uniform.
B)Class 3,because the shape has the highest number of students.
C)Class 2,because the shape is skewed.
D)Class 3,because the shape is symmetric and unimodal.
E)None,because all the classes had the same IQR.
Unlock Deck
Unlock for access to all 102 flashcards in this deck.
Unlock Deck
k this deck
14
Shown below are the boxplot and the histogram for the weekly salaries (in dollars)of 24 randomly selected employees of a company:
i.What features of the distribution can you see in both the histogram and the boxplot?
ii.What features of the distribution can you see in the boxplot that you could not see in the histogram?
A)i)The distribution is unimodal and skewed to the right,with two outliers at $2500 and about $3700.The mean is greater than the median because of the skewedness.
ii.You can more easily tell from the boxplot that the median is about $700 with quartiles at about $500 and $1200.
B)i)The distribution is symmetrical,with two outliers at $2900 and about $3000.The mean and median are about the same.
ii.You can more easily tell from the boxplot that the mean is about $500 with quartiles at about $700 and $1800.
C)i)The distribution is unimodal and skewed to the left,with two outliers at $2500 and about $3700.The mean is lower than the median because of the skewedness.
ii.You can more easily tell from the boxplot that the median is about $900 with quartiles at about $1100 and $1600.
D)i)The distribution is unimodal and skewed to the right,with two outliers at $2900 and about $3000.The mean is greater than the median because of the skewedness.
ii.You can more easily tell from the boxplot that the median is about $700 with quartiles at about $500 and $1200.
E)i)The distribution is symmetrical,with two outliers at $2500 and about $3700.The mean and median are about the same.
ii.You can more easily tell from the boxplot that the mean is about $700 with quartiles at about $500 and $1200.
Unlock Deck
Unlock for access to all 102 flashcards in this deck.
Unlock Deck
k this deck
15
Describe what these boxplots tell you about the relationship between the provinces and salary,based on the same occupation.
A)ON and BC have very comparable salaries.The average salaries for these provinces are just above $40K,and their spreads are very close.NS is very comparable to ON and BC.The upper 50% of salaries for NS corresponds to the lower 50% of QC salaries.
B)ON and BC have very comparable salaries.The average salaries for these provinces are just below $40K,but their spreads are different.NS is not very comparable to either ON and BC.The upper 50% of salaries for NS corresponds to the lower 50% of QC salaries.
C)ON and BC don't have very comparable salaries.The average salaries for these provinces are just below $40K,and their spreads are different.NS is not very comparable to either ON and BC.The upper 50% of salaries for QC corresponds to the lower 50% of NS salaries.
D)ON and BC have very comparable salaries.The average salaries for these provinces are just below $40K,and their spreads are very close.NS's average is the highest.The upper 50% of salaries for NS corresponds to the lower 50% of QC salaries.
E)ON and BC have very comparable salaries.The average salaries for these provinces are just below $40K,and their spreads are very close.NS is not very comparable to either ON or BC.The upper 50% of salaries for NS corresponds to the lower 50% of QC salaries.
Unlock Deck
Unlock for access to all 102 flashcards in this deck.
Unlock Deck
k this deck
16
Do men and women run a 5-kilometre race at the same pace? Here are boxplots of the time (in minutes)for a race recently run in Victoria,B.C..Write a brief report discussing what these data show.
A)Women appear to run about 3 minutes faster than men,but the two distributions are very similar in shape and spread.
B)Men appear to run about 3 minutes faster than women,but the two distributions are very similar in shape and spread.
C)Women appear to run about 3 minutes faster than men,and the two distributions have different IQR.
D)Men appear to run about 3 minutes faster than women,and the two distributions have different IQR.
E)Men appear to run about 10 minutes faster than women,but the two distributions are very similar in shape and spread.
Unlock Deck
Unlock for access to all 102 flashcards in this deck.
Unlock Deck
k this deck
17
Three statistics classes (50 students each)took the same test.Shown below are histograms of the scores for the classes.Use the histograms to answer the question.
Which class had the highest mean score?
A)Class 3
B)Class 2
C)Class 1
D)Class 1 and class 3
E)None,because the classes had the same mean.
Which class had the highest mean score?
A)Class 3
B)Class 2
C)Class 1
D)Class 1 and class 3
E)None,because the classes had the same mean.
Unlock Deck
Unlock for access to all 102 flashcards in this deck.
Unlock Deck
k this deck
18
Shown below are the boxplot and the histogram for the highest temperatures ever recorded (in °F)in 32 different states in the U.S.A.
i)What features of the distribution can you see in both the histogram and the boxplot?
ii)What features of the distribution can you see in the histogram that you could not see in the boxplot?
A)i)The distribution is highly skewed to the right,with two outliers at 128°F and 134°F.Most high temperatures are between 105°F and 129°F.
ii)When looking at the histogram,the distribution appears to be bimodal.This is not obvious from the boxplot.
B)i)The distribution is highly skewed to the left,with an outlier at 134°F.Most high temperatures are between 108°F and 130°F.
ii)When looking at the histogram,the distribution appears to be bimodal.This is not obvious from the boxplot.
C)i)The distribution is fairly symmetric,with no outliers.Most high temperatures are between 99°F and 117°F.
ii)When looking at the histogram,the distribution appears to be bimodal.This is not obvious from the boxplot.
D)i)The distribution is highly skewed to the right,with an outlier at 134°F.Most high temperatures are between 105°F and 129°F.
ii)When looking at the histogram,the distribution appears to be bimodal.This is not obvious from the boxplot.
E)i)The distribution is fairly symmetric,with an outlier at 134°F (although this value is only obvious from the boxplot).Most high temperatures are between 107°F and 118°F.
ii)When looking at the histogram,the distribution appears to be bimodal.This is not obvious from the boxplot.
Unlock Deck
Unlock for access to all 102 flashcards in this deck.
Unlock Deck
k this deck
19
The histograms show the cost of living,in dollars,for 32 Canadian cities.The histogram on the left shows the cost of living for the 32 cities using bins $10 wide,and the histogram on the right displays the same data using bins that are $6 wide.
Compare the distributions (shape,centre,spread,unusual features).
A)The distribution in the left histogram of the cost of living in the 32 Canadian cities is unimodal and skewed to the right.The distribution is centred around $100,and spread out,with values ranging from $80 to $140.The distribution in the right histogram appears bimodal,with many cities costing just under $104 and another smaller cluster around $119.There also appears to be an outlier in the right histogram at $134 that was not apparent in the histogram on the left.
B)The distribution in the left histogram of the cost of living in the 32 Canadian cities is unimodal and skewed to the right.The distribution is centred around $100,and spread out,with values ranging from $80 to $140.The distribution in the right histogram is unimodal and symmetric.The distribution is centred around $104,and spread out,with values ranging from $86 to $140.There also appears to be an outlier in the right histogram at $134 that was not apparent in the histogram on the left.
C)The distribution in the left histogram of the cost of living in the 32 Canadian cities is unimodal and skewed to the left.The distribution is centred around $100,and spread out,with values ranging from $80 to $140.The distribution in the right histogram appears bimodal,with many cities costing just under $104 and another smaller cluster around $119.There also appears to be an outlier in the right histogram at $134 that was not apparent in the histogram on the left.
D)The distribution in the left histogram of the cost of living in the 32 Canadian cities is unimodal and skewed to the right.The distribution is centred around $100,and spread out,with values ranging from $80 to $140.The distribution in the right histogram is also unimodal and skewed to the right.The distribution is centred around $104,and spread out,with values ranging from $86 to $140.There also appears to be an outlier in the right histogram at $134 that was not apparent in the histogram on the left.
E)The distribution in the left histogram of the cost of living in the 32 Canadian cities is unimodal and skewed to the right.The distribution is centred around $100,and spread out,with values ranging from $80 to $140.The distribution in the right histogram appears bimodal,with many cities costing just under $104 and another smaller cluster around $119.
Unlock Deck
Unlock for access to all 102 flashcards in this deck.
Unlock Deck
k this deck
20
The back-to-back stem-and-leaf display compares the percent growth in sales for a retail chain's stores located in two regions of Canada.The lower stem contains leaves with the digits 0-4 and the upper stem contains leaves with digits 5-9.
Key:
3 | 5 = 35% sales growth
A)The distribution of sales growth in Region 1 stores is unimodal,symmetric and tightly clustered around 35% growth.The distribution of sales growth in Region 2 stores is much more spread out,with most stores having sales growth between 5% and 35%.A typical Region 2 store had about 15% growth.There were two outliers,one store with 58% growth and another with 65% growth.Generally,the sales growth rates in the Region 2 stores were higher and more variable than the rates in the Region 1 stores.
B)The distribution of sales growth in the Region 1 stores is unimodal,symmetric and tightly clustered around 35% growth.The distribution of sales growth in Region 2 stores is much more spread out,with most stores having sales growth between 5% and 35%.A typical Region 2 store had about 15% growth.There were two outliers,one store with 58% growth and another with 65% growth.Generally,the sales growth rates in the Region 1 stores were higher and less variable than the rates in the Region 2 stores.
C)The distribution of sales growth in Region 1 stores is unimodal,symmetric and tightly clustered around 35% growth.The distribution of sales growth in Region 2 stores is much more spread out,with most stores having sales growth between 5% and 35%.A typical Region 2 store had about 15% growth.There were two outliers,one store with 58% growth and another with 65% growth.Generally,the sales growth rates in the Region 1 stores were higher and more variable than the rates in the Region 2 stores.
D)The distribution of sales growth in Region 1 stores is unimodal,symmetric and tightly clustered around 45% growth.The distribution of sales growth in Region 2 stores is much more spread out,with most stores having sales growth between 5% and 35%.A typical Region 2 store had about 25% growth.There were two outliers,one store with 58% growth and another with 65% growth.Generally,the sales growth rates in the Region 2 stores were higher and more variable than the rates in the Region 1 stores.
E)The distribution of sales growth in Region 1 stores is unimodal,symmetric and tightly clustered around 45% growth.The distribution of sales growth in Region 2 stores is much more spread out,with most stores having sales growth between 5% and 35%.A typical Region 2 store had about 25% growth.There were two outliers,one store with 58% growth and another with 65% growth.Generally,the sales growth rates in the Region 1 stores were higher and less variable than the rates in the Region 2 stores.
Unlock Deck
Unlock for access to all 102 flashcards in this deck.
Unlock Deck
k this deck
21
The weekly salaries (in dollars)of 24 randomly selected employees of a company are shown below,and displayed on the following boxplot.
Find the mean and the median.Which is the most appropriate measure of centre?
A)Mean: $979;Median: $705
The median is the most appropriate measure of centre,because the outliers are not significant in the distribution.
B)Mean: $942;Median: $700
The median is the most appropriate measure of centre,because of the outliers.
C)Mean: $979;Median: $705
The mean is the most appropriate measure of centre,because the outliers are not significant in the distribution.
D)Mean: $979;Median: $705
The median is the most appropriate measure of centre,because of the outliers.
E)Mean: $979;Median: $705
The mean is the most appropriate measure of centre,because of the outliers.
Unlock Deck
Unlock for access to all 102 flashcards in this deck.
Unlock Deck
k this deck
22
The weekly salaries (in dollars)of sixteen government workers are listed below.
A)352,986
B)611
C)352
D)1086
E)None
A)352,986
B)611
C)352
D)1086
E)None
Unlock Deck
Unlock for access to all 102 flashcards in this deck.
Unlock Deck
k this deck
23
Here is the stem-and-leaf display of the midterm test scores for a high school typing class.
Would you use the median or the mean to describe the centre of this distribution?
A)Mean,because the data are quite symmetric.
B)Mean,because the data are skewed to the right.
C)Median,because the data are skewed to the left.
D)Mean,because the data are skewed to the left.
E)Median,because the data are skewed to the right.
Unlock Deck
Unlock for access to all 102 flashcards in this deck.
Unlock Deck
k this deck
24
Here are boxplots of the points scored during the first 10 games of the basketball season for both Caroline and Alexandra.Summarize the similarities and differences in their performance so far.
A)Both girls have a median score of about 18 points per game.Alexandra is much more consistent,because her IQR is about 15 points,while Caroline's is over 3.
B)The girls have a different average score per game,but the same median score of about 18 points per game.Their IQR are different,but this does not give anymore information on the girls' performance.
C)Both girls have a median score of about 18 points per game.Caroline is much more consistent,because her IQR is about 6 points,while Alexandra's is over 20.
D)The girls have a different average score per game.Caroline is much more consistent,because her IQR is about 4 points,while Alexandra's is over 15.
E)Both girls have a median score of about 18 points per game.Caroline is much more consistent,because her IQR is about 4 points,while Alexandra's is over 15.
Unlock Deck
Unlock for access to all 102 flashcards in this deck.
Unlock Deck
k this deck
25
Shown below are the histogram and summary statistics for the reading scores of 29 fifth graders.
Which measures of centre and spread would you use for this distribution?
A)Mean and standard deviation,because the data is symmetric.
B)Median and IQR,because the data is skewed to the left.
C)Mean and standard deviation,because the data is skewed to the left.
D)Mean and IQR,because the data is skewed to the left.
E)Median and standard deviation,because the data is skewed to the left.
Unlock Deck
Unlock for access to all 102 flashcards in this deck.
Unlock Deck
k this deck
26
The boxplots display case prices (in dollars)of white wines produced by three vineyards in south-western Ontario.In which vineyard are the wines generally more expensive?
A)Vineyards A and B,because they have a similar average price,and roughly the same spread.
B)Vineyard C,because it has the highest average price and the smallest spread.
C)Vineyard C,because it has the smallest range.
D)Vineyard B,because it has the highest case price at about $150.
E)Vineyard A,because it has one outlier at about $145.
Unlock Deck
Unlock for access to all 102 flashcards in this deck.
Unlock Deck
k this deck
27
The weekly salaries (in dollars)of 24 randomly selected employees of a company are shown below,and displayed on the following boxplot.
Find the IQR and the standard deviation.Which is the most appropriate measure of spread?
A)IQR: $789.3;standard deviation: $740
The IQR is the most appropriate measure of centre,because of the outliers.
B)IQR: $715;standard deviation: $769
The standard deviation is the most appropriate measure of centre,because of the outliers.
C)IQR: $715;standard deviation: $769
The standard deviation is the most appropriate measure of centre,because the outliers are not significant in the distribution.
D)IQR: $715;standard deviation: $769
The IQR is the most appropriate measure of centre,because the outliers are not significant in the distribution.
E)IQR: $715;standard deviation: $769
The IQR is the most appropriate measure of centre,because of the outliers.
Unlock Deck
Unlock for access to all 102 flashcards in this deck.
Unlock Deck
k this deck
28
Office workers were asked how long it took them,in minutes,to travel to work one morning.Here is the stem-and-leaf display.
Would you use the median or the mean to describe the centre of this distribution?
A)Mean,because the data are skewed to the right.
B)Mean,because the data are skewed to the left.
C)Mean,because the data are symmetric.
D)Median,because the data are skewed to the right.
E)Median,because the data are skewed to the left.
Unlock Deck
Unlock for access to all 102 flashcards in this deck.
Unlock Deck
k this deck
29
The boxplots display case prices (in dollars)of white wines produced by three vineyards in south-western Ontario.Which vineyard produces the cheapest wine?
A)Vineyard C,because it has the smallest range.
B)Vineyard B,because it does not have any outliers.
C)Vineyard C,because it has the smallest IQR.
D)Vineyard B,because it has the highest case price at about $150.
E)Vineyard A,because it has the smallest case price at about $60.
A)Vineyard C,because it has the smallest range.
B)Vineyard B,because it does not have any outliers.
C)Vineyard C,because it has the smallest IQR.
D)Vineyard B,because it has the highest case price at about $150.
E)Vineyard A,because it has the smallest case price at about $60.
Unlock Deck
Unlock for access to all 102 flashcards in this deck.
Unlock Deck
k this deck
30
The times,in minutes,it took for 21 students to finish writing a statistics test are given below.
A)8.0,60.9,64.5
B)60.9,64.5
C)64.5
D)24.6
E)None
A)8.0,60.9,64.5
B)60.9,64.5
C)64.5
D)24.6
E)None
Unlock Deck
Unlock for access to all 102 flashcards in this deck.
Unlock Deck
k this deck
31
Here are summary statistics of the last four digits of the credit card number of 500 customers,corresponding to the following histogram.
Is the mean or median a "better" summary of the centre of the distribution?
A)Median,because the IQR is smaller than the standard deviation.
B)Median,because of the outliers.
C)Mean,because the distribution is quite symmetric.
D)Neither,because these are not categorical data.
E)Neither,because these are not quantitative data.
Unlock Deck
Unlock for access to all 102 flashcards in this deck.
Unlock Deck
k this deck
32
Here are 3 boxplots of weekly gas prices at a service station in the U.S.A.(price in $ per gallon).Compare the distribution of prices over the three years.
A)Gas price have been increasing on average over the 3-year period,but the spread has been decreasing.The distribution has been skewed to the left,and there were 3 high outliers in 2005.
B)Gas price have been increasing on average over the 3-year period,and the spread has been increasing as well.The distribution has been skewed to the right,and there were 3 high outliers in 2005.
C)Gas price have been decreasing on average over the 3-year period,and the spread has been decreasing.The distribution has been skewed to the left,and there were 3 high outliers in 2005.
D)Gas price have been decreasing on average over the 3-year period,but the spread has been increasing.The distribution has been skewed to the right,and there were 3 high outliers in 2005.
E)Gas price have been increasing on average over the 3-year period,and the spread has been increasing as well.The distribution has been skewed to the left,and there were 3 high outliers in 2005.
Unlock Deck
Unlock for access to all 102 flashcards in this deck.
Unlock Deck
k this deck
33
The Ontario Ministry of Education collects data on the number of years of teaching experience of high school teachers.A sample taken this year of 19 high school teachers yielded the following data on number of years of teaching experience.
A)33,37
B)1
C)1,33,37
D)1,37
E)None
A)33,37
B)1
C)1,33,37
D)1,37
E)None
Unlock Deck
Unlock for access to all 102 flashcards in this deck.
Unlock Deck
k this deck
34
Here are boxplots of the points scored during the first 10 games of the basketball season for both Caroline and Alexandra.The coach can take only one player to the state championship.Which one should she take knowing that she would like a safe player?
A)Alexandra,because she is the more consistent player.
B)Both of them,because both girls have a median score of about 18 points per game.
C)Caroline,because she is the more consistent player.
D)Caroline,because the IQR is the largest.
E)Alexandra,because the IQR is the largest.
A)Alexandra,because she is the more consistent player.
B)Both of them,because both girls have a median score of about 18 points per game.
C)Caroline,because she is the more consistent player.
D)Caroline,because the IQR is the largest.
E)Alexandra,because the IQR is the largest.
Unlock Deck
Unlock for access to all 102 flashcards in this deck.
Unlock Deck
k this deck
35
Office workers were asked how long it took them,in minutes,to travel to work one morning.Here is the stem-and-leaf display.
Without actually finding the mean and the median,would you expect the mean to be higher or lower than the median?
A)Lower,because the data are skewed to the left.
B)Higher,because the data are skewed to the left.
C)Lower,because the data are skewed to the right.
D)Higher,because the data are skewed to the right.
E)Neither,because the mean would be equal to the median.
Unlock Deck
Unlock for access to all 102 flashcards in this deck.
Unlock Deck
k this deck
36
Here are the summary statistics for mathematics scores for one high school graduating class,and the parallel boxplots comparing the scores of male and female students.Write a brief report on these results.Be sure to discuss shape,centre,and spread of the scores.
A)Median score by females at 66 points is 3 points higher than that by males,and female mean is higher by 5.The middle 50% for both group is close with a IQR at 26 for the males and 30 for the females.The males have a larger range from 30 to 100.The distribution is right-skewed for the females and symmetric for the males.
B)Median score by females at 66 points is 3 points higher than that by males,and female mean is higher by 5.The middle 50% for both group is close with a IQR at 26 for the males and 30 for the females.The males have a larger range from 30 to 100.Both distributions are right-skewed.
C)Median score by females at 66 points is 3 points higher than that by males,and female mean is higher by 5.The middle 50% for both group is close with a IQR at 26 for the males and 30 for the females.The males have a larger range from 30 to 100.The distribution is right-skewed for the males and symmetric for the females.
D)Median score by females at 66 points is 3 points higher than that by males,and male mean is higher by 5.The middle 50% for both group is close with a IQR at 30 for the males and 26 for the females.The males have a larger range from 30 to 100.The distribution is right-skewed for the males and symmetric for the females.
E)Median score by females at 66 points is 3 points higher than that by males,and female mean is higher by 5.The middle 50% for both group is close with a IQR at 26 for the males and 30 for the females.The males have a smaller range from 30 to 100.Both distributions are left-skewed.
Unlock Deck
Unlock for access to all 102 flashcards in this deck.
Unlock Deck
k this deck
37
The boxplots display case prices (in dollars)of white wines produced by three vineyards in south-western Ontario.Which vineyard produces the most expensive wine?
A)Vineyard B,because it has the highest case price at about $150.
B)Vineyard A,because it has one outlier at about $145.
C)Vineyard C,because it has the smallest IQR.
D)Vineyard A,because it has the smallest case price at about $60.
E)Vineyard B,because it has the highest case price at about $120.
A)Vineyard B,because it has the highest case price at about $150.
B)Vineyard A,because it has one outlier at about $145.
C)Vineyard C,because it has the smallest IQR.
D)Vineyard A,because it has the smallest case price at about $60.
E)Vineyard B,because it has the highest case price at about $120.
Unlock Deck
Unlock for access to all 102 flashcards in this deck.
Unlock Deck
k this deck
38
Shown below are the boxplot and summary statistics for the heights,in centimetres,of a class of Grade 3 students in Halifax,NS.
Which measures of centre and spread would you use for this distribution?
A)Median and standard deviation,because the outlier affects the mean.
B)Mean and standard deviation,because the outlier affects the mean.
C)Mean and IQR,because the outlier does not really affect the mean.
D)Median and IQR,because the outlier significantly affects the mean.
E)Mean and standard deviation,because the outlier does not really affect the mean.
Unlock Deck
Unlock for access to all 102 flashcards in this deck.
Unlock Deck
k this deck
39
The test scores of 15 students are listed below.
A)33
B)33,49
C)99
D)33,99
E)None
A)33
B)33,49
C)99
D)33,99
E)None
Unlock Deck
Unlock for access to all 102 flashcards in this deck.
Unlock Deck
k this deck
40
The boxplots display case prices (in dollars)of white wines produced by three vineyards in south-western Ontario.Describe these wine prices.
A)Vineyards A and B have about the same average price;the boxplots show similar medians and similar IQRs.Vineyard C has higher prices except for one low outlier,and a more consistent pricing as shown by the smaller IQR.The three distributions are roughly symmetric.
B)Vineyards A and B have different average price,but a similar spread.Vineyard C has lower prices except for one low outlier,and a more consistent pricing as shown by the smaller IQR.
C)Vineyards A and B have about the same average price;the boxplots show similar medians and similar IQRs.Vineyard C has consistently higher prices except for one low outlier,and a more consistent pricing as shown by the larger IQR.
D)Vineyards A and B have about the same average price;the boxplots show similar medians and similar IQRs.Vineyard C has higher prices except for one low outlier,and a less consistent pricing as shown by the larger IQR.
E)Vineyards A and B have about the same average price;the boxplots show similar medians and similar IQRs.Vineyard C has higher prices except for one low outlier,and a more consistent pricing as shown by the smaller IQR.
Unlock Deck
Unlock for access to all 102 flashcards in this deck.
Unlock Deck
k this deck
41
The test scores of 40 students are listed below.
Choose the boxplot that represents the given data.
I II III
IV V
A)I
B)II
C)III
D)IV
E)V
Choose the boxplot that represents the given data.
I II III
IV V
A)I
B)II
C)III
D)IV
E)V
Unlock Deck
Unlock for access to all 102 flashcards in this deck.
Unlock Deck
k this deck
42
Here are the average mathematics achievement scores for ninth graders in 34 counties.
A)376,485,529,555,592
B)376,485,531,549,592
C)376,470,527,549,592
D)376,470,531,549,592
E)376,470,529,549,592
A)376,485,529,555,592
B)376,485,531,549,592
C)376,470,527,549,592
D)376,470,531,549,592
E)376,470,529,549,592
Unlock Deck
Unlock for access to all 102 flashcards in this deck.
Unlock Deck
k this deck
43
The reaction time of 20 drivers at a stop light was measured,in seconds,as the time between the traffic light turning green and the time it took them to press the gas pedal.
A)0.4,7.0
B)0.4
C)4.2,7.0
D)7.0
E)None
A)0.4,7.0
B)0.4
C)4.2,7.0
D)7.0
E)None
Unlock Deck
Unlock for access to all 102 flashcards in this deck.
Unlock Deck
k this deck
44
The test scores of 15 students are listed below.
A)41,54,69,86,95
B)41,51.50,72.0,85.5,95
C)41,51.50,69,85.5,95
D)41,52,72.0,87,95
A)41,54,69,86,95
B)41,51.50,72.0,85.5,95
C)41,51.50,69,85.5,95
D)41,52,72.0,87,95
Unlock Deck
Unlock for access to all 102 flashcards in this deck.
Unlock Deck
k this deck
45
The weights (in kilograms)of 27 dogs are listed below.
A)1.2,4.2
B)3.6,4.2
C)1.2,2.0
D)1.2,3.6,4.2
E)None
A)1.2,4.2
B)3.6,4.2
C)1.2,2.0
D)1.2,3.6,4.2
E)None
Unlock Deck
Unlock for access to all 102 flashcards in this deck.
Unlock Deck
k this deck
46
The frequency table shows the weight ,in kilograms,of 120 adults,rounded to the nearest kilogram.
A)60,65,67,70,75 in.
B)60,65,66,70,75 in.
C)60,65,67,71,75 in.
D)60,66,67,70,75 in.
E)60,65,66,71,75 in.
A)60,65,67,70,75 in.
B)60,65,66,70,75 in.
C)60,65,67,71,75 in.
D)60,66,67,70,75 in.
E)60,65,66,71,75 in.
Unlock Deck
Unlock for access to all 102 flashcards in this deck.
Unlock Deck
k this deck
47
Here are the highest temperatures ever recorded (in °F)in 32 different states in the U.S.A.
Choose the boxplot that represents the given data.
I II III
IV V
A)I
B)II
C)III
D)IV
E)V
Choose the boxplot that represents the given data.
I II III
IV V
A)I
B)II
C)III
D)IV
E)V
Unlock Deck
Unlock for access to all 102 flashcards in this deck.
Unlock Deck
k this deck
48
The weights (in pounds)of 30 newborn babies are listed below.
Choose the boxplot that represents the given data.
I II III
IV V
A)I
B)II
C)III
D)IV
E)V
Choose the boxplot that represents the given data.
I II III
IV V
A)I
B)II
C)III
D)IV
E)V
Unlock Deck
Unlock for access to all 102 flashcards in this deck.
Unlock Deck
k this deck
49
A small company employs a supervisor at $1,300 a week,an inventory manager at $900 a week,5 stock boys at $400 a week,and 3 drivers at $500 a week.
A)1,300,400,450,500,400 dollars
B)400,400,450,500,1,300 dollars
C)400,400,900,500,1,300 dollars
D)2,000,400,450,1,500,1,300 dollars
E)400,400,450,900,1,300 dollars
A)1,300,400,450,500,400 dollars
B)400,400,450,500,1,300 dollars
C)400,400,900,500,1,300 dollars
D)2,000,400,450,1,500,1,300 dollars
E)400,400,450,900,1,300 dollars
Unlock Deck
Unlock for access to all 102 flashcards in this deck.
Unlock Deck
k this deck
50
The ages of the 21 members of a track and field team are listed below.
A)42
B)25
C)15,42
D)40,42
E)None
A)42
B)25
C)15,42
D)40,42
E)None
Unlock Deck
Unlock for access to all 102 flashcards in this deck.
Unlock Deck
k this deck
51
Here are the test scores of 32 students:
A)35
B)35,99
C)99
D)35,95,99
E)None
A)35
B)35,99
C)99
D)35,95,99
E)None
Unlock Deck
Unlock for access to all 102 flashcards in this deck.
Unlock Deck
k this deck
52
The heights,in centimetres,of 18 randomly selected Grade 8 students are given below.
A)114,130.50,150,169.0,202 lb
B)114,130.50,152.5,169.0,202 lb
C)114,134,152.5,171,202 lb
D)114,132.25,150,173.00,202 lb
A)114,130.50,150,169.0,202 lb
B)114,130.50,152.5,169.0,202 lb
C)114,134,152.5,171,202 lb
D)114,132.25,150,173.00,202 lb
Unlock Deck
Unlock for access to all 102 flashcards in this deck.
Unlock Deck
k this deck
53
The normal annual precipitation (in millimetres)is given below for 21 different cities.
A)5.1,13.650,22.0,30.500,51.7 in.
B)5.1,14.00,21.05,32.90,51.7 in.
C)5.1,14.7,22.0,31.4,51.7 in.
D)5.1,13.650,21.05,30.500,51.7 in.
A)5.1,13.650,22.0,30.500,51.7 in.
B)5.1,14.00,21.05,32.90,51.7 in.
C)5.1,14.7,22.0,31.4,51.7 in.
D)5.1,13.650,21.05,30.500,51.7 in.
Unlock Deck
Unlock for access to all 102 flashcards in this deck.
Unlock Deck
k this deck
54
The frequency table shows the weight,in kilograms,of 130 adults,rounded to the nearest kilogram.
A)60,66,67,70,75 in.
B)60,65.5,68,70,75 in.
C)60,66,67,71,75 in.
D)60,65,68,70,75 in.
E)60,65,68,71,75 in.
A)60,66,67,70,75 in.
B)60,65.5,68,70,75 in.
C)60,66,67,71,75 in.
D)60,65,68,70,75 in.
E)60,65,68,71,75 in.
Unlock Deck
Unlock for access to all 102 flashcards in this deck.
Unlock Deck
k this deck
55
The weekly salaries (in dollars)of sixteen government workers are listed below.
A)451,540,635,718.5,826 dollars
B)451,540,634,718.5,826 dollars
C)451,546,635,709,826 dollars
D)451,534,634,690,826 dollars
A)451,540,635,718.5,826 dollars
B)451,540,634,718.5,826 dollars
C)451,546,635,709,826 dollars
D)451,534,634,690,826 dollars
Unlock Deck
Unlock for access to all 102 flashcards in this deck.
Unlock Deck
k this deck
56
Here are the average mathematics achievement scores for ninth graders in 32 counties.
A)324,419,419,542,607
B)324,432.5,507,550,607
C)324,446,507,558,607
D)324,419,516,542,607
E)324,419,507,542,607
A)324,419,419,542,607
B)324,432.5,507,550,607
C)324,446,507,558,607
D)324,419,516,542,607
E)324,419,507,542,607
Unlock Deck
Unlock for access to all 102 flashcards in this deck.
Unlock Deck
k this deck
57
Shown below are the histogram and summary statistics for the weekly salaries (in dollars)of 24 randomly selected employees of a company:
Choose the boxplot that represents the given data.
A)I
B)II
C)III
D)IV
E)V
Choose the boxplot that represents the given data.
A)I
B)II
C)III
D)IV
E)V
Unlock Deck
Unlock for access to all 102 flashcards in this deck.
Unlock Deck
k this deck
58
The weekly salaries (in dollars)of 24 randomly selected employees of a company are shown below.
A)3700
B)2500
C)310,2500,3700
D)2500,3700
E)None
A)3700
B)2500
C)310,2500,3700
D)2500,3700
E)None
Unlock Deck
Unlock for access to all 102 flashcards in this deck.
Unlock Deck
k this deck
59
The following data consists of the heights,in centimetres,of 15 randomly selected female high school students and 15 randomly selected male high school students.
Women:
Men:
Choose the back-to-back stemplot that represents the given data.
I II III IV
V
A)I
B)II
C)III
D)IV
E)V
Women:
Men:
Choose the back-to-back stemplot that represents the given data.
I II III IV
V
A)I
B)II
C)III
D)IV
E)V
Unlock Deck
Unlock for access to all 102 flashcards in this deck.
Unlock Deck
k this deck
60
Here are the heights,in centimetres,of 32 Grade 3 students.
A)142
B)100
C)128,142
D)100,142
E)None
A)142
B)100
C)128,142
D)100,142
E)None
Unlock Deck
Unlock for access to all 102 flashcards in this deck.
Unlock Deck
k this deck
61
The ages of the 21 members of a track and field team are listed below.
Choose the boxplot that represents the given data.
I II III
IV V
A)I
B)II
C)III
D)IV
E)V
Choose the boxplot that represents the given data.
I II III
IV V
A)I
B)II
C)III
D)IV
E)V
Unlock Deck
Unlock for access to all 102 flashcards in this deck.
Unlock Deck
k this deck
62
A local ice cream shop hand scoops each of its ice cream cones.The cones vary in weight from 126 grams to 291 grams with a mean of 181 grams and a standard deviation of 34 grams.The quartiles and median weights are 157,255,and 202 ounces.A customer makes a special order of a 448 ounce cone.
Which of the summary statistics might not change if that data value was added to the distribution?
A)Median,range
B)Range,SD
C)Q1,Q3
D)Mean,IQR
E)Median,IQR
Which of the summary statistics might not change if that data value was added to the distribution?
A)Median,range
B)Range,SD
C)Q1,Q3
D)Mean,IQR
E)Median,IQR
Unlock Deck
Unlock for access to all 102 flashcards in this deck.
Unlock Deck
k this deck
63
Here are summary statistics for the time,in minutes,it took for 20 people to complete an information survey at a walk-in medical clinic.
Write a few sentences about the amount of time these people took to complete the information survey.
A)The 20 times range in length between 0.4 and 7 minutes.The median time is 3.45 minutes,so half are longer and half are shorter.The middle 50% of these times range between 2.1 and 3.8 minutes.The distribution is skewed to the right,with at least the outlier 0.4 minutes.
B)The 20 times range in length between 0.4 and 7 minutes.The median time is 3.23 minutes,so half are longer and half are shorter.The middle 50% of these times range between 2.1 and 3.45 minutes.The distribution is skewed to the right,with at least the outlier 7 minutes.
C)The 20 times range in length between 0.4 and 7 minutes.The median time is 3.45 minutes,so half are longer and half are shorter.The middle 50% of these times range between 2.1 and 3.8 minutes.The distribution is skewed to the right,with no outliers.
D)The 20 times range in length between 0.4 and 7 minutes.The median time is 3.45 minutes,so half are longer and half are shorter.The middle 50% of these times range between 0.4 and 3.8 minutes.The distribution is skewed to the left,with at least the outlier 0.4 minutes.
E)The 20 times range in length between 0.4 and 7 minutes.The median time is 3.45 minutes,so half are longer and half are shorter.The middle 50% of these times range between 2.1 and 3.8 minutes.The distribution is skewed to the left,with at least the outlier 7 minutes.
Unlock Deck
Unlock for access to all 102 flashcards in this deck.
Unlock Deck
k this deck
64
The freethrow percentages for participants in a basketball tournament were compiled.The percents ranged from 31% to 91% with a mean of 63% and a standard deviation of 6%.The quartiles and median percentages were 41%,79%,and 63%.Suppose one participant did not make any of his attempted freethrows (0%).Which of the summary statistics might not change if that data value was added to the distribution?
A)Median,range
B)Q1,Q3
C)Range,SD
D)Mean,IQR
E)Median,IQR
A)Median,range
B)Q1,Q3
C)Range,SD
D)Mean,IQR
E)Median,IQR
Unlock Deck
Unlock for access to all 102 flashcards in this deck.
Unlock Deck
k this deck
65
The normal monthly precipitation (in inches)for August is listed for 20 different cities in the U.S.A..
Choose the boxplot that represents the given data.
I II III
IV V
A)I
B)II
C)III
D)IV
E)V
Choose the boxplot that represents the given data.
I II III
IV V
A)I
B)II
C)III
D)IV
E)V
Unlock Deck
Unlock for access to all 102 flashcards in this deck.
Unlock Deck
k this deck
66
Here is an ogive of the distribution of students' marks on their statistics test.
Choose the boxplot that represents the given data.
I II III
IV V
A)I
B)II
C)III
D)IV
E)V
Choose the boxplot that represents the given data.
I II III
IV V
A)I
B)II
C)III
D)IV
E)V
Unlock Deck
Unlock for access to all 102 flashcards in this deck.
Unlock Deck
k this deck
67
A local ice cream shop hand scoops each of its ice cream cones.The cones vary in weight from 120 grams to 216 grams with a mean of 181 grams and a standard deviation of 34 grams.The quartiles and median weights are 146,244,and 202 grams.
Is the distribution symmetric,skewed to the left,or skewed to the right? Explain.
A)Skewed to the left,mean higher than median.
B)Skewed to the right,mean higher than median.
C)Symmetric,mean lower than median.
D)Skewed to the right,mean lower than median.
E)Skewed to the left,mean lower than median.
Unlock Deck
Unlock for access to all 102 flashcards in this deck.
Unlock Deck
k this deck
68
Shown below are the data and summary statistics for the reading scores of 29 fifth graders.
Write a brief summary of the performance of the fifth graders.
A)The distribution is unimodal and skewed to the left.The median is 4.6,while the mean is 4.2,lower than the median score.The middle 50% of the weekly salaries are between 3.6 and 5.2,for an IQR of 1.6.There are no outliers.
B)The distribution is unimodal and skewed to the right.The median is 4.6,while the mean is 4.2,lower than the median score.The middle 50% of the weekly salaries are between 3.6 and 5.2,for an IQR of 1.6.There are no outliers.
C)The distribution is unimodal and skewed to the left.The median is 4.6,while the mean is 4.2,lower than the median score.The middle 50% of the weekly salaries are between 3.6 and 5.2,for an IQR of 1.6.The score of 1.3 is an outlier.
D)The distribution is skewed to the right.The median is 4.2,while the mean is 4.6,higher than the median score.The middle 50% of the weekly salaries are between 3.6 and 5.2,for an IQR of 1.6.There are no outliers.
E)The distribution is unimodal and skewed to the left.The median is 4.2,while the mean is 4.6,higher than the median score.The middle 50% of the weekly salaries are between 3.6 and 5.2,for an IQR of 1.6.There are no outliers.
Unlock Deck
Unlock for access to all 102 flashcards in this deck.
Unlock Deck
k this deck
69
Here are some statistics for the annual Wildcat golf tournament:
Lowest score = 57
Mean score = 97
Median = 105
Range = 93
IQR = 109
Q1 = 39
Standard deviation = 14
Between what two values are the middle 50% of the scores found?
A)26.25 and 78.75
B)39 and 148
C)97 and 105
D)57 and 150
E)24.25 and 67.9
Lowest score = 57
Mean score = 97
Median = 105
Range = 93
IQR = 109
Q1 = 39
Standard deviation = 14
Between what two values are the middle 50% of the scores found?
A)26.25 and 78.75
B)39 and 148
C)97 and 105
D)57 and 150
E)24.25 and 67.9
Unlock Deck
Unlock for access to all 102 flashcards in this deck.
Unlock Deck
k this deck
70
Here are some summary statistics for all of the runners in a local 12 kilometre race:
Slowest time = 121 minutes
Mean = 76 minutes
Median = 76 minutes
Range = 91 minutes
IQR = 57
Q1 = 30
Standard deviation = 13 minutes
Between what two values are the middle 50% of times?
A)30 and 87
B)38 and 76
C)15.2 and 60.8
D)19 and 57
E)121 and 30
Slowest time = 121 minutes
Mean = 76 minutes
Median = 76 minutes
Range = 91 minutes
IQR = 57
Q1 = 30
Standard deviation = 13 minutes
Between what two values are the middle 50% of times?
A)30 and 87
B)38 and 76
C)15.2 and 60.8
D)19 and 57
E)121 and 30
Unlock Deck
Unlock for access to all 102 flashcards in this deck.
Unlock Deck
k this deck
71
Here are summary statistics for the time,in minutes,it took for 20 people to complete an information survey at a walk-in medical clinic.
Would you describe this distribution as symmetric or skewed?
A)Skewed to the left,because the mean is smaller than the median and the upper quartile is farther from the median than the lower quartile.
B)Skewed to the right,because the mean is smaller than the median and the lower quartile is farther from the median than the upper quartile.
C)Symmetric,because the mean and the median are close.
D)Skewed to the right,because the mean is larger than the median and the upper quartile is farther from the median than the lower quartile.
E)Skewed to the left,because the mean is smaller than the median and the lower quartile is farther from the median than the upper quartile.
Unlock Deck
Unlock for access to all 102 flashcards in this deck.
Unlock Deck
k this deck
72
Shown below are the boxplot,the histogram and summary statistics for the highest temperatures ever recorded (in °F)in 32 different states in the U.S.A.
Write a few sentences describing the distribution.
A)The distribution is bimodal,symmetric with a mean of 114.2°F.There is a high outlier that should be investigated.The standard deviation is 7.7°F.The boxplot shows that half of the time,the highest temperatures were between about 107.5°F and 114°F.
B)The distribution is unimodal,symmetric enough with a mean of 114.2°F.There is a high outlier that should be investigated,but it does not influence the mean very much.The standard deviation is 7.7°F.The boxplot shows that half of the time,the highest temperatures were between about 107.5°F and 118°F.
C)The distribution is bimodal,essentially symmetric with a mean of 114.2°F.There is a high outlier that should be investigated,but it does not influence the mean very much.The standard deviation is 7.7°F.The boxplot shows that half of the time,the highest temperature were between about 107.5°F and 118°F.
D)The distribution is unimodal,essentially symmetric with a mean of 114.2°F.There is a high outlier that should be investigated,because it influences the mean.The standard deviation is 7.7°F.The boxplot shows that half of the time,the highest temperatures were between about 107.5°F and 114°F.
E)The distribution is unimodal,essentially symmetric with a mean of 114.2°F.There is a high outlier that should be investigated,but it does not influence the mean very much.The standard deviation is 7.7°F.The boxplot shows that half of the time,the highest temperatures were between about 107.5°F and 114°F.
Unlock Deck
Unlock for access to all 102 flashcards in this deck.
Unlock Deck
k this deck
73
Here are summary statistics for the time,in minutes,it took 21 students to write a statistics test.
Would you describe this distribution as symmetric or skewed?
A)Skewed to the right,because the mean is much larger than the median and the upper quartile is farther from the median than the lower quartile.
B)Symmetric,because the mean and the median are close.
C)Skewed to the right,because the mean is much larger than the median and the lower quartile is farther from the median than the upper quartile.
D)Skewed to the left,because the mean is much larger than the median and the lower quartile is farther from the median than the upper quartile.
E)Skewed to the left,because the mean is much larger than the median and the upper quartile is farther from the median than the lower quartile.
Unlock Deck
Unlock for access to all 102 flashcards in this deck.
Unlock Deck
k this deck
74
Shown below are the boxplot,the histogram and summary statistics for the weights (in pounds)of 30 newborn babies:
Write a few sentences describing the distribution.
A)The distribution is unimodal and symmetric.There are no outliers.The mean newborn baby weight was 6.9 lb with a standard deviation of 0.8 lb.
B)The distribution is unimodal and symmetric.There are no outliers.The mean newborn baby weight was 7 lb with a standard deviation of 1.3 lb.
C)The distribution is unimodal and skewed to the right.There are no outliers.The mean newborn baby weight was 7 lb with an IQR of 1.3 lb.
D)The distribution is bimodal and symmetric.There are no outliers.The mean newborn baby weight was 6.9 lb with a standard deviation of 0.8 lb.
E)The distribution is unimodal and skewed to the left.There are no outliers.The mean newborn baby weight was 7 lb with an IQR of 1.3 lb.
Unlock Deck
Unlock for access to all 102 flashcards in this deck.
Unlock Deck
k this deck
75
Here are the summary statistics for mathematics scores for one high-school graduating class.
Choose the boxplot that represents the given data.
I II III
IV V
A)I
B)II
C)III
D)IV
E)V
Choose the boxplot that represents the given data.
I II III
IV V
A)I
B)II
C)III
D)IV
E)V
Unlock Deck
Unlock for access to all 102 flashcards in this deck.
Unlock Deck
k this deck
76
Here are the summary statistics for the monthly payroll for an accounting firm:
Lowest salary = $15,000
Mean salary = $35,000
Median = $25,000
Range = $60,000
IQR = $30,000
First quartile = $17,500
Standard deviation = $20,000
Do you think the distribution of salaries is symmetric,skewed to the left,or skewed to the right? Explain why.
A)Skewed to the left;mean is lower than median.
B)Skewed to the right;mean is higher than median.
C)Symmetric,mean is higher than median.
D)Skewed to the left,mean is higher than median.
E)Skewed to the right,mean is lower than median.
Unlock Deck
Unlock for access to all 102 flashcards in this deck.
Unlock Deck
k this deck
77
The speed vehicles travelled on a local road was recorded for one month.The speeds ranged from 52 km/h to 67 km/h with a mean speed of 56 km/h and a standard deviation of 7 km/h.The quartiles and median speeds were 55 km/h,64 km/h,and 53 km/h.Suppose during the month,one driver was clocked at 25 km/h.
Which of the summary statistics might not change if that data value was added to the distribution?
A)Q1,Q3
B)Median,range
C)Median,IQR
D)Mean,IQR
E)Range,SD
Which of the summary statistics might not change if that data value was added to the distribution?
A)Q1,Q3
B)Median,range
C)Median,IQR
D)Mean,IQR
E)Range,SD
Unlock Deck
Unlock for access to all 102 flashcards in this deck.
Unlock Deck
k this deck
78
The weekly salaries (in dollars)of 24 randomly selected employees of a company are shown below.
Choose the boxplot that represents the given data.
I II III
IV V
A)I
B)II
C)III
D)IV
E)V
Choose the boxplot that represents the given data.
I II III
IV V
A)I
B)II
C)III
D)IV
E)V
Unlock Deck
Unlock for access to all 102 flashcards in this deck.
Unlock Deck
k this deck
79
Here are some summary statistics for all of the runners in a local 12 kilometre race:
Slowest time = 124 minutes
Mean = 85 minutes
Median = 85 minutes
Range = 94 minutes
IQR = 56
Q1 = 34
Standard deviation = 13 minutes
Is the distribution symmetric,skewed to the left,or skewed to the right? Explain.
A)Skewed to the right,mean higher than median.
B)Symmetric,mean same as median.
C)Skewed to the right,mean lower than median.
D)Skewed to the left,mean higher than median.
E)Skewed to the left,mean lower than median.
Unlock Deck
Unlock for access to all 102 flashcards in this deck.
Unlock Deck
k this deck
80
Shown below are the boxplot,the histogram and summary statistics for the weekly salaries (in dollars)of 24 randomly selected employees of a company:
Write a few sentences describing the distribution.
A)The distribution is unimodal and skewed to the right.As shown in the boxplot,there are two outliers,weekly salaries of $2500 and about $3700.The median was 978.8,while the mean was 705,above the median score.The middle 50% of the weekly salaries were between $510 and $1225 for an IQR of $715.
B)The distribution is bimodal and skewed to the right.As shown in the boxplot,there are two outliers,weekly salaries of $2500 and about $3700.The median was 705,while the mean was 978.8,above the median score.The middle 50% of the weekly salaries were between $705 and $1225 for an IQR of $520.
C)The distribution is unimodal and skewed to the left.As shown in the boxplot,there are two outliers,weekly salaries of $2500 and about $3700.The median was 705,while the mean was 978.8,above the median score.The middle 50% of the weekly salaries were between $705 and $1225 for an IQR of $520.
D)The distribution is unimodal and skewed to the right.As shown in the boxplot,there are two outliers,weekly salaries of $2500 and about $3700.The median was 705,while the mean was 978.8,above the median score.The middle 50% of the weekly salaries were between $510 and $1225 for an IQR of $715.
E)The distribution is unimodal and skewed to the left.As shown in the boxplot,there are two outliers,weekly salaries of $2500 and about $3700.The median was 705,while the mean was 978.8,above the median score.The middle 50% of the weekly salaries were between $510 and $1225 for an IQR of $715.
Unlock Deck
Unlock for access to all 102 flashcards in this deck.
Unlock Deck
k this deck
Unlock Deck
Unlock for access to all 102 flashcards in this deck.


