Exam 4: Understanding and Comparing Distributions
Exam 1: Data30 Questions
Exam 2: Displaying and Describing Categorical Data65 Questions
Exam 3: Displaying and Summarizing Quantitative Data93 Questions
Exam 4: Understanding and Comparing Distributions102 Questions
Exam 5: The Standard Deviation As a Ruler and the Normal Model131 Questions
Exam 6: Scatterplots, association, and Correlation74 Questions
Exam 7: Linear Regression57 Questions
Exam 8: Regression Wisdom32 Questions
Exam 9: Re-Expressing Data: Get It Straight51 Questions
Exam 10: Understanding Randomness26 Questions
Exam 11: Sample Surveys50 Questions
Exam 12: Experiments and Observational Surveys87 Questions
Exam 13: From Randomness to Probability64 Questions
Exam 14: Probability Rules90 Questions
Exam 15: Random Variables112 Questions
Exam 16: Probability Models114 Questions
Exam 17: Sampling Distribution Models45 Questions
Exam 18: Confidence Intervals for Proportions56 Questions
Exam 19: Testing Hypotheses About Proportions50 Questions
Exam 20: More About Tests69 Questions
Exam 21: Comparing Two Proportions52 Questions
Exam 22: Inferences About Means106 Questions
Exam 23: Comparing Means43 Questions
Exam 24: Paired Samples and Blocks33 Questions
Exam 25: Comparing Counts78 Questions
Exam 26: Inferences for Regression51 Questions
Exam 27: Analysis of Variance39 Questions
Exam 28: Multifactor Analysis of Variance22 Questions
Exam 29: Multiple Regression22 Questions
Exam 30: Multiple Regression Wisdom21 Questions
Exam 31: Rank-Based Nonparametric Tests29 Questions
Exam 32: The Bootstrap31 Questions
Select questions type
The ages of the 21 members of a track and field team are listed below. 
Free
(Multiple Choice)
5.0/5  (38)
(38)
Correct Answer: Verified
D
A local ice cream shop hand scoops each of its ice cream cones.The cones vary in weight from 120 grams to 216 grams with a mean of 181 grams and a standard deviation of 34 grams.The quartiles and median weights are 146,244,and 202 grams.
Is the distribution symmetric,skewed to the left,or skewed to the right? Explain.
Free
(Multiple Choice)
4.7/5 (34)
Correct Answer:Verified
E
Shown below are the histogram and summary statistics for the reading scores of 29 fifth graders. 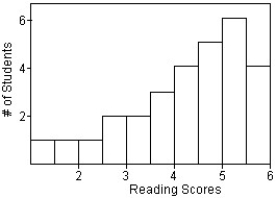
 Which measures of centre and spread would you use for this distribution?
Free
(Multiple Choice)
4.8/5 (34)
Correct Answer:Verified
B
The frequency table shows the weight,in kilograms,of 130 adults,rounded to the nearest kilogram. 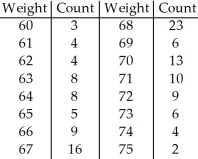
(Multiple Choice)
4.7/5 (32)
The reaction time of 20 drivers at a stop light was measured,in seconds,as the time between the traffic light turning green and the time it took them to press the gas pedal. 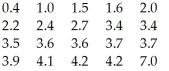
(Multiple Choice)
4.8/5 (30)
Three statistics classes (50 students each)took the same test.Shown below are histograms of the scores for the classes.Use the histograms to answer the question. 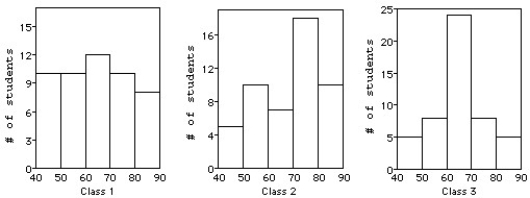 -For which class are the mean and median most different?
(Multiple Choice)
4.8/5 (39)
Here is a histogram of the assets (in millions of dollars)of 71 companies.What aspect of this distribution makes it difficult to summarize,or to discuss,the centre and spread? What could be done with these data to make it easier to discuss the distribution? 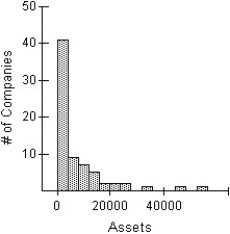
(Multiple Choice)
5.0/5 (46)
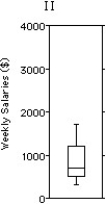
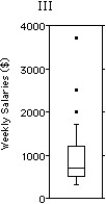
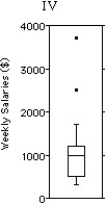
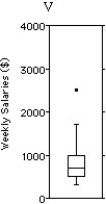
Shown below are the histogram and summary statistics for the weekly salaries (in dollars)of 24 randomly selected employees of a company: 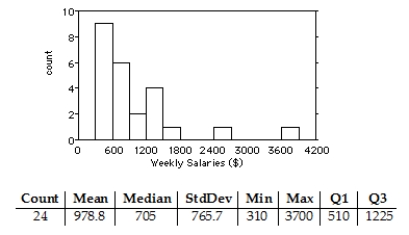 Choose the boxplot that represents the given data.
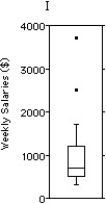
(Multiple Choice)
4.9/5 (34)
The histograms show the cost of living,in dollars,for 32 Canadian cities.The histogram on the left shows the cost of living for the 32 cities using bins $10 wide,and the histogram on the right displays the same data using bins that are $6 wide. 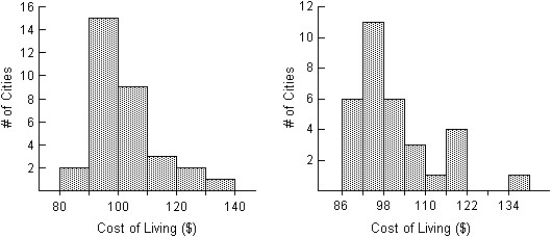 Compare the distributions (shape,centre,spread,unusual features).
(Multiple Choice)
4.8/5 (33)
Here are the summary statistics for the monthly payroll for an accounting firm:
Lowest salary = $15,000
Mean salary = $35,000
Median = $25,000
Range = $60,000
IQR = $30,000
First quartile = $17,500
Standard deviation = $20,000
Do you think the distribution of salaries is symmetric,skewed to the left,or skewed to the right? Explain why.
(Multiple Choice)
4.7/5 (32)
Office workers were asked how long it took them,in minutes,to travel to work one morning.Here is the stem-and-leaf display. 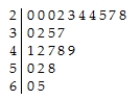 Would you use the median or the mean to describe the centre of this distribution?
(Multiple Choice)
4.8/5 (32)
The back-to-back stem-and-leaf display compares the percent growth in sales for a retail chain's stores located in two regions of Canada.The lower stem contains leaves with the digits 0-4 and the upper stem contains leaves with digits 5-9. 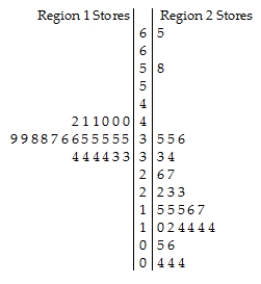 Key:
3 | 5 = 35% sales growth
Key:
3 | 5 = 35% sales growth
(Multiple Choice)
4.9/5 (31)
Here are summary statistics of the last four digits of the credit card number of 500 customers,corresponding to the following histogram. 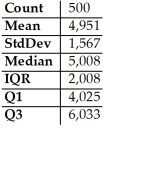
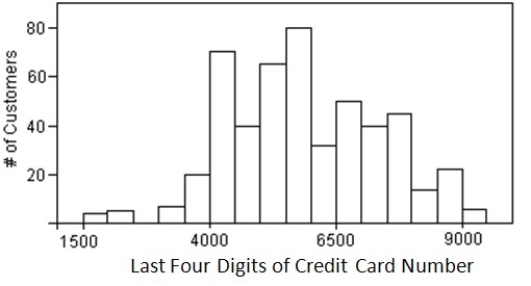 Is the mean or median a "better" summary of the centre of the distribution?
(Multiple Choice)
4.8/5 (39)
The boxplots display case prices (in dollars)of white wines produced by three vineyards in south-western Ontario.Which vineyard produces the cheapest wine? 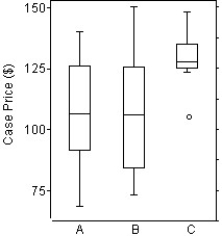
(Multiple Choice)
4.8/5 (33)
Shown below are the boxplot,the histogram and summary statistics for the weekly salaries (in dollars)of 24 randomly selected employees of a company: 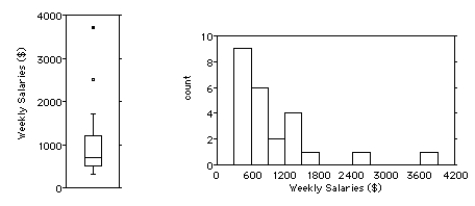
 Write a few sentences describing the distribution.
(Multiple Choice)
4.8/5 (36)
The speed vehicles travelled on a local road was recorded for one month.The speeds ranged from 52 km/h to 67 km/h with a mean speed of 56 km/h and a standard deviation of 7 km/h.The quartiles and median speeds were 55 km/h,64 km/h,and 53 km/h.Suppose during the month,one driver was clocked at 25 km/h.
Which of the summary statistics might not change if that data value was added to the distribution?
(Multiple Choice)
4.9/5 (34)
Here are summary statistics for the time,in minutes,it took 21 students to write a statistics test.  Would you describe this distribution as symmetric or skewed?
(Multiple Choice)
4.9/5 (34)
Three statistics classes (50 students each)took the same test.Shown below are histograms of the scores for the classes.Use the histograms to answer the question.
-Which class had the highest mean score?
(Multiple Choice)
4.9/5 (30)
The following stem-and-leaf display shows the number of homeless cats and dogs that had to be euthanized each year in a large city for the period 1985-2004. 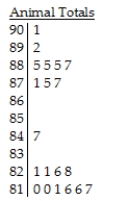 Key:
87 | 5 = 87,500 cats and dogs euthanized
Key:
87 | 5 = 87,500 cats and dogs euthanized
(Multiple Choice)
4.9/5 (38)
A business owner recorded her annual profits for the first 12 years since opening her business.The stem-and-leaf display below shows the annual profits in thousands of dollars. 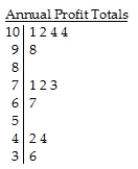 Key:
9 | 8 = $98,000 profit
Key:
9 | 8 = $98,000 profit
(Multiple Choice)
4.9/5 (42)
Filters
- Essay(0)
- Multiple Choice(0)
- Short Answer(0)
- True False(0)
- Matching(0)