Deck 6: Scatterplots, association, and Correlation
Full screen (f)
Question
Question
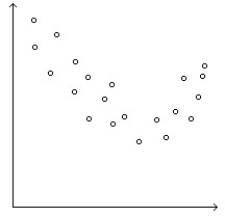
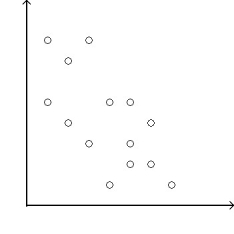
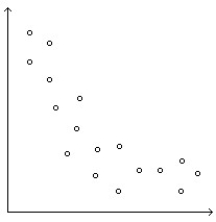
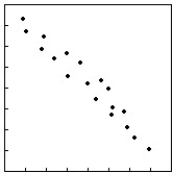
Determine whether the scatterplot shows little or no association, a negative association, a linear association, a moderately strong association, or a very strong association (multiple associations are possible).
A)Little or no association
B)Positive association,moderately strong association
C)Negative association,linear association
D)Moderately strong non-linear association
E)Negative association,moderately strong association
A)Little or no association
B)Positive association,moderately strong association
C)Negative association,linear association
D)Moderately strong non-linear association
E)Negative association,moderately strong association
Question
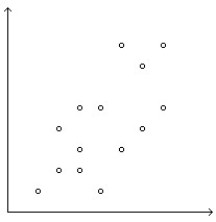
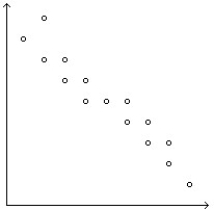
Determine whether the scatterplot shows little or no association, a negative association, a linear association, a moderately strong association, or a very strong association (multiple associations are possible).
A)Positive association
B)Positive association,linear association,moderately strong association
C)Moderately strong association
D)Linear association,moderately strong association
E)Little or no association
A)Positive association
B)Positive association,linear association,moderately strong association
C)Moderately strong association
D)Linear association,moderately strong association
E)Little or no association
Question
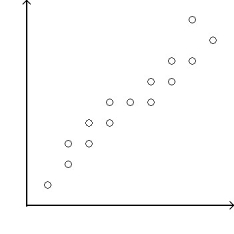
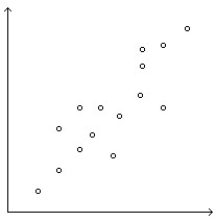
Determine whether the scatterplot shows little or no association, a negative association, a linear association, a moderately strong association, or a very strong association (multiple associations are possible).
A)Positive association,linear association
B)Positive association,moderately strong association
C)Positive association,linear association,very strong association
D)Linear association,very strong association
E)Linear association,moderately strong association
A)Positive association,linear association
B)Positive association,moderately strong association
C)Positive association,linear association,very strong association
D)Linear association,very strong association
E)Linear association,moderately strong association
Question
Question
Question
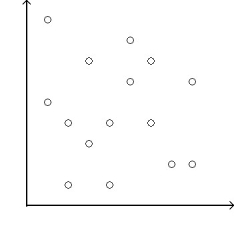
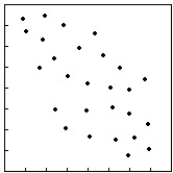
Determine whether the scatterplot shows little or no association, a negative association, a linear association, a moderately strong association, or a very strong association (multiple associations are possible).
A)Negative association,linear association
B)Positive association,moderately strong association
C)Little or no association
D)Negative association,moderately strong association
E)Positive association,linear association
A)Negative association,linear association
B)Positive association,moderately strong association
C)Little or no association
D)Negative association,moderately strong association
E)Positive association,linear association
Question
Question
Question
Question
Question
Question
Question
Question
Determine whether the scatterplot shows little or no association, a negative association, a linear association, a moderately strong association, or a very strong association (multiple associations are possible).
A)Negative association
B)Moderately strong association
C)Linear association,moderately strong association
D)Negative association,linear association,moderate association
E)Little or no association
A)Negative association
B)Moderately strong association
C)Linear association,moderately strong association
D)Negative association,linear association,moderate association
E)Little or no association
Question
Question
Determine whether the scatterplot shows little or no association, a negative association, a linear association, a moderately strong association, or a very strong association (multiple associations are possible).
A)Linear association,moderately strong association
B)Linear association,very strong association
C)Negative association,linear association,very strong association
D)Negative association,moderately strong association
E)Negative association,linear association
A)Linear association,moderately strong association
B)Linear association,very strong association
C)Negative association,linear association,very strong association
D)Negative association,moderately strong association
E)Negative association,linear association
Question
Question
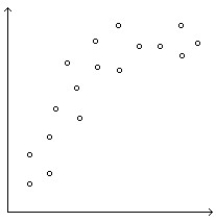
Determine whether the scatterplot shows little or no association, a negative association, a linear association, a moderately strong association, or a very strong association (multiple associations are possible).
A)Linear association,moderately strong association
B)Positive association
C)Linear association
D)Positive association,moderately strong association,linear association
E)Positive association,moderately strong association
A)Linear association,moderately strong association
B)Positive association
C)Linear association
D)Positive association,moderately strong association,linear association
E)Positive association,moderately strong association
Question
Question
The owner of a small manufacturing plant employs nine people.As part of their personnel file,he asked each one to record the distance,in km,they travel one way from home to work and the time it takes in minutes. 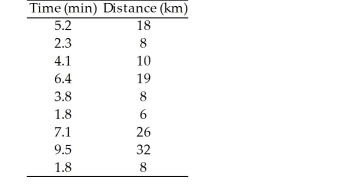
Question
A shop owner tries to predict the winter collection sales by displaying coat sales (in dollars)and the outside temperature (in degrees Fahrenheit)in the following scatterplot.Make a histogram of the coat sales. 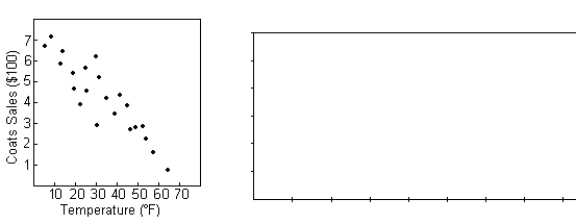
Question
A study was conducted to compare the average time spent in the lab each week versus course grade for computer students.The results are recorded in the table below. 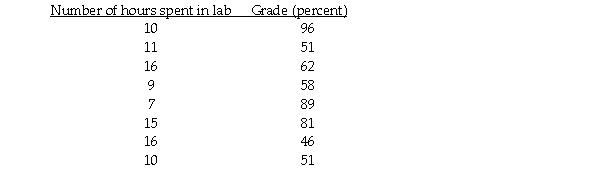
A)-0.284
B)-0.335
C)0.371
D)0.462
E)0.017
A)-0.284
B)-0.335
C)0.371
D)0.462
E)0.017
Question
Owners of a new computer store tracked sales (in thousands)for the first 12 days,and displayed the data in a scatterplot.Make a histogram of the daily sales since the shop has been in business. 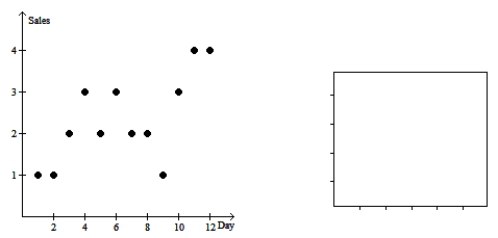
Question
Below are the Olympic gold medal performances in the men's high jump from 1960 to 1984. 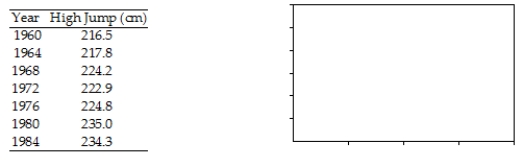
Question
Determine whether the scatterplot shows little or no association, a negative association, a linear association, a moderately strong association, or a very strong association (multiple associations are possible).
A)Linear association,moderately strong association
B)Positive association,linear association
C)Moderately strong association
D)Linear association
E)Little or no association
A)Linear association,moderately strong association
B)Positive association,linear association
C)Moderately strong association
D)Linear association
E)Little or no association
Question
Two different tests are designed to measure employee productivity and dexterity.Several employees are randomly selected and tested with these results. 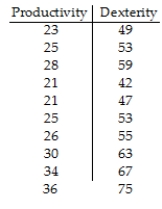
A)-0.280
B)0.986
C)0.159
D)0.471
E)0.115
A)-0.280
B)0.986
C)0.159
D)0.471
E)0.115
Question
A survey was conducted in 26 counties to determine the percentage of teenagers who had used marijuana and other drugs.Data are displayed in the following scatterplot.Make a histogram of the other drugs. 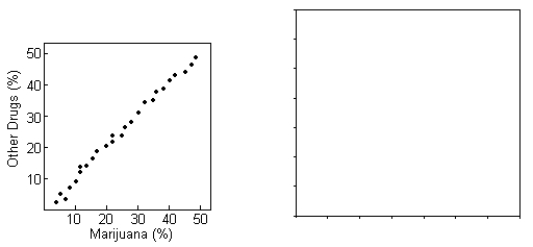
Question
The table contains the daily study time for students from Statistics 101 and the grades on their quiz. 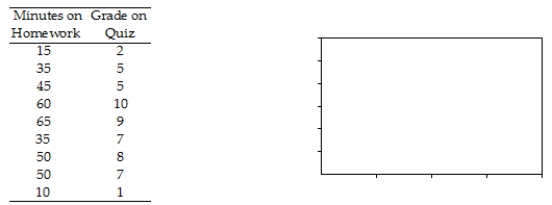
Question
The following table gives the total sales (revenue)and profits for 8 retailers. 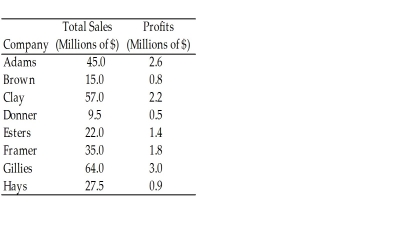
Question
Determine whether the scatterplot shows little or no association, a negative association, a linear association, a moderately strong association, or a very strong association (multiple associations are possible).
A)Linear association
B)Negative association,linear association
C)Little or no association
D)Moderately strong association
E)Linear association,moderately strong association
A)Linear association
B)Negative association,linear association
C)Little or no association
D)Moderately strong association
E)Linear association,moderately strong association
Question
Data collected from 20 students in Statistics classes included their heights (in inches)and weights (in pounds),and are displayed in the following scatterplot.Make a histogram of the weights of the children. 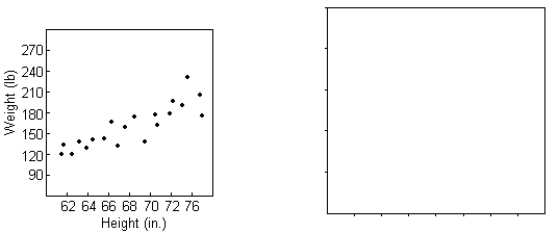
Question
The paired data below consist of the test scores of 6 randomly selected students and the number of hours they studied for the test. 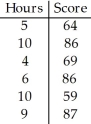
A)0.678
B)-0.678
C)0.224
D)-0.224
E)0.157
A)0.678
B)-0.678
C)0.224
D)-0.224
E)0.157
Question
A ceramics factory can fire seven large batches of pottery per day.Sometimes in the process a few of the pieces break.In order to understand the problem better,the factory records the number of broken pieces in each batch for 3 days and then creates the scatterplot shown.Make a histogram showing the distribution of the number of broken pieces in the 21 batches of pottery examined. 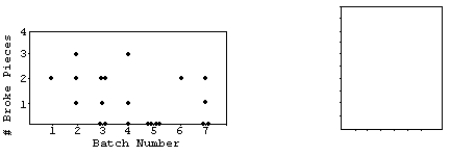
Question
To get the best deal on a microwave oven,Amanda called six appliance stores and asked the cost and volume of several models.The prices and volumes she was quoted are listed below. 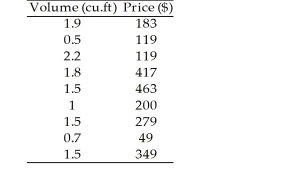
Question
A ceramics factory can fire six large batches of pottery per day.Sometimes in the process a few of the pieces break.In order to understand the problem better,the factory records the number of broken pieces in each batch for 4 days and then creates the scatterplot shown.Make a histogram showing the distribution of the number of broken pieces in the 24 batches of pottery examined. 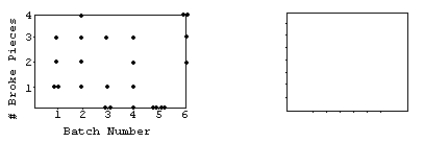
Question
Determine whether the scatterplot shows little or no association, a negative association, a linear association, a moderately strong association, or a very strong association (multiple associations are possible).
A)Moderately strong association
B)Positive association,linear association
C)Positive association,moderately strong association
D)Negative association,linear association
E)Little or no association
A)Moderately strong association
B)Positive association,linear association
C)Positive association,moderately strong association
D)Negative association,linear association
E)Little or no association
Question
The table contains the weights (in kg)and heights (in cm)of 9 randomly selected adults. 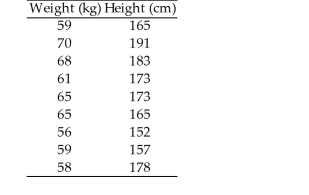
Question
The table shows the number of years of teaching experience for 9 certified high-school teachers and their weekly salaries (in dollars). 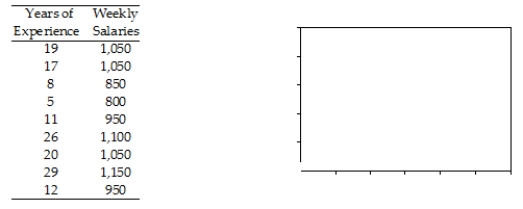
Question
Owners of a new appliances store tracked sales (in thousands)for the first 10 days,and displayed the data in a scatterplot.Make a histogram of the daily sales since the shop has been in business. 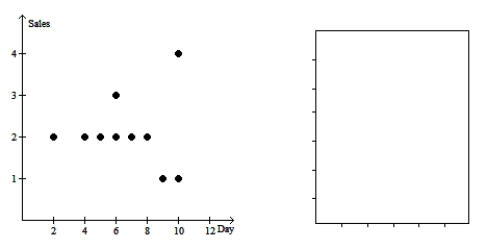
Question
A scientist collects data to predict the wheat yield (in bushels per acre)based on rainfall (in millimetres).The results are recorded in the table below. 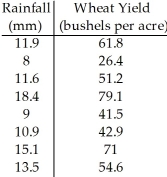
A)0.932
B)0.943
C)0.952
D)0.942
E)0.941
A)0.932
B)0.943
C)0.952
D)0.942
E)0.941
Question
Several scatterplots are given with calculated correlations. Which is which?
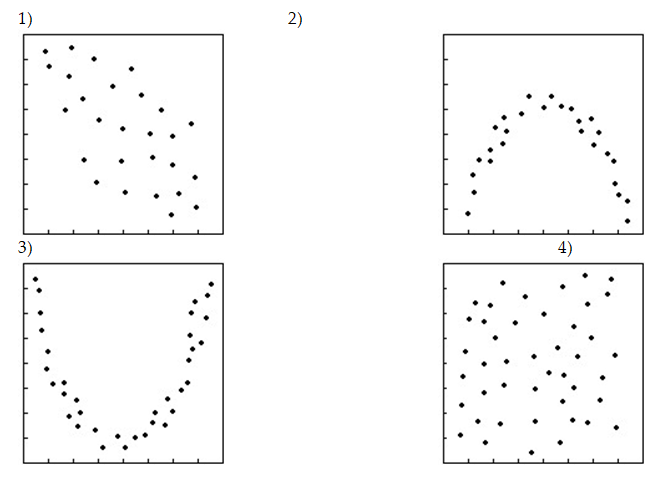
a)0.037,b)-0.445,c)0.003,d)-0.004
A)1b,2d,3c,4a
B)1d,2a,3b,4c
C)1a,2b,3c,4d
D)1c,2a,3d,4c
E)1b,2c,3d,4a
a)0.037,b)-0.445,c)0.003,d)-0.004
A)1b,2d,3c,4a
B)1d,2a,3b,4c
C)1a,2b,3c,4d
D)1c,2a,3d,4c
E)1b,2c,3d,4a
Question
Several scatterplots are given with calculated correlations. Which is which?
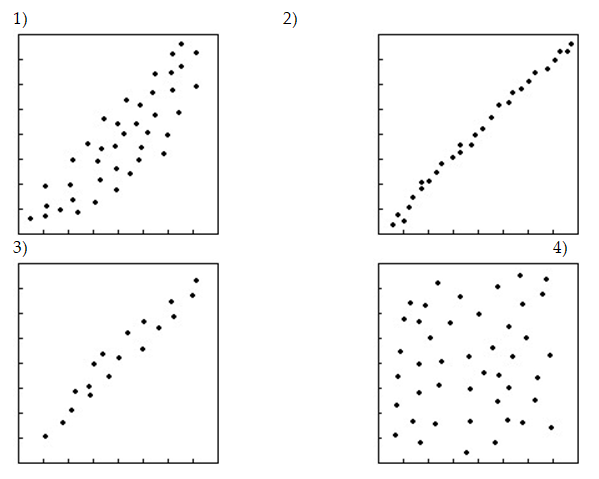
a)0.027,b)0.912,c)0.821,d)0.672
A)1b,2d,3c,4d
B)1c,2d,3b,4a
C)1a,2c,3b,4d
D)1d,2b,3c,4a
E)1d,2b,3a,4c
a)0.027,b)0.912,c)0.821,d)0.672
A)1b,2d,3c,4d
B)1c,2d,3b,4a
C)1a,2c,3b,4d
D)1d,2b,3c,4a
E)1d,2b,3a,4c
Question
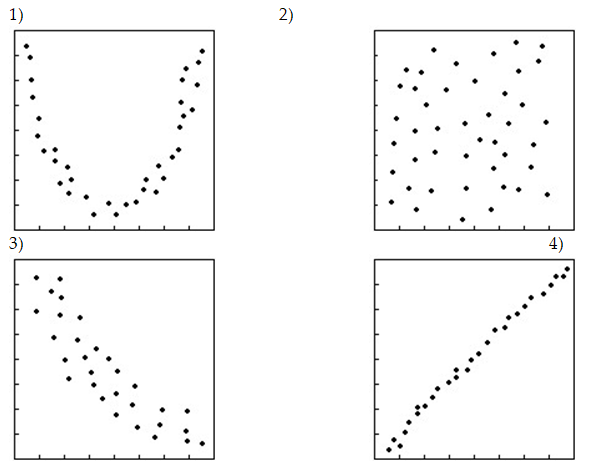
Several scatterplots are given with calculated correlations. Which is which?
4)
a)-0.921,b)-0.449,c)0.002,d)0.794
A)1a,2b,3c,4d
B)1c,2d,3a,4b
C)1d,2a,3b,4c
D)1c,2a,3d,4c
E)1b,2c,3d,4a
4)
a)-0.921,b)-0.449,c)0.002,d)0.794
A)1a,2b,3c,4d
B)1c,2d,3a,4b
C)1d,2a,3b,4c
D)1c,2a,3d,4c
E)1b,2c,3d,4a
Question
Question
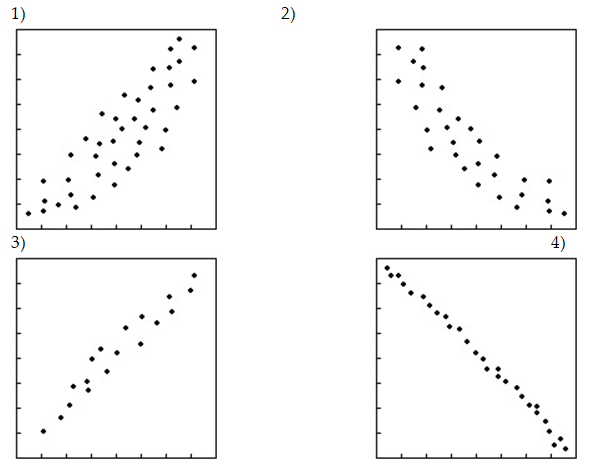
Several scatterplots are given with calculated correlations. Which is which?
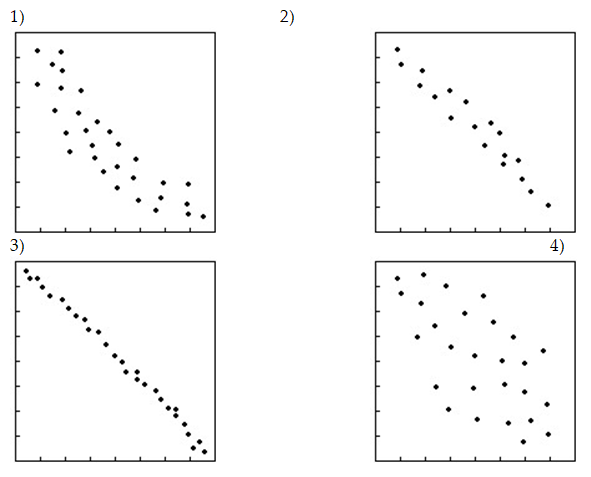
a)-0.847,b)-0.633,c)-0.433,d)-0.973
A)1b,2d,3a,4c
B)1b,2a,3d,4c
C)1a,2c,3b,4d
D)1b,2d,3c,4d
E)1c,2d,3b,4a
a)-0.847,b)-0.633,c)-0.433,d)-0.973
A)1b,2d,3a,4c
B)1b,2a,3d,4c
C)1a,2c,3b,4d
D)1b,2d,3c,4d
E)1c,2d,3b,4a
Question
A survey was conducted in 20 counties to determine the percentage of teenagers who had used marijuana and other drugs.Data shown on the following scatterplot indicate a correlation of 0.972 between the percent of teens who have used marijuana and the percent who have used other drugs.Describe the association. 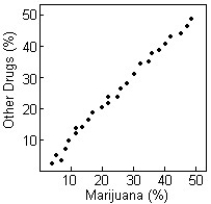
A)Strong curved relation in a positive direction
B)Weak linear relation in a positive direction
C)Strong linear relation in a positive direction
D)Strong nonlinear relation in a positive direction
E)No evidence of relation
A)Strong curved relation in a positive direction
B)Weak linear relation in a positive direction
C)Strong linear relation in a positive direction
D)Strong nonlinear relation in a positive direction
E)No evidence of relation
Question
Owners of a small shop tracked the number of customers and the sales each hour for a 7 hour period.The results are recorded in the table below. 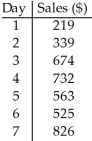
A)0.744
B)0.725
C)-0.763
D)0.763
E)0.801
A)0.744
B)0.725
C)-0.763
D)0.763
E)0.801
Question
The paired data below consist of the height of children (in cm)and their reading scores. 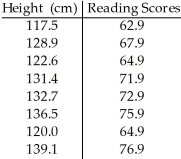
A)0.933
B)0.883
C)0.988
D)0.978
E)0.982
A)0.933
B)0.883
C)0.988
D)0.978
E)0.982
Question
Soda is often considered unhealthy because its content is high in both caffeine and refined sugar.But are the two related? Caffeine and refined sugar contents (in milligrams)of 12 ounces of several brands of soda are shown on the following scatterplot.The correlation between caffeine and refined sugar is 0.189.Describe the association. 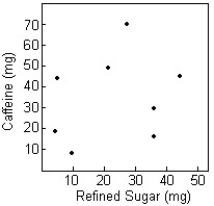
A)Weak linear relation in a positive direction
B)Weak nonlinear relation in a positive direction
C)Weak curved relation in a positive direction
D)No evidence of relation
E)Strong linear relation in a positive direction
A)Weak linear relation in a positive direction
B)Weak nonlinear relation in a positive direction
C)Weak curved relation in a positive direction
D)No evidence of relation
E)Strong linear relation in a positive direction
Question
Question
A shop owner tries to predict heater sales by displaying the sales of hot chocolate and heaters on the following scatterplot.Does the scatterplot of hot chocolate sales and heater sales indicate that it is appropriate to calculate the correlation? 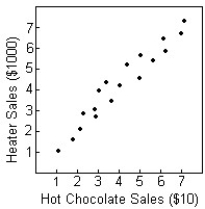
A)No: the relation must be linear.
B)Yes: the relation is strong.
C)Yes: the direction is positive.
D)Yes: the relation is linear.
E)Yes: the two variables are quantitative.
A)No: the relation must be linear.
B)Yes: the relation is strong.
C)Yes: the direction is positive.
D)Yes: the relation is linear.
E)Yes: the two variables are quantitative.
Question
Several scatterplots are given with calculated correlations. Which is which?
a)-0.798,b)0.009,c)0.084,d)0.948
A)1a,2b,3c,4d
B)1b,2c,3d,4a
C)1b,2c,3a,4d
D)1d,2a,3b,4c
E)1c,2a,3d,4c
a)-0.798,b)0.009,c)0.084,d)0.948
A)1a,2b,3c,4d
B)1b,2c,3d,4a
C)1b,2c,3a,4d
D)1d,2a,3b,4c
E)1c,2a,3d,4c
Question
Several scatterplots are given with calculated correlations. Which is which?
a)0.625,b)-0.775,c)-0.957,d)0.855
A)1b,2d,3c,4d
B)1d,2b,3a,4c
C)1c,2d,3b,4a
D)1a,2b,3d,4c
E)1a,2c,3b,4d
a)0.625,b)-0.775,c)-0.957,d)0.855
A)1b,2d,3c,4d
B)1d,2b,3a,4c
C)1c,2d,3b,4a
D)1a,2b,3d,4c
E)1a,2c,3b,4d
Question
A group of persons filled in a questionnaire their age and the number of countries they had visited in their lifetime.The results are recorded in the table below. 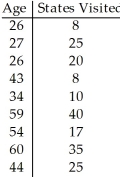
A)0.6
B)-1
C)-0.6
D)0.8
E)12
A)0.6
B)-1
C)-0.6
D)0.8
E)12
Question
Several scatterplots are given with calculated correlations. Which is which?
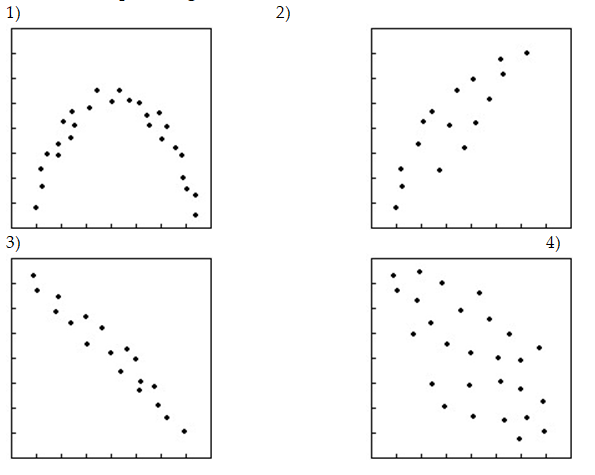
a)-0.993,b)-0.047,c)0.774,d)0.937
A)1d,2b,3a,4c
B)1a,2c,3b,4d
C)1a,2c,3d,4b
D)1c,2d,3b,4a
E)1b,2d,3c,4d
a)-0.993,b)-0.047,c)0.774,d)0.937
A)1d,2b,3a,4c
B)1a,2c,3b,4d
C)1a,2c,3d,4b
D)1c,2d,3b,4a
E)1b,2d,3c,4d
Question
Question
Question
Question
Question
Almost all of the acidity of soda pop comes from the phosphoric acid which is added to give them a sharper flavor.Is there a relation between the pH of the soda and the amount of phosphoric acid (in grams)? The pH and phosphoric acid content of 12 ounces of several brands of soda are shown on the following scatterplot.The correlation between pH and phosphoric acid is -0.956.Describe the association. 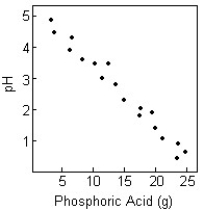
A)Strong relation in a negative direction
B)Weak linear relation in a negative direction
C)Strong linear relation in a positive direction
D)Very strong linear relation in a negative direction
E)No evidence of relation
A)Strong relation in a negative direction
B)Weak linear relation in a negative direction
C)Strong linear relation in a positive direction
D)Very strong linear relation in a negative direction
E)No evidence of relation
Question
Question
Question
Question
Question
Question
Fast food is often considered unhealthy because much of it is high in both fat and calories.But are the two related? Here are the fat (in grams)and calories contents of several brands of burgers.If the fat was recorded in kilograms,how would this change the correlation? Suppose the relation is linear. 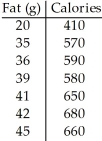
A)Yes: the two variables do not have the same units.
B)No: the relation is linear.
C)Yes: correlation changes with change of units.
D)No: correlation changes with change of units.
E)No: correlation does not change with change of units.
A)Yes: the two variables do not have the same units.
B)No: the relation is linear.
C)Yes: correlation changes with change of units.
D)No: correlation changes with change of units.
E)No: correlation does not change with change of units.
Question
Data collected from students in Statistics classes included their heights (in inches)and weights (in pounds).For the students' heights and weights,the correlation is 0.653.Suppose the variable weight is recorded in kilograms rather than in pounds.What will be the correlation? 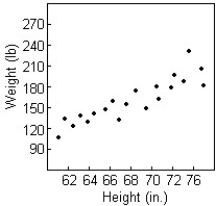
A)0.653 in./kg
B)-0.653
C)0.653 kg/in.
D)0.653
E)1.438 in./kg
A)0.653 in./kg
B)-0.653
C)0.653 kg/in.
D)0.653
E)1.438 in./kg
Question
The paired data below consist of the height (in cm)of children and their reading scores.If the height was recorded in inches,what would be the correlation? 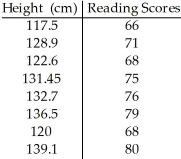
A)-0.983
B)0.387
C)1.567
D)2.497
E)0.982
A)-0.983
B)0.387
C)1.567
D)2.497
E)0.982
Question
A clothes shop owner tries to predict the winter collection sales by displaying the coats sales (in dollars)and the outside temperature (in degrees Fahrenheit)on the following scatterplot.He calculates that the correlation between coats sales and temperature is -0.737.Suppose the variable temperature is recorded in degrees Celsius rather than in degrees Fahrenheit.What will be the correlation? 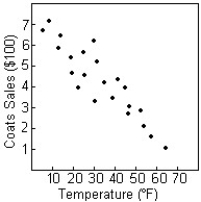
A)-0.737∘F ∙ $
B)-18.187∘F ∙ $
C)0.737
D)-0.737∘F / $
E)-0.737
A)-0.737∘F ∙ $
B)-18.187∘F ∙ $
C)0.737
D)-0.737∘F / $
E)-0.737
Question
Question
Question
Question

Unlock Deck
Sign up to unlock the cards in this deck!
Unlock Deck
Unlock Deck
1/74
Play
Full screen (f)
Deck 6: Scatterplots, association, and Correlation
1
Oranges: weight (grams),oranges: weight (milligrams)
A)Oranges: weight (grams): both
Oranges: weight (milligrams): both
B)Oranges: weight (grams): explanatory
Oranges: weight (milligrams): response
C)Oranges: weight (grams): explanatory
Oranges: weight (milligrams): both
D)Oranges: weight (grams): response
Oranges: weight (milligrams): explanatory
E)Oranges: weight (grams): both
Oranges: weight (milligrams): explanatory
Oranges: weight (grams): both
Oranges: weight (milligrams): both
Oranges: weight (milligrams): both
2
Determine whether the scatterplot shows little or no association, a negative association, a linear association, a moderately strong association, or a very strong association (multiple associations are possible).
A)Little or no association
B)Positive association,moderately strong association
C)Negative association,linear association
D)Moderately strong non-linear association
E)Negative association,moderately strong association
A)Little or no association
B)Positive association,moderately strong association
C)Negative association,linear association
D)Moderately strong non-linear association
E)Negative association,moderately strong association
Moderately strong non-linear association
3
Determine whether the scatterplot shows little or no association, a negative association, a linear association, a moderately strong association, or a very strong association (multiple associations are possible).
A)Positive association
B)Positive association,linear association,moderately strong association
C)Moderately strong association
D)Linear association,moderately strong association
E)Little or no association
A)Positive association
B)Positive association,linear association,moderately strong association
C)Moderately strong association
D)Linear association,moderately strong association
E)Little or no association
Positive association,linear association,moderately strong association
4
Determine whether the scatterplot shows little or no association, a negative association, a linear association, a moderately strong association, or a very strong association (multiple associations are possible).
A)Positive association,linear association
B)Positive association,moderately strong association
C)Positive association,linear association,very strong association
D)Linear association,very strong association
E)Linear association,moderately strong association
A)Positive association,linear association
B)Positive association,moderately strong association
C)Positive association,linear association,very strong association
D)Linear association,very strong association
E)Linear association,moderately strong association
Unlock Deck
Unlock for access to all 74 flashcards in this deck.
Unlock Deck
k this deck
5
Cloudy days,rainy days
A)Negative,nonlinear,strong
B)Positive,nonlinear,moderate
C)Negative,linear,strong
D)Positive,nonlinear,strong
E)Positive,linear,moderate
A)Negative,nonlinear,strong
B)Positive,nonlinear,moderate
C)Negative,linear,strong
D)Positive,nonlinear,strong
E)Positive,linear,moderate
Unlock Deck
Unlock for access to all 74 flashcards in this deck.
Unlock Deck
k this deck
6
Student: grade point average,student: height (feet)
A)No direction,linear,moderate
B)No direction,no form,very weak
C)Positive,no form,very weak
D)Negative,straight,moderate
E)No direction,no form,strong
A)No direction,linear,moderate
B)No direction,no form,very weak
C)Positive,no form,very weak
D)Negative,straight,moderate
E)No direction,no form,strong
Unlock Deck
Unlock for access to all 74 flashcards in this deck.
Unlock Deck
k this deck
7
Determine whether the scatterplot shows little or no association, a negative association, a linear association, a moderately strong association, or a very strong association (multiple associations are possible).
A)Negative association,linear association
B)Positive association,moderately strong association
C)Little or no association
D)Negative association,moderately strong association
E)Positive association,linear association
A)Negative association,linear association
B)Positive association,moderately strong association
C)Little or no association
D)Negative association,moderately strong association
E)Positive association,linear association
Unlock Deck
Unlock for access to all 74 flashcards in this deck.
Unlock Deck
k this deck
8
Oranges: circumference (centimetres),oranges: weight (grams)
A)Negative,nonlinear,moderate
B)Negative,straight,moderate
C)Positive,straight,moderate
D)Positive,nonlinear,moderate
E)Positive,no form,strong
A)Negative,nonlinear,moderate
B)Negative,straight,moderate
C)Positive,straight,moderate
D)Positive,nonlinear,moderate
E)Positive,no form,strong
Unlock Deck
Unlock for access to all 74 flashcards in this deck.
Unlock Deck
k this deck
9
Oranges: circumference (centimetres),oranges: weight (grams)
A)Oranges: circumference (centimetres): both
Oranges: weight (grams): both
B)Oranges: circumference (centimetres): explanatory
Oranges: weight (grams): both
C)Oranges: circumference (centimetres): explanatory
Oranges: weight (grams): response
D)Oranges: circumference (centimetres): both
Oranges: weight (grams): explanatory
E)Oranges: circumference (centimetres): response
Oranges: weight (grams): explanatory
Unlock Deck
Unlock for access to all 74 flashcards in this deck.
Unlock Deck
k this deck
10
Oranges: weight (ounces),oranges: weight (grams)
A)Positive,straight,strong
B)Positive,nonlinear,moderate
C)Negative,straight,moderate
D)Negative,nonlinear,moderate
E)Positive,no form,strong
A)Positive,straight,strong
B)Positive,nonlinear,moderate
C)Negative,straight,moderate
D)Negative,nonlinear,moderate
E)Positive,no form,strong
Unlock Deck
Unlock for access to all 74 flashcards in this deck.
Unlock Deck
k this deck
11
Litres remaining in a take of gas,kilometres driving since filling up.
A)Negative,straight,moderate
B)Negative,nonlinear,strong
C)Negative,nonlinear,moderate
D)Positive,nonlinear,strong
E)Positive,straight,moderate
A)Negative,straight,moderate
B)Negative,nonlinear,strong
C)Negative,nonlinear,moderate
D)Positive,nonlinear,strong
E)Positive,straight,moderate
Unlock Deck
Unlock for access to all 74 flashcards in this deck.
Unlock Deck
k this deck
12
Air pressure,altitude
A)Air pressure: both
Altitude: both
B)Air pressure: response
Altitude: explanatory
C)Air pressure: explanatory
Altitude: response
D)Air pressure: explanatory
Altitude: both
E)Air pressure: both
Altitude: explanatory
A)Air pressure: both
Altitude: both
B)Air pressure: response
Altitude: explanatory
C)Air pressure: explanatory
Altitude: response
D)Air pressure: explanatory
Altitude: both
E)Air pressure: both
Altitude: explanatory
Unlock Deck
Unlock for access to all 74 flashcards in this deck.
Unlock Deck
k this deck
13
Air pressure,altitude
A)Positive,straight,strong
B)Positive,straight,moderate
C)Negative,nonlinear,strong
D)Negative,straight,moderate
E)Negative,straight,strong
A)Positive,straight,strong
B)Positive,straight,moderate
C)Negative,nonlinear,strong
D)Negative,straight,moderate
E)Negative,straight,strong
Unlock Deck
Unlock for access to all 74 flashcards in this deck.
Unlock Deck
k this deck
14
Adult weight (kg):,Adult height (m):
A)Adult weight (kg): both
Adult height (m): both
B)Adult weight (kg): explanatory
Adult height (m): response
C)Adult weight (kg): response
Adult height (m): explanatory
D)Adult weight (kg): explanatory
Adult height (m): both
E)Adult weight (kg): both
Adult height (m): explanatory
A)Adult weight (kg): both
Adult height (m): both
B)Adult weight (kg): explanatory
Adult height (m): response
C)Adult weight (kg): response
Adult height (m): explanatory
D)Adult weight (kg): explanatory
Adult height (m): both
E)Adult weight (kg): both
Adult height (m): explanatory
Unlock Deck
Unlock for access to all 74 flashcards in this deck.
Unlock Deck
k this deck
15
Determine whether the scatterplot shows little or no association, a negative association, a linear association, a moderately strong association, or a very strong association (multiple associations are possible).
A)Negative association
B)Moderately strong association
C)Linear association,moderately strong association
D)Negative association,linear association,moderate association
E)Little or no association
A)Negative association
B)Moderately strong association
C)Linear association,moderately strong association
D)Negative association,linear association,moderate association
E)Little or no association
Unlock Deck
Unlock for access to all 74 flashcards in this deck.
Unlock Deck
k this deck
16
How tired you are,hours of sleep
A)Positive,linear,moderate
B)Positive,nonlinear,moderate
C)Negative,nonlinear,moderate
D)Negative,nonlinear,strong
E)Negative,linear,moderate
A)Positive,linear,moderate
B)Positive,nonlinear,moderate
C)Negative,nonlinear,moderate
D)Negative,nonlinear,strong
E)Negative,linear,moderate
Unlock Deck
Unlock for access to all 74 flashcards in this deck.
Unlock Deck
k this deck
17
Determine whether the scatterplot shows little or no association, a negative association, a linear association, a moderately strong association, or a very strong association (multiple associations are possible).
A)Linear association,moderately strong association
B)Linear association,very strong association
C)Negative association,linear association,very strong association
D)Negative association,moderately strong association
E)Negative association,linear association
A)Linear association,moderately strong association
B)Linear association,very strong association
C)Negative association,linear association,very strong association
D)Negative association,moderately strong association
E)Negative association,linear association
Unlock Deck
Unlock for access to all 74 flashcards in this deck.
Unlock Deck
k this deck
18
Year,results of race
A)Year: both
Results of race: both
B)Year: both
Results of race: explanatory
C)Year: explanatory
Results of race: both
D)Year: explanatory
Results of race: response
E)Year: response
Results of race: explanatory
A)Year: both
Results of race: both
B)Year: both
Results of race: explanatory
C)Year: explanatory
Results of race: both
D)Year: explanatory
Results of race: response
E)Year: response
Results of race: explanatory
Unlock Deck
Unlock for access to all 74 flashcards in this deck.
Unlock Deck
k this deck
19
Determine whether the scatterplot shows little or no association, a negative association, a linear association, a moderately strong association, or a very strong association (multiple associations are possible).
A)Linear association,moderately strong association
B)Positive association
C)Linear association
D)Positive association,moderately strong association,linear association
E)Positive association,moderately strong association
A)Linear association,moderately strong association
B)Positive association
C)Linear association
D)Positive association,moderately strong association,linear association
E)Positive association,moderately strong association
Unlock Deck
Unlock for access to all 74 flashcards in this deck.
Unlock Deck
k this deck
20
Teacher: weekly salary,teacher: years of experience
A)Teacher: weekly salary: response
Teacher: years of experience: explanatory
B)Teacher: weekly salary: both
Teacher: years of experience: explanatory
C)Teacher: weekly salary: explanatory
Teacher: years of experience: response
D)Teacher: weekly salary: both
Teacher: years of experience: both
E)Teacher: weekly salary: explanatory
Teacher: years of experience: both
Unlock Deck
Unlock for access to all 74 flashcards in this deck.
Unlock Deck
k this deck
21
The owner of a small manufacturing plant employs nine people.As part of their personnel file,he asked each one to record the distance,in km,they travel one way from home to work and the time it takes in minutes.
Unlock Deck
Unlock for access to all 74 flashcards in this deck.
Unlock Deck
k this deck
22
A shop owner tries to predict the winter collection sales by displaying coat sales (in dollars)and the outside temperature (in degrees Fahrenheit)in the following scatterplot.Make a histogram of the coat sales.
Unlock Deck
Unlock for access to all 74 flashcards in this deck.
Unlock Deck
k this deck
23
A study was conducted to compare the average time spent in the lab each week versus course grade for computer students.The results are recorded in the table below.
A)-0.284
B)-0.335
C)0.371
D)0.462
E)0.017
A)-0.284
B)-0.335
C)0.371
D)0.462
E)0.017
Unlock Deck
Unlock for access to all 74 flashcards in this deck.
Unlock Deck
k this deck
24
Owners of a new computer store tracked sales (in thousands)for the first 12 days,and displayed the data in a scatterplot.Make a histogram of the daily sales since the shop has been in business.
Unlock Deck
Unlock for access to all 74 flashcards in this deck.
Unlock Deck
k this deck
25
Below are the Olympic gold medal performances in the men's high jump from 1960 to 1984.
Unlock Deck
Unlock for access to all 74 flashcards in this deck.
Unlock Deck
k this deck
26
Determine whether the scatterplot shows little or no association, a negative association, a linear association, a moderately strong association, or a very strong association (multiple associations are possible).
A)Linear association,moderately strong association
B)Positive association,linear association
C)Moderately strong association
D)Linear association
E)Little or no association
A)Linear association,moderately strong association
B)Positive association,linear association
C)Moderately strong association
D)Linear association
E)Little or no association
Unlock Deck
Unlock for access to all 74 flashcards in this deck.
Unlock Deck
k this deck
27
Two different tests are designed to measure employee productivity and dexterity.Several employees are randomly selected and tested with these results.
A)-0.280
B)0.986
C)0.159
D)0.471
E)0.115
A)-0.280
B)0.986
C)0.159
D)0.471
E)0.115
Unlock Deck
Unlock for access to all 74 flashcards in this deck.
Unlock Deck
k this deck
28
A survey was conducted in 26 counties to determine the percentage of teenagers who had used marijuana and other drugs.Data are displayed in the following scatterplot.Make a histogram of the other drugs.
Unlock Deck
Unlock for access to all 74 flashcards in this deck.
Unlock Deck
k this deck
29
The table contains the daily study time for students from Statistics 101 and the grades on their quiz.
Unlock Deck
Unlock for access to all 74 flashcards in this deck.
Unlock Deck
k this deck
30
The following table gives the total sales (revenue)and profits for 8 retailers.
Unlock Deck
Unlock for access to all 74 flashcards in this deck.
Unlock Deck
k this deck
31
Determine whether the scatterplot shows little or no association, a negative association, a linear association, a moderately strong association, or a very strong association (multiple associations are possible).
A)Linear association
B)Negative association,linear association
C)Little or no association
D)Moderately strong association
E)Linear association,moderately strong association
A)Linear association
B)Negative association,linear association
C)Little or no association
D)Moderately strong association
E)Linear association,moderately strong association
Unlock Deck
Unlock for access to all 74 flashcards in this deck.
Unlock Deck
k this deck
32
Data collected from 20 students in Statistics classes included their heights (in inches)and weights (in pounds),and are displayed in the following scatterplot.Make a histogram of the weights of the children.
Unlock Deck
Unlock for access to all 74 flashcards in this deck.
Unlock Deck
k this deck
33
The paired data below consist of the test scores of 6 randomly selected students and the number of hours they studied for the test.
A)0.678
B)-0.678
C)0.224
D)-0.224
E)0.157
A)0.678
B)-0.678
C)0.224
D)-0.224
E)0.157
Unlock Deck
Unlock for access to all 74 flashcards in this deck.
Unlock Deck
k this deck
34
A ceramics factory can fire seven large batches of pottery per day.Sometimes in the process a few of the pieces break.In order to understand the problem better,the factory records the number of broken pieces in each batch for 3 days and then creates the scatterplot shown.Make a histogram showing the distribution of the number of broken pieces in the 21 batches of pottery examined.
Unlock Deck
Unlock for access to all 74 flashcards in this deck.
Unlock Deck
k this deck
35
To get the best deal on a microwave oven,Amanda called six appliance stores and asked the cost and volume of several models.The prices and volumes she was quoted are listed below.
Unlock Deck
Unlock for access to all 74 flashcards in this deck.
Unlock Deck
k this deck
36
A ceramics factory can fire six large batches of pottery per day.Sometimes in the process a few of the pieces break.In order to understand the problem better,the factory records the number of broken pieces in each batch for 4 days and then creates the scatterplot shown.Make a histogram showing the distribution of the number of broken pieces in the 24 batches of pottery examined.
Unlock Deck
Unlock for access to all 74 flashcards in this deck.
Unlock Deck
k this deck
37
Determine whether the scatterplot shows little or no association, a negative association, a linear association, a moderately strong association, or a very strong association (multiple associations are possible).
A)Moderately strong association
B)Positive association,linear association
C)Positive association,moderately strong association
D)Negative association,linear association
E)Little or no association
A)Moderately strong association
B)Positive association,linear association
C)Positive association,moderately strong association
D)Negative association,linear association
E)Little or no association
Unlock Deck
Unlock for access to all 74 flashcards in this deck.
Unlock Deck
k this deck
38
The table contains the weights (in kg)and heights (in cm)of 9 randomly selected adults.
Unlock Deck
Unlock for access to all 74 flashcards in this deck.
Unlock Deck
k this deck
39
The table shows the number of years of teaching experience for 9 certified high-school teachers and their weekly salaries (in dollars).
Unlock Deck
Unlock for access to all 74 flashcards in this deck.
Unlock Deck
k this deck
40
Owners of a new appliances store tracked sales (in thousands)for the first 10 days,and displayed the data in a scatterplot.Make a histogram of the daily sales since the shop has been in business.
Unlock Deck
Unlock for access to all 74 flashcards in this deck.
Unlock Deck
k this deck
41
A scientist collects data to predict the wheat yield (in bushels per acre)based on rainfall (in millimetres).The results are recorded in the table below.
A)0.932
B)0.943
C)0.952
D)0.942
E)0.941
A)0.932
B)0.943
C)0.952
D)0.942
E)0.941
Unlock Deck
Unlock for access to all 74 flashcards in this deck.
Unlock Deck
k this deck
42
Several scatterplots are given with calculated correlations. Which is which?
a)0.037,b)-0.445,c)0.003,d)-0.004
A)1b,2d,3c,4a
B)1d,2a,3b,4c
C)1a,2b,3c,4d
D)1c,2a,3d,4c
E)1b,2c,3d,4a
a)0.037,b)-0.445,c)0.003,d)-0.004
A)1b,2d,3c,4a
B)1d,2a,3b,4c
C)1a,2b,3c,4d
D)1c,2a,3d,4c
E)1b,2c,3d,4a
Unlock Deck
Unlock for access to all 74 flashcards in this deck.
Unlock Deck
k this deck
43
Several scatterplots are given with calculated correlations. Which is which?
a)0.027,b)0.912,c)0.821,d)0.672
A)1b,2d,3c,4d
B)1c,2d,3b,4a
C)1a,2c,3b,4d
D)1d,2b,3c,4a
E)1d,2b,3a,4c
a)0.027,b)0.912,c)0.821,d)0.672
A)1b,2d,3c,4d
B)1c,2d,3b,4a
C)1a,2c,3b,4d
D)1d,2b,3c,4a
E)1d,2b,3a,4c
Unlock Deck
Unlock for access to all 74 flashcards in this deck.
Unlock Deck
k this deck
44
Several scatterplots are given with calculated correlations. Which is which?
4)
a)-0.921,b)-0.449,c)0.002,d)0.794
A)1a,2b,3c,4d
B)1c,2d,3a,4b
C)1d,2a,3b,4c
D)1c,2a,3d,4c
E)1b,2c,3d,4a
4)
a)-0.921,b)-0.449,c)0.002,d)0.794
A)1a,2b,3c,4d
B)1c,2d,3a,4b
C)1d,2a,3b,4c
D)1c,2a,3d,4c
E)1b,2c,3d,4a
Unlock Deck
Unlock for access to all 74 flashcards in this deck.
Unlock Deck
k this deck
45
A science instructor assigns a group of students to investigate the linear relationship between the pH of the water of a river and its water's hardness (measured in grains).Some students wrote these conclusions: "My correlation of -0.85 shows that there is almost no association between pH of the water and water's hardness." Is the interpretation of the correlation appropriate?
A)Yes: a correlation of -0.85 shows a weak relation in a negative direction.
B)No: correlation is always positive.
C)No: a correlation of -0.85 shows a strong relation in a negative direction.
D)Yes: pH and hardness of water do not have the same units.
E)No: the pH and the hardness of the water are data collected from the same river.
Unlock Deck
Unlock for access to all 74 flashcards in this deck.
Unlock Deck
k this deck
46
Several scatterplots are given with calculated correlations. Which is which?
a)-0.847,b)-0.633,c)-0.433,d)-0.973
A)1b,2d,3a,4c
B)1b,2a,3d,4c
C)1a,2c,3b,4d
D)1b,2d,3c,4d
E)1c,2d,3b,4a
a)-0.847,b)-0.633,c)-0.433,d)-0.973
A)1b,2d,3a,4c
B)1b,2a,3d,4c
C)1a,2c,3b,4d
D)1b,2d,3c,4d
E)1c,2d,3b,4a
Unlock Deck
Unlock for access to all 74 flashcards in this deck.
Unlock Deck
k this deck
47
A survey was conducted in 20 counties to determine the percentage of teenagers who had used marijuana and other drugs.Data shown on the following scatterplot indicate a correlation of 0.972 between the percent of teens who have used marijuana and the percent who have used other drugs.Describe the association.
A)Strong curved relation in a positive direction
B)Weak linear relation in a positive direction
C)Strong linear relation in a positive direction
D)Strong nonlinear relation in a positive direction
E)No evidence of relation
A)Strong curved relation in a positive direction
B)Weak linear relation in a positive direction
C)Strong linear relation in a positive direction
D)Strong nonlinear relation in a positive direction
E)No evidence of relation
Unlock Deck
Unlock for access to all 74 flashcards in this deck.
Unlock Deck
k this deck
48
Owners of a small shop tracked the number of customers and the sales each hour for a 7 hour period.The results are recorded in the table below.
A)0.744
B)0.725
C)-0.763
D)0.763
E)0.801
A)0.744
B)0.725
C)-0.763
D)0.763
E)0.801
Unlock Deck
Unlock for access to all 74 flashcards in this deck.
Unlock Deck
k this deck
49
The paired data below consist of the height of children (in cm)and their reading scores.
A)0.933
B)0.883
C)0.988
D)0.978
E)0.982
A)0.933
B)0.883
C)0.988
D)0.978
E)0.982
Unlock Deck
Unlock for access to all 74 flashcards in this deck.
Unlock Deck
k this deck
50
Soda is often considered unhealthy because its content is high in both caffeine and refined sugar.But are the two related? Caffeine and refined sugar contents (in milligrams)of 12 ounces of several brands of soda are shown on the following scatterplot.The correlation between caffeine and refined sugar is 0.189.Describe the association.
A)Weak linear relation in a positive direction
B)Weak nonlinear relation in a positive direction
C)Weak curved relation in a positive direction
D)No evidence of relation
E)Strong linear relation in a positive direction
A)Weak linear relation in a positive direction
B)Weak nonlinear relation in a positive direction
C)Weak curved relation in a positive direction
D)No evidence of relation
E)Strong linear relation in a positive direction
Unlock Deck
Unlock for access to all 74 flashcards in this deck.
Unlock Deck
k this deck
51
A study is conducted on insects growth based on hydrometry.The correlation found between insects growth and hydrometry is 0.05.A journalist concludes that a low correlation between insects growth and hydrometry shows that insects can reproduce easily in a dry climate.Do you agree with this interpretation?
A)No: the correlation must be negative.
B)Yes: the correlation is close to 0.
C)Yes: the two variables are quantitative.
D)No: the relation must be linear.
E)Yes: the relation is linear.
A)No: the correlation must be negative.
B)Yes: the correlation is close to 0.
C)Yes: the two variables are quantitative.
D)No: the relation must be linear.
E)Yes: the relation is linear.
Unlock Deck
Unlock for access to all 74 flashcards in this deck.
Unlock Deck
k this deck
52
A shop owner tries to predict heater sales by displaying the sales of hot chocolate and heaters on the following scatterplot.Does the scatterplot of hot chocolate sales and heater sales indicate that it is appropriate to calculate the correlation?
A)No: the relation must be linear.
B)Yes: the relation is strong.
C)Yes: the direction is positive.
D)Yes: the relation is linear.
E)Yes: the two variables are quantitative.
A)No: the relation must be linear.
B)Yes: the relation is strong.
C)Yes: the direction is positive.
D)Yes: the relation is linear.
E)Yes: the two variables are quantitative.
Unlock Deck
Unlock for access to all 74 flashcards in this deck.
Unlock Deck
k this deck
53
Several scatterplots are given with calculated correlations. Which is which?
a)-0.798,b)0.009,c)0.084,d)0.948
A)1a,2b,3c,4d
B)1b,2c,3d,4a
C)1b,2c,3a,4d
D)1d,2a,3b,4c
E)1c,2a,3d,4c
a)-0.798,b)0.009,c)0.084,d)0.948
A)1a,2b,3c,4d
B)1b,2c,3d,4a
C)1b,2c,3a,4d
D)1d,2a,3b,4c
E)1c,2a,3d,4c
Unlock Deck
Unlock for access to all 74 flashcards in this deck.
Unlock Deck
k this deck
54
Several scatterplots are given with calculated correlations. Which is which?
a)0.625,b)-0.775,c)-0.957,d)0.855
A)1b,2d,3c,4d
B)1d,2b,3a,4c
C)1c,2d,3b,4a
D)1a,2b,3d,4c
E)1a,2c,3b,4d
a)0.625,b)-0.775,c)-0.957,d)0.855
A)1b,2d,3c,4d
B)1d,2b,3a,4c
C)1c,2d,3b,4a
D)1a,2b,3d,4c
E)1a,2c,3b,4d
Unlock Deck
Unlock for access to all 74 flashcards in this deck.
Unlock Deck
k this deck
55
A group of persons filled in a questionnaire their age and the number of countries they had visited in their lifetime.The results are recorded in the table below.
A)0.6
B)-1
C)-0.6
D)0.8
E)12
A)0.6
B)-1
C)-0.6
D)0.8
E)12
Unlock Deck
Unlock for access to all 74 flashcards in this deck.
Unlock Deck
k this deck
56
Several scatterplots are given with calculated correlations. Which is which?
a)-0.993,b)-0.047,c)0.774,d)0.937
A)1d,2b,3a,4c
B)1a,2c,3b,4d
C)1a,2c,3d,4b
D)1c,2d,3b,4a
E)1b,2d,3c,4d
a)-0.993,b)-0.047,c)0.774,d)0.937
A)1d,2b,3a,4c
B)1a,2c,3b,4d
C)1a,2c,3d,4b
D)1c,2d,3b,4a
E)1b,2d,3c,4d
Unlock Deck
Unlock for access to all 74 flashcards in this deck.
Unlock Deck
k this deck
57
A study is conducted on the causes of flat feet,and shows a linear relation between age and having mechanical disturbances of the foot.The correlation between these two variables is 0.84.The report concludes that older people have greater chances to have flat feet.Is the calculation of the correlation appropriate?
A)No: having mechanical disturbances of the foot is a categorical variable.
B)Yes: the two variables are quantitative.
C)No: having mechanical disturbances of the foot is a response variable.
D)Yes: correlation is less than 1.
E)Yes: age is a quantitative variable.
A)No: having mechanical disturbances of the foot is a categorical variable.
B)Yes: the two variables are quantitative.
C)No: having mechanical disturbances of the foot is a response variable.
D)Yes: correlation is less than 1.
E)Yes: age is a quantitative variable.
Unlock Deck
Unlock for access to all 74 flashcards in this deck.
Unlock Deck
k this deck
58
A reporter investigates speeding on roads in a county and finds a correlation of 0.961 between the number of speeding tickets and the numbers of kilometres of well-paved roads.Assuming that the relation is linear,does it mean that there are more speeding tickets on well-paved roads?
A)Yes: the relation is linear.
B)No: speeding is a categorical variable.
C)Yes: the two variables are quantitative.
D)No: the correlation does not imply causality.
E)Yes: the correlation is close to 1.
A)Yes: the relation is linear.
B)No: speeding is a categorical variable.
C)Yes: the two variables are quantitative.
D)No: the correlation does not imply causality.
E)Yes: the correlation is close to 1.
Unlock Deck
Unlock for access to all 74 flashcards in this deck.
Unlock Deck
k this deck
59
A science instructor assigns a group of students to investigate the relationship between the pH of the water of a river and its water's hardness (measured in grains).Some students wrote these conclusions: "there was a very strong correlation of 0.902 grains between pH of the water and water's hardness." Is the calculation of the correlation appropriate?
A)No: there is little or no association.
B)Yes: the pH and the hardness of the water are data collected from the same river.
C)No: pH and hardness of water have different units.
D)Yes: correlation is less than 1.
E)No: correlation has no units.
A)No: there is little or no association.
B)Yes: the pH and the hardness of the water are data collected from the same river.
C)No: pH and hardness of water have different units.
D)Yes: correlation is less than 1.
E)No: correlation has no units.
Unlock Deck
Unlock for access to all 74 flashcards in this deck.
Unlock Deck
k this deck
60
A science instructor assigns a group of students to investigate the relationship between the pH of the water of a river and its water's hardness (measured in grains).Some students wrote these conclusions: "there was a very strong correlation of 1.35 between pH of the water and water's hardness." Is the calculation of the correlation appropriate?
A)Yes: correlation can be greater than 1.
B)Yes: the pH and the hardness of the water are data collected from the same river.
C)No: there is little or no association.
D)No: correlation cannot be greater than 1.
E)No: correlation must be equal to 1.
A)Yes: correlation can be greater than 1.
B)Yes: the pH and the hardness of the water are data collected from the same river.
C)No: there is little or no association.
D)No: correlation cannot be greater than 1.
E)No: correlation must be equal to 1.
Unlock Deck
Unlock for access to all 74 flashcards in this deck.
Unlock Deck
k this deck
61
Almost all of the acidity of soda pop comes from the phosphoric acid which is added to give them a sharper flavor.Is there a relation between the pH of the soda and the amount of phosphoric acid (in grams)? The pH and phosphoric acid content of 12 ounces of several brands of soda are shown on the following scatterplot.The correlation between pH and phosphoric acid is -0.956.Describe the association.
A)Strong relation in a negative direction
B)Weak linear relation in a negative direction
C)Strong linear relation in a positive direction
D)Very strong linear relation in a negative direction
E)No evidence of relation
A)Strong relation in a negative direction
B)Weak linear relation in a negative direction
C)Strong linear relation in a positive direction
D)Very strong linear relation in a negative direction
E)No evidence of relation
Unlock Deck
Unlock for access to all 74 flashcards in this deck.
Unlock Deck
k this deck
62
Adam would like to buy a used car,and collected several data to evaluate the best model (such as age,price,weight,etc. )Thanks to a scatterplot,he established that the relation between age and weight is somewhat linear.He calculated that the correlation between age and weight is 0.515.Describe the association.
A)Weak linear relation
B)No evidence of relation
C)Weak linear relation in a positive direction
D)Weak linear relation in a negative direction
E)Strong linear relation in a positive direction
A)Weak linear relation
B)No evidence of relation
C)Weak linear relation in a positive direction
D)Weak linear relation in a negative direction
E)Strong linear relation in a positive direction
Unlock Deck
Unlock for access to all 74 flashcards in this deck.
Unlock Deck
k this deck
63
A teacher studied students' grades and established with a scatterplot a strong correlation between SAT scores and college grades.Find the lurking variable,if there is one.
A)College
B)High school
C)IQ
D)Attendance
E)No lurking variable
A)College
B)High school
C)IQ
D)Attendance
E)No lurking variable
Unlock Deck
Unlock for access to all 74 flashcards in this deck.
Unlock Deck
k this deck
64
A study of consumer behavior finds a positive correlation between sales of ice cream and sales of soda.What might explain the strong correlation?
A)Ice cream creates a thirst for beer
B)Outdoor temperature
C)People generally have ice cream for dessert if they have drunk soda with a meal.
D)Arithmetic mistake
E)No lurking variable
A)Ice cream creates a thirst for beer
B)Outdoor temperature
C)People generally have ice cream for dessert if they have drunk soda with a meal.
D)Arithmetic mistake
E)No lurking variable
Unlock Deck
Unlock for access to all 74 flashcards in this deck.
Unlock Deck
k this deck
65
In a school,a scientist observed children during lunch time over several months to study how much they eat and for how many minutes.He evaluated in calories what each child ate each day for lunch.After careful observations,he found that the variables time and calories relate linearly,and that the correlation between those variables is 0.629.Suppose he was to record time in hours rather than in minutes.Would the correlation change?
A)No: correlation does not change with change of units.
B)Yes: correlation changes with change of units.
C)No: correlation changes with change of units.
D)No: the relation is linear.
E)Yes: the two variables do not have the same units.
A)No: correlation does not change with change of units.
B)Yes: correlation changes with change of units.
C)No: correlation changes with change of units.
D)No: the relation is linear.
E)Yes: the two variables do not have the same units.
Unlock Deck
Unlock for access to all 74 flashcards in this deck.
Unlock Deck
k this deck
66
An economist noticed that nations with more TV sets have higher life expectancies.He established with a scatterplot a high positive correlation between length of life and number of TV sets.Find the lurking variable,if there is one.
A)Sofa
B)TV sets brands
C)Popcorn
D)Wealth of the nation
E)No lurking variable
A)Sofa
B)TV sets brands
C)Popcorn
D)Wealth of the nation
E)No lurking variable
Unlock Deck
Unlock for access to all 74 flashcards in this deck.
Unlock Deck
k this deck
67
Fast food is often considered unhealthy because much of it is high in both fat and calories.But are the two related? Here are the fat (in grams)and calories contents of several brands of burgers.If the fat was recorded in kilograms,how would this change the correlation? Suppose the relation is linear.
A)Yes: the two variables do not have the same units.
B)No: the relation is linear.
C)Yes: correlation changes with change of units.
D)No: correlation changes with change of units.
E)No: correlation does not change with change of units.
A)Yes: the two variables do not have the same units.
B)No: the relation is linear.
C)Yes: correlation changes with change of units.
D)No: correlation changes with change of units.
E)No: correlation does not change with change of units.
Unlock Deck
Unlock for access to all 74 flashcards in this deck.
Unlock Deck
k this deck
68
Data collected from students in Statistics classes included their heights (in inches)and weights (in pounds).For the students' heights and weights,the correlation is 0.653.Suppose the variable weight is recorded in kilograms rather than in pounds.What will be the correlation?
A)0.653 in./kg
B)-0.653
C)0.653 kg/in.
D)0.653
E)1.438 in./kg
A)0.653 in./kg
B)-0.653
C)0.653 kg/in.
D)0.653
E)1.438 in./kg
Unlock Deck
Unlock for access to all 74 flashcards in this deck.
Unlock Deck
k this deck
69
The paired data below consist of the height (in cm)of children and their reading scores.If the height was recorded in inches,what would be the correlation?
A)-0.983
B)0.387
C)1.567
D)2.497
E)0.982
A)-0.983
B)0.387
C)1.567
D)2.497
E)0.982
Unlock Deck
Unlock for access to all 74 flashcards in this deck.
Unlock Deck
k this deck
70
A clothes shop owner tries to predict the winter collection sales by displaying the coats sales (in dollars)and the outside temperature (in degrees Fahrenheit)on the following scatterplot.He calculates that the correlation between coats sales and temperature is -0.737.Suppose the variable temperature is recorded in degrees Celsius rather than in degrees Fahrenheit.What will be the correlation?
A)-0.737∘F ∙ $
B)-18.187∘F ∙ $
C)0.737
D)-0.737∘F / $
E)-0.737
A)-0.737∘F ∙ $
B)-18.187∘F ∙ $
C)0.737
D)-0.737∘F / $
E)-0.737
Unlock Deck
Unlock for access to all 74 flashcards in this deck.
Unlock Deck
k this deck
71
A Science instructor assigns a group of students to investigate the relationship between their grade point average and their consistency in studying.The correlation between GPA and studying consistency is 0.857.Assume that the relation is linear.Describe the association.
A)Strong linear relation in a negative direction
B)Strong curved relation in a positive direction
C)Weak linear relation in a positive direction
D)Strong linear relation in a positive direction
E)No evidence of relation
A)Strong linear relation in a negative direction
B)Strong curved relation in a positive direction
C)Weak linear relation in a positive direction
D)Strong linear relation in a positive direction
E)No evidence of relation
Unlock Deck
Unlock for access to all 74 flashcards in this deck.
Unlock Deck
k this deck
72
A reporter studied the causes of a fire to a house,and established thanks to a scatterplot a strong correlation between the damages (in dollars)and the number of firefighters at the scene.Find the lurking variable,if there is one.
A)Size of the blaze
B)Size of the house
C)Weather
D)Firefighters
E)No lurking variable
A)Size of the blaze
B)Size of the house
C)Weather
D)Firefighters
E)No lurking variable
Unlock Deck
Unlock for access to all 74 flashcards in this deck.
Unlock Deck
k this deck
73
A researcher studies children in elementary school and finds a strong positive linear association between shoe size and reading skills.Find the lurking variable,if there is one.
A)School
B)Grade of students
C)Shoe brand
D)Age
E)No lurking variable
A)School
B)Grade of students
C)Shoe brand
D)Age
E)No lurking variable
Unlock Deck
Unlock for access to all 74 flashcards in this deck.
Unlock Deck
k this deck
74
A study shows that the amount of chocolate consumed in Canada and the number of automobile accidents is positively related.Find the lurking variable,if there is one.
A)Vacation
B)Speed
C)Children
D)Population growth
E)No lurking variable
A)Vacation
B)Speed
C)Children
D)Population growth
E)No lurking variable
Unlock Deck
Unlock for access to all 74 flashcards in this deck.
Unlock Deck
k this deck
Unlock Deck
Unlock for access to all 74 flashcards in this deck.


