Exam 6: Scatterplots, association, and Correlation
Exam 1: Data30 Questions
Exam 2: Displaying and Describing Categorical Data65 Questions
Exam 3: Displaying and Summarizing Quantitative Data93 Questions
Exam 4: Understanding and Comparing Distributions102 Questions
Exam 5: The Standard Deviation As a Ruler and the Normal Model131 Questions
Exam 6: Scatterplots, association, and Correlation74 Questions
Exam 7: Linear Regression57 Questions
Exam 8: Regression Wisdom32 Questions
Exam 9: Re-Expressing Data: Get It Straight51 Questions
Exam 10: Understanding Randomness26 Questions
Exam 11: Sample Surveys50 Questions
Exam 12: Experiments and Observational Surveys87 Questions
Exam 13: From Randomness to Probability64 Questions
Exam 14: Probability Rules90 Questions
Exam 15: Random Variables112 Questions
Exam 16: Probability Models114 Questions
Exam 17: Sampling Distribution Models45 Questions
Exam 18: Confidence Intervals for Proportions56 Questions
Exam 19: Testing Hypotheses About Proportions50 Questions
Exam 20: More About Tests69 Questions
Exam 21: Comparing Two Proportions52 Questions
Exam 22: Inferences About Means106 Questions
Exam 23: Comparing Means43 Questions
Exam 24: Paired Samples and Blocks33 Questions
Exam 25: Comparing Counts78 Questions
Exam 26: Inferences for Regression51 Questions
Exam 27: Analysis of Variance39 Questions
Exam 28: Multifactor Analysis of Variance22 Questions
Exam 29: Multiple Regression22 Questions
Exam 30: Multiple Regression Wisdom21 Questions
Exam 31: Rank-Based Nonparametric Tests29 Questions
Exam 32: The Bootstrap31 Questions
Select questions type
The paired data below consist of the height (in cm)of children and their reading scores.If the height was recorded in inches,what would be the correlation? 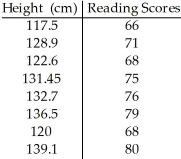
Free
(Multiple Choice)
4.9/5  (32)
(32)
Correct Answer: Verified
E
The paired data below consist of the height of children (in cm)and their reading scores. 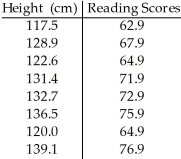
Free
(Multiple Choice)
4.8/5 (33)
Correct Answer:Verified
E
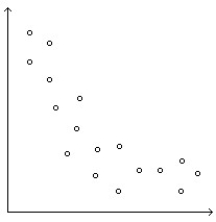
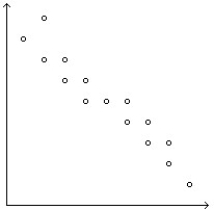
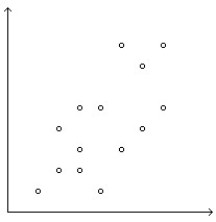
Determine whether the scatterplot shows little or no association, a negative association, a linear association, a moderately strong association, or a very strong association (multiple associations are possible).
-
Free
(Multiple Choice)
4.8/5 (30)
Correct Answer:Verified
D
Owners of a new computer store tracked sales (in thousands)for the first 12 days,and displayed the data in a scatterplot.Make a histogram of the daily sales since the shop has been in business. 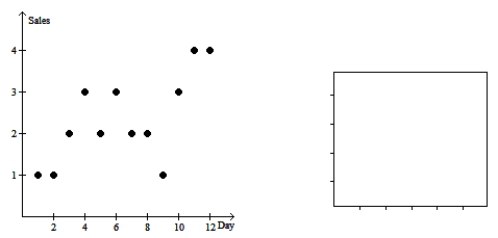
(Essay)
4.8/5 (33)
Determine whether the scatterplot shows little or no association, a negative association, a linear association, a moderately strong association, or a very strong association (multiple associations are possible).
-
(Multiple Choice)
4.8/5 (36)
A shop owner tries to predict the winter collection sales by displaying coat sales (in dollars)and the outside temperature (in degrees Fahrenheit)in the following scatterplot.Make a histogram of the coat sales. 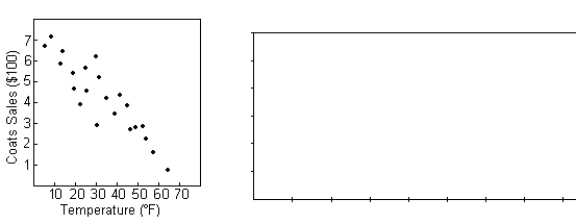
(Essay)
4.8/5 (41)
Data collected from students in Statistics classes included their heights (in inches)and weights (in pounds).For the students' heights and weights,the correlation is 0.653.Suppose the variable weight is recorded in kilograms rather than in pounds.What will be the correlation? 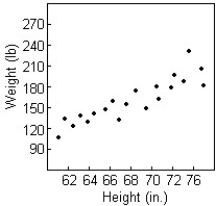
(Multiple Choice)
4.8/5 (30)
A science instructor assigns a group of students to investigate the linear relationship between the pH of the water of a river and its water's hardness (measured in grains).Some students wrote these conclusions: "My correlation of -0.85 shows that there is almost no association between pH of the water and water's hardness." Is the interpretation of the correlation appropriate?
(Multiple Choice)
5.0/5 (28)
A shop owner tries to predict heater sales by displaying the sales of hot chocolate and heaters on the following scatterplot.Does the scatterplot of hot chocolate sales and heater sales indicate that it is appropriate to calculate the correlation? 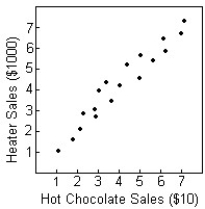
(Multiple Choice)
4.8/5 (32)
A study was conducted to compare the average time spent in the lab each week versus course grade for computer students.The results are recorded in the table below. 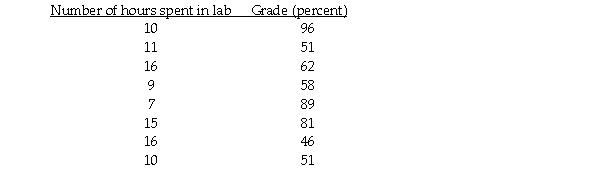
(Multiple Choice)
4.9/5 (30)
Determine whether the scatterplot shows little or no association, a negative association, a linear association, a moderately strong association, or a very strong association (multiple associations are possible).
-
(Multiple Choice)
4.8/5 (29)
A ceramics factory can fire six large batches of pottery per day.Sometimes in the process a few of the pieces break.In order to understand the problem better,the factory records the number of broken pieces in each batch for 4 days and then creates the scatterplot shown.Make a histogram showing the distribution of the number of broken pieces in the 24 batches of pottery examined. 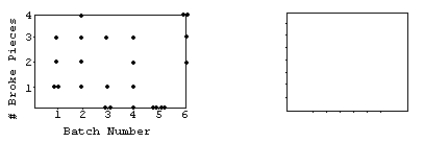
(Essay)
4.9/5 (34)
Several scatterplots are given with calculated correlations. Which is which?
-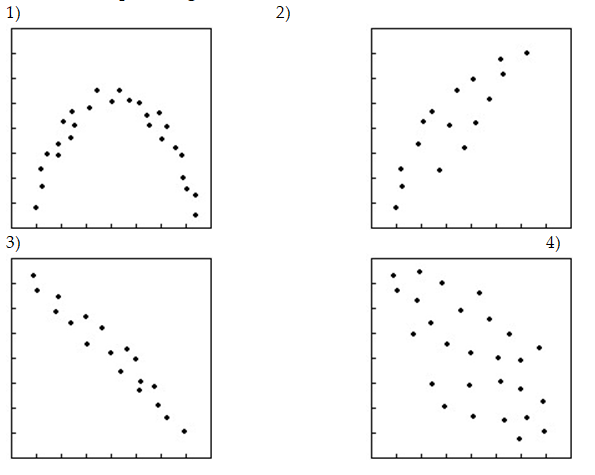 a)-0.993,b)-0.047,c)0.774,d)0.937
(Multiple Choice)
4.8/5 (36)
Litres remaining in a take of gas,kilometres driving since filling up.
(Multiple Choice)
4.8/5 (44)
Oranges: circumference (centimetres),oranges: weight (grams)
(Multiple Choice)
4.9/5 (36)
A study is conducted on the causes of flat feet,and shows a linear relation between age and having mechanical disturbances of the foot.The correlation between these two variables is 0.84.The report concludes that older people have greater chances to have flat feet.Is the calculation of the correlation appropriate?
(Multiple Choice)
4.9/5 (36)
A study of consumer behavior finds a positive correlation between sales of ice cream and sales of soda.What might explain the strong correlation?
(Multiple Choice)
4.8/5 (42)
Filters
- Essay(0)
- Multiple Choice(0)
- Short Answer(0)
- True False(0)
- Matching(0)