Deck 25: Comparing Counts
Full screen (f)
Question
The data will be analyzed to determine if they provide sufficient evidence to conclude that an association exists between car colour and the likelihood of being in an accident. 
A)

: Accidents and car colour are not related.

: Accidents and car colour are not dependent.
B)

: Accidents and car colour are independent.

: Accidents and car colour are not independent.
C)

: Accidents and car colour are related.

: Accidents and car colour are not related.
D)

: Accidents and car colour are independent.

: Accidents and car colour are not related.
E)

: Accidents are uniformly distributed over the car colours.

: Accidents are not uniformly distributed over the car colours.
A)
: Accidents and car colour are not related.
: Accidents and car colour are not dependent.
B)
: Accidents and car colour are independent.
: Accidents and car colour are not independent.
C)
: Accidents and car colour are related.
: Accidents and car colour are not related.
D)
: Accidents and car colour are independent.
: Accidents and car colour are not related.
E)
: Accidents are uniformly distributed over the car colours.
: Accidents are not uniformly distributed over the car colours.
Question
Suspecting that a die may be unfair,you want to investigate.To check,you roll it 90 times,recording the number of times each face appears. 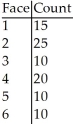
State your hypotheses.
A)

: The die is not fair.

: The die is fair (all faces have p = 1/6).
B)

: .The die is not fair.

: The die is fair (all faces have p = 1/2).
C)

: The die is fair (all faces have p = 1/6).

: The die is not fair.
D)

: The die is fair (all faces have p = 1/3).

: The die is not fair.
E)

: .The die is not fair.

: The die is fair (all faces have p = 1/3).
State your hypotheses.
A)
: The die is not fair.
: The die is fair (all faces have p = 1/6).
B)
: .The die is not fair.
: The die is fair (all faces have p = 1/2).
C)
: The die is fair (all faces have p = 1/6).
: The die is not fair.
D)
: The die is fair (all faces have p = 1/3).
: The die is not fair.
E)
: .The die is not fair.
: The die is fair (all faces have p = 1/3).
Question
A researcher performed a study to determine whether an association exists between sex and blood type.He obtained the following sample data. 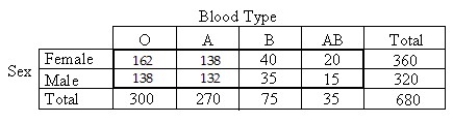
A)

: Gender and blood type are dependent.

: Gender and blood type are independent.
B)

: Blood types are not uniformly distributed over the genders.

: Blood types are uniformly distributed over the genders.
C)

: Gender and blood type are independent.

: Gender and blood type are not independent.
D)

: There is a relationship between gender and blood type.

: There is no relationship between gender and blood type.
E)

: Gender and blood type are dependent.

: Gender and blood type are not dependent.
A)
: Gender and blood type are dependent.
: Gender and blood type are independent.
B)
: Blood types are not uniformly distributed over the genders.
: Blood types are uniformly distributed over the genders.
C)
: Gender and blood type are independent.
: Gender and blood type are not independent.
D)
: There is a relationship between gender and blood type.
: There is no relationship between gender and blood type.
E)
: Gender and blood type are dependent.
: Gender and blood type are not dependent.
Question
A candy company claims that its bags of mixed suckers are 20% strawberry,30% cherry,15% apple,10% lemon,and 25% grape.A bag was purchased,and the number of each type of flavour was recorded in the chart below. 
A)Homogeneity
B)Goodness-of-fit
C)Independence
A)Homogeneity
B)Goodness-of-fit
C)Independence
Question
Suspecting that a die may be unfair,you want to investigate.To check,you roll it 54 times,recording the number of times each face appears. 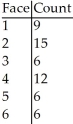
Find
.
A)1.000
B)2.000
C)4.000
D)8.000
E)10.000
Find
.
A)1.000
B)2.000
C)4.000
D)8.000
E)10.000
Question
A car insurance company performed a study to determine whether an association exists between age and the frequency of car accidents.They obtained the following sample data. 
A)Independence
B)Goodness-of-fit
C)Homogeneity
A)Independence
B)Goodness-of-fit
C)Homogeneity
Question
A researcher performed a study to determine whether political party affiliations are different for different income brackets.She obtained the following sample data.

A)Goodness-of-fit
B)Independence
C)Homogeneity
A)Goodness-of-fit
B)Independence
C)Homogeneity
Question
A researcher performed a study to determine whether an association exists between sex and blood type.He obtained the following sample data. 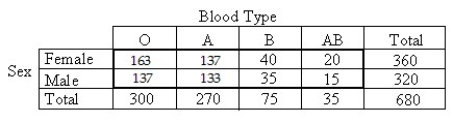
A)Independence
B)Goodness-of-fit
C)Homogeneity
A)Independence
B)Goodness-of-fit
C)Homogeneity
Question
Tests for adverse reactions to a new drug yielded the results given in the table.The data will be analyzed to determine if they provide sufficient evidence to conclude that an association exists between the treatment (drug or placebo)and the reaction (whether or not headaches were experienced). 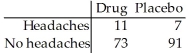
A)

: The distribution of headaches is different for the drug and the placebo.

: The distribution of headaches is the same for the drug and the placebo.
B)

: The drug is related to the occurrence of headaches.

: The drug is not related to the occurrence of headaches.
C)

: There is a relationship between the drug and occurrence of headaches.

: There is no relationship between the drug and occurrence of headaches.
D)

: The occurrence of headaches is dependent upon the drug.

: The occurrence of headaches is not dependent upon the drug.
E)

: The drug is independent from the occurrence of headaches.

: The drug is not independent from the occurrence of headaches.
A)
: The distribution of headaches is different for the drug and the placebo.
: The distribution of headaches is the same for the drug and the placebo.
B)
: The drug is related to the occurrence of headaches.
: The drug is not related to the occurrence of headaches.
C)
: There is a relationship between the drug and occurrence of headaches.
: There is no relationship between the drug and occurrence of headaches.
D)
: The occurrence of headaches is dependent upon the drug.
: The occurrence of headaches is not dependent upon the drug.
E)
: The drug is independent from the occurrence of headaches.
: The drug is not independent from the occurrence of headaches.
Question
You roll a die 48 times with the following results.Is the die fair? 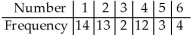
A)

: The die is not fair.

: The die is fair (all numbers occur with equal frequency).
Conclusion: Reject the null hypothesis.There is sufficient evidence to claim that the numbers on the die do not occur with equal frequency.
B)

: The die is not fair.

: The die is fair (all numbers occur with equal frequency).
Conclusion: Do not reject the null hypothesis.There is sufficient evidence to claim that the numbers on the die do not occur with equal frequency.
C)

: The die is fair (all numbers occur with equal frequency).

: The die is not fair.
Conclusion: Do not reject the null hypothesis.There is insufficient evidence to claim that the numbers on the die do not occur with equal frequency.
D)

: The die is fair (all numbers occur with equal frequency).

: The die is not fair.
Conclusion: Reject the null hypothesis.There is sufficient evidence to claim that the numbers on the die do not occur with equal frequency.
E)

: The die is not fair.

: The die is fair (all numbers occur with equal frequency).
Conclusion: Do not reject the null hypothesis.There is insufficient evidence to claim that the numbers on the die do not occur with equal frequency.
A)
: The die is not fair.
: The die is fair (all numbers occur with equal frequency).
Conclusion: Reject the null hypothesis.There is sufficient evidence to claim that the numbers on the die do not occur with equal frequency.
B)
: The die is not fair.
: The die is fair (all numbers occur with equal frequency).
Conclusion: Do not reject the null hypothesis.There is sufficient evidence to claim that the numbers on the die do not occur with equal frequency.
C)
: The die is fair (all numbers occur with equal frequency).
: The die is not fair.
Conclusion: Do not reject the null hypothesis.There is insufficient evidence to claim that the numbers on the die do not occur with equal frequency.
D)
: The die is fair (all numbers occur with equal frequency).
: The die is not fair.
Conclusion: Reject the null hypothesis.There is sufficient evidence to claim that the numbers on the die do not occur with equal frequency.
E)
: The die is not fair.
: The die is fair (all numbers occur with equal frequency).
Conclusion: Do not reject the null hypothesis.There is insufficient evidence to claim that the numbers on the die do not occur with equal frequency.
Question
Suspecting that a die may be unfair,you want to investigate.To check,you roll it 54 times,recording the number of times each face appears. 
How many degrees of freedom are there?
A)12
B)6
C)3
D)5
E)16
How many degrees of freedom are there?
A)12
B)6
C)3
D)5
E)16
Question
A die is rolled 180 times and the following data are obtained.Is the die fair? 
A)

: The die is not fair.

: The die is fair (all numbers occur with equal frequency).
Conclusion: Do not reject the null hypothesis.There is insufficient evidence to claim that the numbers on the die do not occur with equal frequency.
B)

: The die is not fair.

: The die is fair (all numbers occur with equal frequency).
Conclusion: Do not reject the null hypothesis.There is sufficient evidence to claim that the numbers on the die do not occur with equal frequency.
C)

: The die is fair (all numbers occur with equal frequency).

: The die is not fair.
Conclusion: Do not reject the null hypothesis.The data do not provide sufficient evidence to conclude that the die is loaded.
D)

: The die is fair (all numbers occur with equal frequency).

: The die is not fair.
Conclusion: Reject the null hypothesis.There is sufficient evidence to claim that the numbers on the die do not occur with equal frequency.
E)

: The die is not fair.

: The die is fair (all numbers occur with equal frequency).
Conclusion: Reject the null hypothesis.There is sufficient evidence to claim that the numbers on the die do not occur with equal frequency.
A)
: The die is not fair.
: The die is fair (all numbers occur with equal frequency).
Conclusion: Do not reject the null hypothesis.There is insufficient evidence to claim that the numbers on the die do not occur with equal frequency.
B)
: The die is not fair.
: The die is fair (all numbers occur with equal frequency).
Conclusion: Do not reject the null hypothesis.There is sufficient evidence to claim that the numbers on the die do not occur with equal frequency.
C)
: The die is fair (all numbers occur with equal frequency).
: The die is not fair.
Conclusion: Do not reject the null hypothesis.The data do not provide sufficient evidence to conclude that the die is loaded.
D)
: The die is fair (all numbers occur with equal frequency).
: The die is not fair.
Conclusion: Reject the null hypothesis.There is sufficient evidence to claim that the numbers on the die do not occur with equal frequency.
E)
: The die is not fair.
: The die is fair (all numbers occur with equal frequency).
Conclusion: Reject the null hypothesis.There is sufficient evidence to claim that the numbers on the die do not occur with equal frequency.
Question
A publishing company performs sample surveys to obtain information on characteristics of book readers.A book reader is defined to be one who read one or more books in the six months prior to the survey;a non-book reader is defined to be one who read newspapers or magazines but no books in the six months prior to the survey;a nonreader is defined to be one who did not read a book,newspaper,or magazine in the six months prior to the survey.The following data were obtained from a random sample of 1429 persons 16 years old and over in an effort to determine whether or not the proportions of book readers,non-book readers,and non-readers are the same for each income bracket. 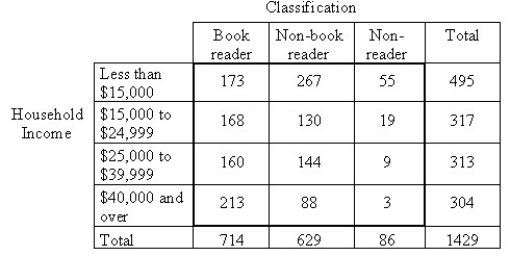
A)Goodness-of-fit
B)Independence
C)Homogeneity
A)Goodness-of-fit
B)Independence
C)Homogeneity
Question
Suspecting that a die may be unfair,you want to investigate.To check,you roll it 36 times,recording the number of times each face appears. 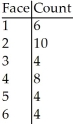
To see if these results are unusual,will you test goodness-of-fit,homogeneity,or independence?
A)Independence
B)Goodness-of-fit
C)Homogeneity
To see if these results are unusual,will you test goodness-of-fit,homogeneity,or independence?
A)Independence
B)Goodness-of-fit
C)Homogeneity
Question
Tests for adverse reactions to a new drug yielded the results given in the table.The data will be analyzed to determine if there is sufficient evidence to conclude that an association exists between the treatment (drug or placebo)and the reaction (whether or not headaches were experienced). 
A)Goodness-of-fit
B)Homogeneity
C)Independence
A)Goodness-of-fit
B)Homogeneity
C)Independence
Question
A die,suspected of being unfair,was rolled 50 times.The number of times each face appeared was recorded in the following table. 
A)Homogeneity
B)Goodness-of-fit
C)Independence
A)Homogeneity
B)Goodness-of-fit
C)Independence
Question
The following data were collected to determine whether or not the retirement age is the same for people in different professions. 
A)Independence
B)Homogeneity
C)Goodness-of-fit
A)Independence
B)Homogeneity
C)Goodness-of-fit
Question
A car insurance company performed a study to determine whether an association exists between age and the frequency of car accidents.They obtained the following sample data. 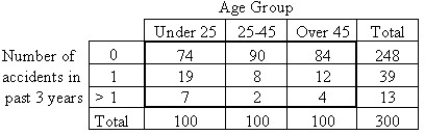
A)

: Number of accidents in the past three years has the same distribution for each age group.

: Number of accidents in the past three years does not have the same distribution for each age group.
B)

: Number of accidents in the past three years and age group are not dependent.

: Number of accidents in the past three years and age group are independent.
C)

: Number of accidents in the past three years and age group are dependent.

: Number of accidents in the past three years and age group are not dependent.
D)

: Number of accidents in the past three years and age group are independent.

: Number of accidents in the past three years and age group are not dependent.
E)

: Number of accidents in the past three years and age group are independent.

: Number of accidents in the past three years and age group are not independent.
A)
: Number of accidents in the past three years has the same distribution for each age group.
: Number of accidents in the past three years does not have the same distribution for each age group.
B)
: Number of accidents in the past three years and age group are not dependent.
: Number of accidents in the past three years and age group are independent.
C)
: Number of accidents in the past three years and age group are dependent.
: Number of accidents in the past three years and age group are not dependent.
D)
: Number of accidents in the past three years and age group are independent.
: Number of accidents in the past three years and age group are not dependent.
E)
: Number of accidents in the past three years and age group are independent.
: Number of accidents in the past three years and age group are not independent.
Question
The data will be analyzed to determine if they provide sufficient evidence to conclude that an association exists between car colour and the likelihood of being in an accident. 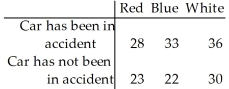
A)Independence
B)Goodness-of-fit
C)Homogeneity
A)Independence
B)Goodness-of-fit
C)Homogeneity
Question
Suspecting that a die may be unfair,you want to investigate.To check,you roll it 18 times,recording the number of times each face appears. 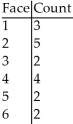
If the die is fair,how many times would you expect each face to show?
A)2
B)6
C)3
D)4
E)1
If the die is fair,how many times would you expect each face to show?
A)2
B)6
C)3
D)4
E)1
Question
Question
Test the claim that the responses occur with percentages of 15%,20%,25%,25%,and 15% respectively.Use a 10% level of significance. 
Question
The two-way table summarizes data from the human resource department at a university:
New Hires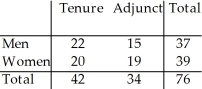
What is the probability (rounded to three decimal places)that a new hire is female?
A)0.487
B)0.434
C)0.513
D)0.250
E)0
New Hires
What is the probability (rounded to three decimal places)that a new hire is female?
A)0.487
B)0.434
C)0.513
D)0.250
E)0
Question
A die,suspected of being unfair,was rolled 50 times.The number of times each face appeared was recorded in the following table. 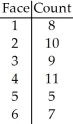
A)

: The counts are normally distributed over the faces.

: The counts are not normally distributed over the faces.
B)

: The counts and faces are independent.

: The counts and faces are not independent.
C)

: The counts and faces are not independent.

: The counts and faces are independent.
D)

: The counts are not uniformly distributed over the faces.

: The counts are uniformly distributed over the faces.
E)

: The counts are uniformly distributed over the faces.

: The counts are not uniformly distributed over the faces.
A)
: The counts are normally distributed over the faces.
: The counts are not normally distributed over the faces.
B)
: The counts and faces are independent.
: The counts and faces are not independent.
C)
: The counts and faces are not independent.
: The counts and faces are independent.
D)
: The counts are not uniformly distributed over the faces.
: The counts are uniformly distributed over the faces.
E)
: The counts are uniformly distributed over the faces.
: The counts are not uniformly distributed over the faces.
Question
The two-way table summarizes data from the human resource department at a university:
New Hires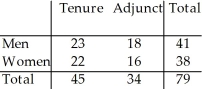
What is the probability (rounded to three decimal places)that a female new hire is adjunct?
A)0.342
B)0
C)0.430
D)0.203
E)0.421
New Hires
What is the probability (rounded to three decimal places)that a female new hire is adjunct?
A)0.342
B)0
C)0.430
D)0.203
E)0.421
Question
A candy company claims that its bags of mixed suckers are 20% strawberry,30% cherry,15% apple,10% lemon,and 25% grape.A bag was purchased,and the number of each type of flavour was recorded in the chart below. 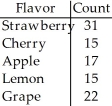
A)

: The distribution of flavours is not the same as the distribution claimed by the company.

: The distribution of flavours is the same as the distribution claimed by the company.
B)

: The distribution of flavours is the same as the distribution claimed by the company.

: The distribution of flavours is not the same as the distribution claimed by the company.
C)

: The distribution of flavours is not uniform.

: The distribution of flavours is uniform.
D)

: The distribution of flavours is uniform.

: The distribution of flavours is not uniform.
E)

: The flavours and counts are independent.

: The flavours and counts are not independent.
A)
: The distribution of flavours is not the same as the distribution claimed by the company.
: The distribution of flavours is the same as the distribution claimed by the company.
B)
: The distribution of flavours is the same as the distribution claimed by the company.
: The distribution of flavours is not the same as the distribution claimed by the company.
C)
: The distribution of flavours is not uniform.
: The distribution of flavours is uniform.
D)
: The distribution of flavours is uniform.
: The distribution of flavours is not uniform.
E)
: The flavours and counts are independent.
: The flavours and counts are not independent.
Question
The two-way table summarizes data from the human resource department at a university:
New Hires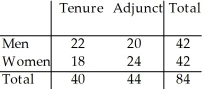
What is the probability (rounded to three decimal places)that a male new hire is tenure track?
A)0.643
B)0.476
C)0.524
D)0.262
E)0
New Hires
What is the probability (rounded to three decimal places)that a male new hire is tenure track?
A)0.643
B)0.476
C)0.524
D)0.262
E)0
Question
Question
The following data were collected to determine whether or not the retirement age is the same for people in different professions. 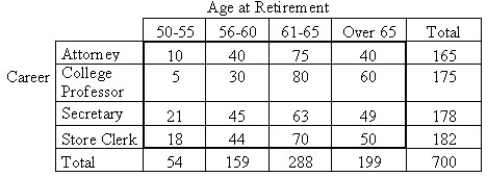
A)

: Age at retirement and job are related.

: Age at retirement and job are unrelated.
B)

: Age at retirement and job are not independent.

: Age at retirement and job are dependent.
C)

: The retirement age has a different distribution for people in the different professions.

: The retirement age has the same distribution for people in the different professions.
D)

: Age at retirement and job are dependent.

: Age at retirement and job are not dependent.
E)

: The retirement age has the same distribution for people in the different professions.

: The retirement age has a different distribution for people in the different professions.
A)
: Age at retirement and job are related.
: Age at retirement and job are unrelated.
B)
: Age at retirement and job are not independent.
: Age at retirement and job are dependent.
C)
: The retirement age has a different distribution for people in the different professions.
: The retirement age has the same distribution for people in the different professions.
D)
: Age at retirement and job are dependent.
: Age at retirement and job are not dependent.
E)
: The retirement age has the same distribution for people in the different professions.
: The retirement age has a different distribution for people in the different professions.
Question
In studying the responses to a multiple-choice test question,the following sample data were obtained.Are the responses uniformly distributed? Use a 10% level of significance. 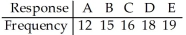
Question
A researcher wishes to test the effectiveness of a flu vaccination.Fifty randomly selected people are vaccinated,80 randomly selected people are vaccinated with a placebo,and 300 randomly selected people are not vaccinated.The number in each group who later caught the flu was recorded.The results are shown below. 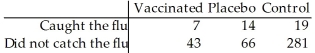
A)Yes
B)No,because the data are quantitative.
C)No,because the data do not appear to be random.
D)No,because the expected cell frequency condition is violated.
E)No,because the observed counts are too close to the expected counts.
A)Yes
B)No,because the data are quantitative.
C)No,because the data do not appear to be random.
D)No,because the expected cell frequency condition is violated.
E)No,because the observed counts are too close to the expected counts.
Question
The two-way table summarizes data from the human resource department at a university:
New Hires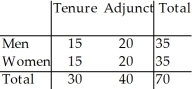
What is the probability (rounded to two decimal places)that a randomly selected new hire is a tenure-track woman?
A)0
B)0.21
C)0.43
D)0.15
E)0.50
New Hires
What is the probability (rounded to two decimal places)that a randomly selected new hire is a tenure-track woman?
A)0
B)0.21
C)0.43
D)0.15
E)0.50
Question
Question
The two-way table summarizes data from the human resource department at a university:
New Hires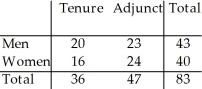
What is the probability (rounded to three decimal places)that a tenure-track new hire is female?
A)0.434
B)0.400
C)0.444
D)0
E)0.193
New Hires
What is the probability (rounded to three decimal places)that a tenure-track new hire is female?
A)0.434
B)0.400
C)0.444
D)0
E)0.193
Question
A researcher performed a study to determine whether an association exists between sex and blood type.He obtained the following data from a random sample. 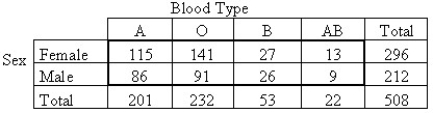
A)No,because the data are quantitative.
B)No,because the sample does not appear to be random.
C)No,because the expected cell frequency condition is violated.
D)Yes
E)No,because it is not possible to find the residuals.
A)No,because the data are quantitative.
B)No,because the sample does not appear to be random.
C)No,because the expected cell frequency condition is violated.
D)Yes
E)No,because it is not possible to find the residuals.
Question
The two-way table summarizes data from the human resource department at a university:
New Hires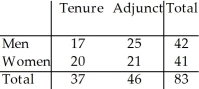
What is the probability (rounded to two decimal places)of a randomly selected new hire being tenure track given that the new hire is a woman?
A)0
B)0.51
C)0.49
D)0.20
E)0.24
New Hires
What is the probability (rounded to two decimal places)of a randomly selected new hire being tenure track given that the new hire is a woman?
A)0
B)0.51
C)0.49
D)0.20
E)0.24
Question
A company manager wishes to test a union leader's claim that absences occur on the different week days with the same frequencies.Are absences uniformly distributed over the week? Use a 1% level of significance. 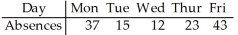
Question
In studying the occurrence of genetic characteristics,the following sample data were obtained.Are they uniformly distributed? Use a 10% level of significance. 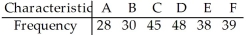
Question
A publishing company performs sample surveys to obtain information on characteristics of book readers.A book reader is defined to be one who read one or more books in the six months prior to the survey;a non-book reader is defined to be one who read newspapers or magazines but no books in the six months prior to the survey;a nonreader is defined to be one who did not read a book,newspaper,or magazine in the six months prior to the survey.The following data were obtained from a random sample of 1429 persons 16 years old and over in an effort to determine whether or not the proportions of book readers,non-book readers,and non-readers are the same for each income bracket. 
A)

: There is no relationship between household income and book readership.

: Household income and book readership are not related.
B)

: The classifications do not have the same distribution for each household income bracket.

: The classifications have the same distribution for each household income bracket.
C)

: Household income and book readership are independent.

: Household income and book readership are not dependent.
D)

: The classifications have the same distribution for each household income bracket.

: The classifications do not have the same distribution for each household income bracket.
E)

: There is a relationship between household income and book readership.

: Household income and book readership are not related.
A)
: There is no relationship between household income and book readership.
: Household income and book readership are not related.
B)
: The classifications do not have the same distribution for each household income bracket.
: The classifications have the same distribution for each household income bracket.
C)
: Household income and book readership are independent.
: Household income and book readership are not dependent.
D)
: The classifications have the same distribution for each household income bracket.
: The classifications do not have the same distribution for each household income bracket.
E)
: There is a relationship between household income and book readership.
: Household income and book readership are not related.
Question
A researcher performed a study to determine whether political party affiliations are different for different income brackets.She obtained the following sample data. 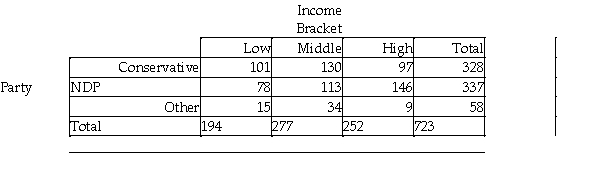
A)

: There is a relationship between political party affiliation and income.

: Income and political party affiliation have no relationship.
B)

: Political party affiliation is uniformly distributed over the income brackets.

: Party affiliation is not uniformly distributed over the income brackets.
C)

: Income and political party affiliation are dependent.

: Income and political party affiliation are not dependent.
D)

: Political party affiliation does not have the same distribution for each income bracket.

: Political party affiliation has the same distribution for each income bracket.
E)

: Political party affiliation has the same distribution for each income bracket.

: Political party affiliation does not have the same distribution for each income bracket.
A)
: There is a relationship between political party affiliation and income.
: Income and political party affiliation have no relationship.
B)
: Political party affiliation is uniformly distributed over the income brackets.
: Party affiliation is not uniformly distributed over the income brackets.
C)
: Income and political party affiliation are dependent.
: Income and political party affiliation are not dependent.
D)
: Political party affiliation does not have the same distribution for each income bracket.
: Political party affiliation has the same distribution for each income bracket.
E)
: Political party affiliation has the same distribution for each income bracket.
: Political party affiliation does not have the same distribution for each income bracket.
Question
A car insurance company performed a study to determine whether an association exists between age and the frequency of car accidents.They obtained the following sample data. 
Does the data provide sufficient evidence to conclude that an association exists between age and frequency of car accidents? Use a 5% level of significance.
Does the data provide sufficient evidence to conclude that an association exists between age and frequency of car accidents? Use a 5% level of significance.
Question
A researcher performed a study to determine whether an association exists between gender and blood type.He obtained the following sample data. 
Does the data provide sufficient evidence to conclude that an association exists between gender and blood type? Use a 5% level of significance.
Does the data provide sufficient evidence to conclude that an association exists between gender and blood type? Use a 5% level of significance.
Question
Test the claim that the proportion of men who plan to vote in the next election is the same as the proportion of women who plan to vote.300 men and 300 women were randomly selected and asked whether they planned to vote in the next election.The results are shown below.Use a 10% level of significance. 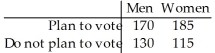
Question
A researcher performed a study to determine whether an association exists between political party affiliation and income.She obtained the following sample data.Use a 1% level of significance. 

= 27.831;P-value = 0.0000135
A)Reject the null hypothesis.The data provide sufficient evidence to conclude that political party affiliation is distributed uniformly for each income bracket.
B)Do not reject the null hypothesis.There is insufficient evidence to conclude that there is a relationship between income and political party affiliation.
C)Reject the null hypothesis.The data provide sufficient evidence to conclude that there is a relationship between income and political party affiliation.
D)Do not reject the null hypothesis.The data provide sufficient evidence to conclude that there is a relationship between income and political party affiliation.
E)Reject the null hypothesis.There is insufficient evidence to conclude that there is a relationship between income and political party affiliation.
Question
A researcher wishes to test the effectiveness of a flu vaccination.150 people are vaccinated,180 people are vaccinated with a placebo,and 100 people are not vaccinated.The number in each group who later caught the flu was recorded.The results are shown below. 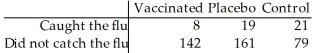
Are the proportions of people catching the flu the same in all three groups? Use a 1% level of significance.
Are the proportions of people catching the flu the same in all three groups? Use a 1% level of significance.
Question
A publishing company performs sample surveys to obtain information on characteristics of book readers.A book reader is defined to be one who read one or more books in the six months prior to the survey;a non-book reader is defined to be one who read newspapers or magazines but no books in the six months prior to the survey;a nonreader is defined to be one who did not read a book,newspaper,or magazine in the six months prior to the survey.The following data were obtained in a random sample of 1429 persons 16 years old and over in an effort to determine whether or not the proportions of book readers,non-book readers,and non-readers are the same for each income bracket.Use a 1% level of significance. 

= 114.534;P-value = 2.287 ×
A)There is not sufficient evidence to reject the null hypothesis and conclude that the distributions of reader classification and household income are different.
B)There is sufficient evidence to reject the null hypothesis and conclude that the distributions of reader classification and household income are the same.
C)There is sufficient evidence to reject the null hypothesis and conclude that the distributions of reader classification and household income are different.
D)There is sufficient evidence to reject the null hypothesis and conclude that the reader classification is dependent on household income.
E)There is not sufficient evidence to reject the null hypothesis and conclude that the distributions of reader classification and household income are the same.
Question
Research is conducted regarding the average age at retirement for four career groups.To test whether there is a relationship between age of retirement and career in these groups,700 employees,recently retired,are randomly selected.The resulting data are displayed in the contingency table below. 
Does the data provide sufficient evidence to conclude that an association exists between age of retirement and career? Use a 5% level of significance.
Does the data provide sufficient evidence to conclude that an association exists between age of retirement and career? Use a 5% level of significance.
Question
Tests for adverse reactions to a new drug yielded the results given in the table.Use a 10% level of significance. 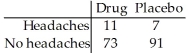

= 1.798;P-value = 0.1799
The data will be analyzed to determine if there is sufficient evidence to conclude that an association exists between the treatment (drug or placebo)and the reaction (whether or not headaches were experienced).
A)Do not reject the null hypothesis.Report that there is insufficient evidence to conclude that the distribution of headaches is uniform for the drug and placebo.
B)Reject the null hypothesis.Report that there is sufficient evidence to conclude that treatment and reaction are dependent.
C)Reject the null hypothesis.Report that there is insufficient evidence to conclude that treatment and reaction are dependent.
D)Do not reject the null hypothesis.Report that there is sufficient evidence to conclude that treatment and reaction are dependent.
E)Do not reject the null hypothesis.Report that there is insufficient evidence to conclude that treatment and reaction are dependent.
Question
Responses to a survey question are broken down according to employment status and the sample results are given below.Are the response and employment status independent? Use a 1% level of significance. 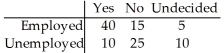
Question
At a high school debate tournament,half of the teams were asked to wear suits and ties and the rest were asked to wear jeans and t-shirts.The results are given in the table below.Is the proportion of wins the same for teams wearing suits as for teams wearing jeans? Use a 10% level of significance. 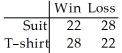
Question
A researcher wishes to test whether the proportion of college students who smoke is the same in four different colleges.She randomly selects 100 students from each college and records the number that smoke.The results are shown below. 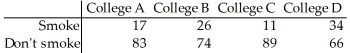
Are the proportions of students smoking the same for all four colleges? Use a 1% level of significance.
Are the proportions of students smoking the same for all four colleges? Use a 1% level of significance.
Question
A researcher performed a study to determine whether an association exists between political party affiliation and income.She obtained the following sample data. 
Does the data provide sufficient evidence to conclude that an association exists between political party affiliation and income? Use a 1% level of significance.
Does the data provide sufficient evidence to conclude that an association exists between political party affiliation and income? Use a 1% level of significance.
Question
Tests for adverse reactions to a new drug yielded the results given in the table.Is the treatment (drug or placebo)independent of the reaction (whether or not headaches were experienced)? Use a 5% level of significance. 
Question
Research is conducted regarding the average age at retirement for four career groups.To test whether there is a relationship between age of retirement and career in these groups,700 employees,recently retired,are randomly selected.The resulting data are displayed in the contingency table below.Use a 5% level of significance. 

= 20.77;P-value = 0.0137
A)Do not reject the null hypothesis and conclude that career and retirement age are related.
B)Reject the null hypothesis and conclude that the age at retirement is uniformly distributed for each career.
C)Do not reject the null hypothesis and conclude that career and retirement age are independent.
D)Reject the null hypothesis and conclude that career and retirement age are related.
E)Reject the null hypothesis and conclude that career and retirement age are independent.
Question
A study conducted for a woman's magazine indicates that the number of children desired by newly-married Canadian couples is distributed as follows. 
A random sample of 600 couples in Ontario resulted in the following data.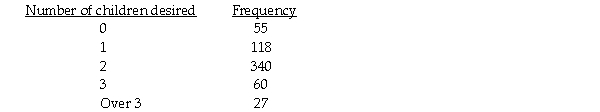
Ontario couples is different from that of the Canadian population as a whole? Use a 5% level of significance.
A random sample of 600 couples in Ontario resulted in the following data.
Ontario couples is different from that of the Canadian population as a whole? Use a 5% level of significance.
Question
A car insurance company performed a study to determine whether an association exists between age and the frequency of car accidents.They obtained the following sample data.Use a 5% level of significance. 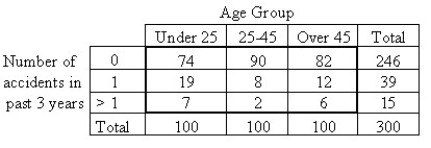

= 9.13;P-value = 0.0579
A)Do not reject the null hypothesis.One can conclude that there is a relationship between age and number of accidents.
B)Do not reject the null hypothesis.The data do not provide sufficient evidence to conclude that the number of accidents is distributed uniformly for each age group.
C)Reject the null hypothesis.One cannot conclude that there is a relationship between age and number of accidents.
D)Do not reject the null hypothesis.The data do not provide sufficient evidence to conclude that there is an association between age and frequency of car accidents.
E)Reject the null hypothesis.One can conclude that there is a relationship between age and number of accidents.
Question
160 students who were majoring in either math or English were asked a test question,and the researcher recorded whether they answered the question correctly.The sample results are given below.Are the response and major are independent? Use a 5% level of significance. 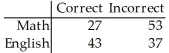
Question
Responses to a survey question are broken down according to gender and the sample results are given below.Are the response and gender are independent? 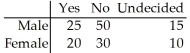
Question
Use the sample data below to test whether car colour affects the likelihood of being in an accident.Use a 5% level of significance. 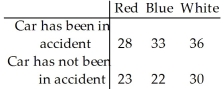
Question
The table below shows the age and favorite type of music of 668 randomly selected people. 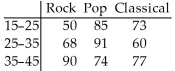
Are age and preferred music type are associated? Use a 5% level of significance.
Are age and preferred music type are associated? Use a 5% level of significance.
Question
The table below shows the age and favorite type of music of 668 randomly selected people.Use a 5% level of significance. 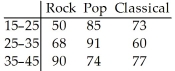

= 12.954;P-value = 0.0115
A)Reject the null hypothesis and conclude that the age distribution is not the same for each type of music.
B)Do not reject the null hypothesis and conclude that the age distribution is the same for each type of music.
C)Do not reject the null hypothesis and conclude that the age distribution is not the same for each type of music.
D)Reject the null hypothesis and conclude that the age distribution is uniform for each type of music.
E)Reject the null hypothesis and conclude that the age distribution is the same for each type of music.
Question
A researcher wishes to test whether the proportion of college students who smoke is the same in four different colleges.She randomly selects 100 students from each college and records the number that smoke.The results are shown below. 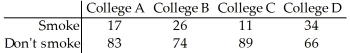
Test statistic: χ2 = 17.832
P-value = 0.0004763
Test statistic: χ2 = 17.832
P-value = 0.0004763
Question
Research is conducted regarding the average age at retirement for four career groups.To test whether there is a relationship between age of retirement and career in these groups,700 employees,recently retired,are randomly selected.The resulting data are displayed in the contingency table below. 
How many degrees of freedom are there for the chi-square test statistic?
A)12
B)9
C)16
D)20
E)25
How many degrees of freedom are there for the chi-square test statistic?
A)12
B)9
C)16
D)20
E)25
Question
Question
In order to test a claim about the effectiveness of a flu vaccine,150 people were vaccinated,180 people were vaccinated with a placebo,and 100 people were not vaccinated.The number in each group who later caught the flu was recorded.The researcher wishes to test the claim that the proportion of people who catch the flu is the same for all three groups.The results are shown below. 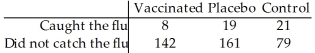
Test statistic: χ2 = 14.965
P-value = 0.0005627
Test statistic: χ2 = 14.965
P-value = 0.0005627
Question
Question
Question
Suppose that a chi-square goodness-of-fit test is to be performed.Is it true or false that the more closely the observed frequencies match the frequencies that would be expected if the null hypothesis were true,the larger the value of the test statistic  = Σ
= Σ  ?
?
= Σ ? Question
Question
Question
Question
In studying the occurrence of genetic characteristics,the following sample data were obtained.Do the characteristics occur with the same frequency? Use a 10% level of significance. 
Χ2 = 8.263;P-value = 0.1423
A)Reject the null hypothesis.There is sufficient evidence to warrant rejection of the claim that the characteristics occur with the same frequency.
B)Fail to reject the null hypothesis.There is not sufficient evidence to warrant rejection of the claim that the characteristics occur with the same frequency.
C)Fail to reject the null hypothesis.There is not sufficient evidence to warrant rejection of the claim that the characteristics are independent.
D)Fail to reject the null hypothesis.There is sufficient evidence to warrant rejection of the claim that the characteristics occur with the same frequency.
E)Reject the null hypothesis.There is not sufficient evidence to warrant rejection of the claim that the characteristics occur with the same frequency.
Question
Question
A company manager wishes to test a union leader's claim that absences occur on the different week days with the same frequencies.He compiled the following data. 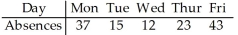
Test statistic: χ2 = 28.308
P-value = 0.0000108
Test statistic: χ2 = 28.308
P-value = 0.0000108
Question
The sample data below was tested to determine whether car colour is related to the likelihood of being in an accident. 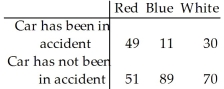
Test statistic: χ2 =34.38
P-value = 3.42 ×
Test statistic: χ2 =34.38
P-value = 3.42 ×
Question
160 students who were majoring in either math or English were asked a test question,and the researcher recorded whether they answered the question correctly.The sample results are given below. 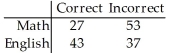

= 6.502;P-value = 0.011
Are the response and major independent? Use a 5% level of significance.
A)Report that the distribution of correct answers is uniform for both majors because the null hypothesis is rejected.
B)Report that response is not dependent on major because the null hypothesis is rejected.
C)Report that response is not dependent on major because the null hypothesis is not rejected.
D)Report that response is dependent on major because the null hypothesis is rejected.
E)Report that response is dependent on major because the null hypothesis is not rejected.
Question
A die is rolled 180 times and the following data are obtained. 
A chi-square test was conducted to determine whether or not the die is loaded (i.e. ,that the six numbers are not equally likely).Use a 5% level of significance.
= 11.8;P-value = 0.03763
A)Reject the null hypothesis.The data provide sufficient evidence to conclude that the die is loaded.
B)Reject the null hypothesis.The data provide sufficient evidence to conclude that the die is fair.
C)Do not reject the null hypothesis.The data provide sufficient evidence to conclude that the die is loaded.
D)Do not reject the null hypothesis.The data do not provide sufficient evidence to conclude that the die is loaded.
E)Reject the null hypothesis.The data do not provide sufficient evidence to conclude that the die is loaded.
Question

Unlock Deck
Sign up to unlock the cards in this deck!
Unlock Deck
Unlock Deck
1/78
Play
Full screen (f)
Deck 25: Comparing Counts
1
The data will be analyzed to determine if they provide sufficient evidence to conclude that an association exists between car colour and the likelihood of being in an accident.
A)
: Accidents and car colour are not related.
: Accidents and car colour are not dependent.
B)
: Accidents and car colour are independent.
: Accidents and car colour are not independent.
C)
: Accidents and car colour are related.
: Accidents and car colour are not related.
D)
: Accidents and car colour are independent.
: Accidents and car colour are not related.
E)
: Accidents are uniformly distributed over the car colours.
: Accidents are not uniformly distributed over the car colours.
: Accidents and car colour are independent.
: Accidents and car colour are not independent.
2
Suspecting that a die may be unfair,you want to investigate.To check,you roll it 90 times,recording the number of times each face appears.
State your hypotheses.
A)
: The die is not fair.
: The die is fair (all faces have p = 1/6).
B)
: .The die is not fair.
: The die is fair (all faces have p = 1/2).
C)
: The die is fair (all faces have p = 1/6).
: The die is not fair.
D)
: The die is fair (all faces have p = 1/3).
: The die is not fair.
E)
: .The die is not fair.
: The die is fair (all faces have p = 1/3).
: The die is fair (all faces have p = 1/6).
: The die is not fair.
3
A researcher performed a study to determine whether an association exists between sex and blood type.He obtained the following sample data.
A)
: Gender and blood type are dependent.
: Gender and blood type are independent.
B)
: Blood types are not uniformly distributed over the genders.
: Blood types are uniformly distributed over the genders.
C)
: Gender and blood type are independent.
: Gender and blood type are not independent.
D)
: There is a relationship between gender and blood type.
: There is no relationship between gender and blood type.
E)
: Gender and blood type are dependent.
: Gender and blood type are not dependent.
: Gender and blood type are independent.
: Gender and blood type are not independent.
4
A candy company claims that its bags of mixed suckers are 20% strawberry,30% cherry,15% apple,10% lemon,and 25% grape.A bag was purchased,and the number of each type of flavour was recorded in the chart below.
A)Homogeneity
B)Goodness-of-fit
C)Independence
A)Homogeneity
B)Goodness-of-fit
C)Independence
Unlock Deck
Unlock for access to all 78 flashcards in this deck.
Unlock Deck
k this deck
5
Suspecting that a die may be unfair,you want to investigate.To check,you roll it 54 times,recording the number of times each face appears.
Find
.
A)1.000
B)2.000
C)4.000
D)8.000
E)10.000
Find
.
A)1.000
B)2.000
C)4.000
D)8.000
E)10.000
Unlock Deck
Unlock for access to all 78 flashcards in this deck.
Unlock Deck
k this deck
6
A car insurance company performed a study to determine whether an association exists between age and the frequency of car accidents.They obtained the following sample data.
A)Independence
B)Goodness-of-fit
C)Homogeneity
A)Independence
B)Goodness-of-fit
C)Homogeneity
Unlock Deck
Unlock for access to all 78 flashcards in this deck.
Unlock Deck
k this deck
7
A researcher performed a study to determine whether political party affiliations are different for different income brackets.She obtained the following sample data.
A)Goodness-of-fit
B)Independence
C)Homogeneity
A)Goodness-of-fit
B)Independence
C)Homogeneity
Unlock Deck
Unlock for access to all 78 flashcards in this deck.
Unlock Deck
k this deck
8
A researcher performed a study to determine whether an association exists between sex and blood type.He obtained the following sample data.
A)Independence
B)Goodness-of-fit
C)Homogeneity
A)Independence
B)Goodness-of-fit
C)Homogeneity
Unlock Deck
Unlock for access to all 78 flashcards in this deck.
Unlock Deck
k this deck
9
Tests for adverse reactions to a new drug yielded the results given in the table.The data will be analyzed to determine if they provide sufficient evidence to conclude that an association exists between the treatment (drug or placebo)and the reaction (whether or not headaches were experienced).
A)
: The distribution of headaches is different for the drug and the placebo.
: The distribution of headaches is the same for the drug and the placebo.
B)
: The drug is related to the occurrence of headaches.
: The drug is not related to the occurrence of headaches.
C)
: There is a relationship between the drug and occurrence of headaches.
: There is no relationship between the drug and occurrence of headaches.
D)
: The occurrence of headaches is dependent upon the drug.
: The occurrence of headaches is not dependent upon the drug.
E)
: The drug is independent from the occurrence of headaches.
: The drug is not independent from the occurrence of headaches.
Unlock Deck
Unlock for access to all 78 flashcards in this deck.
Unlock Deck
k this deck
10
You roll a die 48 times with the following results.Is the die fair?
A)
: The die is not fair.
: The die is fair (all numbers occur with equal frequency).
Conclusion: Reject the null hypothesis.There is sufficient evidence to claim that the numbers on the die do not occur with equal frequency.
B)
: The die is not fair.
: The die is fair (all numbers occur with equal frequency).
Conclusion: Do not reject the null hypothesis.There is sufficient evidence to claim that the numbers on the die do not occur with equal frequency.
C)
: The die is fair (all numbers occur with equal frequency).
: The die is not fair.
Conclusion: Do not reject the null hypothesis.There is insufficient evidence to claim that the numbers on the die do not occur with equal frequency.
D)
: The die is fair (all numbers occur with equal frequency).
: The die is not fair.
Conclusion: Reject the null hypothesis.There is sufficient evidence to claim that the numbers on the die do not occur with equal frequency.
E)
: The die is not fair.
: The die is fair (all numbers occur with equal frequency).
Conclusion: Do not reject the null hypothesis.There is insufficient evidence to claim that the numbers on the die do not occur with equal frequency.
Unlock Deck
Unlock for access to all 78 flashcards in this deck.
Unlock Deck
k this deck
11
Suspecting that a die may be unfair,you want to investigate.To check,you roll it 54 times,recording the number of times each face appears.
How many degrees of freedom are there?
A)12
B)6
C)3
D)5
E)16
How many degrees of freedom are there?
A)12
B)6
C)3
D)5
E)16
Unlock Deck
Unlock for access to all 78 flashcards in this deck.
Unlock Deck
k this deck
12
A die is rolled 180 times and the following data are obtained.Is the die fair?
A)
: The die is not fair.
: The die is fair (all numbers occur with equal frequency).
Conclusion: Do not reject the null hypothesis.There is insufficient evidence to claim that the numbers on the die do not occur with equal frequency.
B)
: The die is not fair.
: The die is fair (all numbers occur with equal frequency).
Conclusion: Do not reject the null hypothesis.There is sufficient evidence to claim that the numbers on the die do not occur with equal frequency.
C)
: The die is fair (all numbers occur with equal frequency).
: The die is not fair.
Conclusion: Do not reject the null hypothesis.The data do not provide sufficient evidence to conclude that the die is loaded.
D)
: The die is fair (all numbers occur with equal frequency).
: The die is not fair.
Conclusion: Reject the null hypothesis.There is sufficient evidence to claim that the numbers on the die do not occur with equal frequency.
E)
: The die is not fair.
: The die is fair (all numbers occur with equal frequency).
Conclusion: Reject the null hypothesis.There is sufficient evidence to claim that the numbers on the die do not occur with equal frequency.
Unlock Deck
Unlock for access to all 78 flashcards in this deck.
Unlock Deck
k this deck
13
A publishing company performs sample surveys to obtain information on characteristics of book readers.A book reader is defined to be one who read one or more books in the six months prior to the survey;a non-book reader is defined to be one who read newspapers or magazines but no books in the six months prior to the survey;a nonreader is defined to be one who did not read a book,newspaper,or magazine in the six months prior to the survey.The following data were obtained from a random sample of 1429 persons 16 years old and over in an effort to determine whether or not the proportions of book readers,non-book readers,and non-readers are the same for each income bracket.
A)Goodness-of-fit
B)Independence
C)Homogeneity
A)Goodness-of-fit
B)Independence
C)Homogeneity
Unlock Deck
Unlock for access to all 78 flashcards in this deck.
Unlock Deck
k this deck
14
Suspecting that a die may be unfair,you want to investigate.To check,you roll it 36 times,recording the number of times each face appears.
To see if these results are unusual,will you test goodness-of-fit,homogeneity,or independence?
A)Independence
B)Goodness-of-fit
C)Homogeneity
To see if these results are unusual,will you test goodness-of-fit,homogeneity,or independence?
A)Independence
B)Goodness-of-fit
C)Homogeneity
Unlock Deck
Unlock for access to all 78 flashcards in this deck.
Unlock Deck
k this deck
15
Tests for adverse reactions to a new drug yielded the results given in the table.The data will be analyzed to determine if there is sufficient evidence to conclude that an association exists between the treatment (drug or placebo)and the reaction (whether or not headaches were experienced).
A)Goodness-of-fit
B)Homogeneity
C)Independence
A)Goodness-of-fit
B)Homogeneity
C)Independence
Unlock Deck
Unlock for access to all 78 flashcards in this deck.
Unlock Deck
k this deck
16
A die,suspected of being unfair,was rolled 50 times.The number of times each face appeared was recorded in the following table.
A)Homogeneity
B)Goodness-of-fit
C)Independence
A)Homogeneity
B)Goodness-of-fit
C)Independence
Unlock Deck
Unlock for access to all 78 flashcards in this deck.
Unlock Deck
k this deck
17
The following data were collected to determine whether or not the retirement age is the same for people in different professions.
A)Independence
B)Homogeneity
C)Goodness-of-fit
A)Independence
B)Homogeneity
C)Goodness-of-fit
Unlock Deck
Unlock for access to all 78 flashcards in this deck.
Unlock Deck
k this deck
18
A car insurance company performed a study to determine whether an association exists between age and the frequency of car accidents.They obtained the following sample data.
A)
: Number of accidents in the past three years has the same distribution for each age group.
: Number of accidents in the past three years does not have the same distribution for each age group.
B)
: Number of accidents in the past three years and age group are not dependent.
: Number of accidents in the past three years and age group are independent.
C)
: Number of accidents in the past three years and age group are dependent.
: Number of accidents in the past three years and age group are not dependent.
D)
: Number of accidents in the past three years and age group are independent.
: Number of accidents in the past three years and age group are not dependent.
E)
: Number of accidents in the past three years and age group are independent.
: Number of accidents in the past three years and age group are not independent.
Unlock Deck
Unlock for access to all 78 flashcards in this deck.
Unlock Deck
k this deck
19
The data will be analyzed to determine if they provide sufficient evidence to conclude that an association exists between car colour and the likelihood of being in an accident.
A)Independence
B)Goodness-of-fit
C)Homogeneity
A)Independence
B)Goodness-of-fit
C)Homogeneity
Unlock Deck
Unlock for access to all 78 flashcards in this deck.
Unlock Deck
k this deck
20
Suspecting that a die may be unfair,you want to investigate.To check,you roll it 18 times,recording the number of times each face appears.
If the die is fair,how many times would you expect each face to show?
A)2
B)6
C)3
D)4
E)1
If the die is fair,how many times would you expect each face to show?
A)2
B)6
C)3
D)4
E)1
Unlock Deck
Unlock for access to all 78 flashcards in this deck.
Unlock Deck
k this deck
21
Among the eastern provinces in 2010,states,Nova Scotia has 40% of the total population,New Brunswick has 33%,Newfoundland has 21%,and Prince Edward Island has 6%.A market researcher selects a sample of 1000 subjects in 2011,with 450 in Nova Scotia,340 in New Brunswich,150 in Newfoundland,and 60 in Prince Edward Island.Does the distribution of the sample agree with the population distribution? Use a 1% level of significance.
Unlock Deck
Unlock for access to all 78 flashcards in this deck.
Unlock Deck
k this deck
22
Test the claim that the responses occur with percentages of 15%,20%,25%,25%,and 15% respectively.Use a 10% level of significance.
Unlock Deck
Unlock for access to all 78 flashcards in this deck.
Unlock Deck
k this deck
23
The two-way table summarizes data from the human resource department at a university:
New Hires
What is the probability (rounded to three decimal places)that a new hire is female?
A)0.487
B)0.434
C)0.513
D)0.250
E)0
New Hires
What is the probability (rounded to three decimal places)that a new hire is female?
A)0.487
B)0.434
C)0.513
D)0.250
E)0
Unlock Deck
Unlock for access to all 78 flashcards in this deck.
Unlock Deck
k this deck
24
A die,suspected of being unfair,was rolled 50 times.The number of times each face appeared was recorded in the following table.
A)
: The counts are normally distributed over the faces.
: The counts are not normally distributed over the faces.
B)
: The counts and faces are independent.
: The counts and faces are not independent.
C)
: The counts and faces are not independent.
: The counts and faces are independent.
D)
: The counts are not uniformly distributed over the faces.
: The counts are uniformly distributed over the faces.
E)
: The counts are uniformly distributed over the faces.
: The counts are not uniformly distributed over the faces.
Unlock Deck
Unlock for access to all 78 flashcards in this deck.
Unlock Deck
k this deck
25
The two-way table summarizes data from the human resource department at a university:
New Hires
What is the probability (rounded to three decimal places)that a female new hire is adjunct?
A)0.342
B)0
C)0.430
D)0.203
E)0.421
New Hires
What is the probability (rounded to three decimal places)that a female new hire is adjunct?
A)0.342
B)0
C)0.430
D)0.203
E)0.421
Unlock Deck
Unlock for access to all 78 flashcards in this deck.
Unlock Deck
k this deck
26
A candy company claims that its bags of mixed suckers are 20% strawberry,30% cherry,15% apple,10% lemon,and 25% grape.A bag was purchased,and the number of each type of flavour was recorded in the chart below.
A)
: The distribution of flavours is not the same as the distribution claimed by the company.
: The distribution of flavours is the same as the distribution claimed by the company.
B)
: The distribution of flavours is the same as the distribution claimed by the company.
: The distribution of flavours is not the same as the distribution claimed by the company.
C)
: The distribution of flavours is not uniform.
: The distribution of flavours is uniform.
D)
: The distribution of flavours is uniform.
: The distribution of flavours is not uniform.
E)
: The flavours and counts are independent.
: The flavours and counts are not independent.
Unlock Deck
Unlock for access to all 78 flashcards in this deck.
Unlock Deck
k this deck
27
The two-way table summarizes data from the human resource department at a university:
New Hires
What is the probability (rounded to three decimal places)that a male new hire is tenure track?
A)0.643
B)0.476
C)0.524
D)0.262
E)0
New Hires
What is the probability (rounded to three decimal places)that a male new hire is tenure track?
A)0.643
B)0.476
C)0.524
D)0.262
E)0
Unlock Deck
Unlock for access to all 78 flashcards in this deck.
Unlock Deck
k this deck
28
Test the claim that workplace accidents are distributed on workdays as follows: Monday 25%,Tuesday: 15%,Wednesday: 15%,Thursday: 15%,and Friday: 30%.
In a study of 100 workplace accidents,24 occurred on a Monday,15 occurred on a Tuesday,17 occurred on a Wednesday,18 occurred on a Thursday,and 26 occurred on a Friday.Use a 10% level of significance.
In a study of 100 workplace accidents,24 occurred on a Monday,15 occurred on a Tuesday,17 occurred on a Wednesday,18 occurred on a Thursday,and 26 occurred on a Friday.Use a 10% level of significance.
Unlock Deck
Unlock for access to all 78 flashcards in this deck.
Unlock Deck
k this deck
29
The following data were collected to determine whether or not the retirement age is the same for people in different professions.
A)
: Age at retirement and job are related.
: Age at retirement and job are unrelated.
B)
: Age at retirement and job are not independent.
: Age at retirement and job are dependent.
C)
: The retirement age has a different distribution for people in the different professions.
: The retirement age has the same distribution for people in the different professions.
D)
: Age at retirement and job are dependent.
: Age at retirement and job are not dependent.
E)
: The retirement age has the same distribution for people in the different professions.
: The retirement age has a different distribution for people in the different professions.
Unlock Deck
Unlock for access to all 78 flashcards in this deck.
Unlock Deck
k this deck
30
In studying the responses to a multiple-choice test question,the following sample data were obtained.Are the responses uniformly distributed? Use a 10% level of significance.
Unlock Deck
Unlock for access to all 78 flashcards in this deck.
Unlock Deck
k this deck
31
A researcher wishes to test the effectiveness of a flu vaccination.Fifty randomly selected people are vaccinated,80 randomly selected people are vaccinated with a placebo,and 300 randomly selected people are not vaccinated.The number in each group who later caught the flu was recorded.The results are shown below.
A)Yes
B)No,because the data are quantitative.
C)No,because the data do not appear to be random.
D)No,because the expected cell frequency condition is violated.
E)No,because the observed counts are too close to the expected counts.
A)Yes
B)No,because the data are quantitative.
C)No,because the data do not appear to be random.
D)No,because the expected cell frequency condition is violated.
E)No,because the observed counts are too close to the expected counts.
Unlock Deck
Unlock for access to all 78 flashcards in this deck.
Unlock Deck
k this deck
32
The two-way table summarizes data from the human resource department at a university:
New Hires
What is the probability (rounded to two decimal places)that a randomly selected new hire is a tenure-track woman?
A)0
B)0.21
C)0.43
D)0.15
E)0.50
New Hires
What is the probability (rounded to two decimal places)that a randomly selected new hire is a tenure-track woman?
A)0
B)0.21
C)0.43
D)0.15
E)0.50
Unlock Deck
Unlock for access to all 78 flashcards in this deck.
Unlock Deck
k this deck
33
A company says that each bag of their candy pieces contains 15% chocolate,27% butterscotch,10% caramel,7% peanut butter,and the rest toffee.You can buy a bag and separate the various kinds of candies.Upon weighing them,you find there are 30 grams of chocolate,48 grams of butterscotch,57 grams of caramel,63 grams of peanut butter and 90 grams of toffee.You wonder whether your bag is significantly different from what the company advertises.
A)Yes
B)No,because the expected values are unclear.
C)No,because it is not possible to find the residuals.
D)No,because the data are quantitative.
E)No,because the observed counts are too close to the expected counts.
A)Yes
B)No,because the expected values are unclear.
C)No,because it is not possible to find the residuals.
D)No,because the data are quantitative.
E)No,because the observed counts are too close to the expected counts.
Unlock Deck
Unlock for access to all 78 flashcards in this deck.
Unlock Deck
k this deck
34
The two-way table summarizes data from the human resource department at a university:
New Hires
What is the probability (rounded to three decimal places)that a tenure-track new hire is female?
A)0.434
B)0.400
C)0.444
D)0
E)0.193
New Hires
What is the probability (rounded to three decimal places)that a tenure-track new hire is female?
A)0.434
B)0.400
C)0.444
D)0
E)0.193
Unlock Deck
Unlock for access to all 78 flashcards in this deck.
Unlock Deck
k this deck
35
A researcher performed a study to determine whether an association exists between sex and blood type.He obtained the following data from a random sample.
A)No,because the data are quantitative.
B)No,because the sample does not appear to be random.
C)No,because the expected cell frequency condition is violated.
D)Yes
E)No,because it is not possible to find the residuals.
A)No,because the data are quantitative.
B)No,because the sample does not appear to be random.
C)No,because the expected cell frequency condition is violated.
D)Yes
E)No,because it is not possible to find the residuals.
Unlock Deck
Unlock for access to all 78 flashcards in this deck.
Unlock Deck
k this deck
36
The two-way table summarizes data from the human resource department at a university:
New Hires
What is the probability (rounded to two decimal places)of a randomly selected new hire being tenure track given that the new hire is a woman?
A)0
B)0.51
C)0.49
D)0.20
E)0.24
New Hires
What is the probability (rounded to two decimal places)of a randomly selected new hire being tenure track given that the new hire is a woman?
A)0
B)0.51
C)0.49
D)0.20
E)0.24
Unlock Deck
Unlock for access to all 78 flashcards in this deck.
Unlock Deck
k this deck
37
A company manager wishes to test a union leader's claim that absences occur on the different week days with the same frequencies.Are absences uniformly distributed over the week? Use a 1% level of significance.
Unlock Deck
Unlock for access to all 78 flashcards in this deck.
Unlock Deck
k this deck
38
In studying the occurrence of genetic characteristics,the following sample data were obtained.Are they uniformly distributed? Use a 10% level of significance.
Unlock Deck
Unlock for access to all 78 flashcards in this deck.
Unlock Deck
k this deck
39
A publishing company performs sample surveys to obtain information on characteristics of book readers.A book reader is defined to be one who read one or more books in the six months prior to the survey;a non-book reader is defined to be one who read newspapers or magazines but no books in the six months prior to the survey;a nonreader is defined to be one who did not read a book,newspaper,or magazine in the six months prior to the survey.The following data were obtained from a random sample of 1429 persons 16 years old and over in an effort to determine whether or not the proportions of book readers,non-book readers,and non-readers are the same for each income bracket.
A)
: There is no relationship between household income and book readership.
: Household income and book readership are not related.
B)
: The classifications do not have the same distribution for each household income bracket.
: The classifications have the same distribution for each household income bracket.
C)
: Household income and book readership are independent.
: Household income and book readership are not dependent.
D)
: The classifications have the same distribution for each household income bracket.
: The classifications do not have the same distribution for each household income bracket.
E)
: There is a relationship between household income and book readership.
: Household income and book readership are not related.
Unlock Deck
Unlock for access to all 78 flashcards in this deck.
Unlock Deck
k this deck
40
A researcher performed a study to determine whether political party affiliations are different for different income brackets.She obtained the following sample data.
A)
: There is a relationship between political party affiliation and income.
: Income and political party affiliation have no relationship.
B)
: Political party affiliation is uniformly distributed over the income brackets.
: Party affiliation is not uniformly distributed over the income brackets.
C)
: Income and political party affiliation are dependent.
: Income and political party affiliation are not dependent.
D)
: Political party affiliation does not have the same distribution for each income bracket.
: Political party affiliation has the same distribution for each income bracket.
E)
: Political party affiliation has the same distribution for each income bracket.
: Political party affiliation does not have the same distribution for each income bracket.
Unlock Deck
Unlock for access to all 78 flashcards in this deck.
Unlock Deck
k this deck
41
A car insurance company performed a study to determine whether an association exists between age and the frequency of car accidents.They obtained the following sample data.
Does the data provide sufficient evidence to conclude that an association exists between age and frequency of car accidents? Use a 5% level of significance.
Does the data provide sufficient evidence to conclude that an association exists between age and frequency of car accidents? Use a 5% level of significance.
Unlock Deck
Unlock for access to all 78 flashcards in this deck.
Unlock Deck
k this deck
42
A researcher performed a study to determine whether an association exists between gender and blood type.He obtained the following sample data.
Does the data provide sufficient evidence to conclude that an association exists between gender and blood type? Use a 5% level of significance.
Does the data provide sufficient evidence to conclude that an association exists between gender and blood type? Use a 5% level of significance.
Unlock Deck
Unlock for access to all 78 flashcards in this deck.
Unlock Deck
k this deck
43
Test the claim that the proportion of men who plan to vote in the next election is the same as the proportion of women who plan to vote.300 men and 300 women were randomly selected and asked whether they planned to vote in the next election.The results are shown below.Use a 10% level of significance.
Unlock Deck
Unlock for access to all 78 flashcards in this deck.
Unlock Deck
k this deck
44
A researcher performed a study to determine whether an association exists between political party affiliation and income.She obtained the following sample data.Use a 1% level of significance.
= 27.831;P-value = 0.0000135
A)Reject the null hypothesis.The data provide sufficient evidence to conclude that political party affiliation is distributed uniformly for each income bracket.
B)Do not reject the null hypothesis.There is insufficient evidence to conclude that there is a relationship between income and political party affiliation.
C)Reject the null hypothesis.The data provide sufficient evidence to conclude that there is a relationship between income and political party affiliation.
D)Do not reject the null hypothesis.The data provide sufficient evidence to conclude that there is a relationship between income and political party affiliation.
E)Reject the null hypothesis.There is insufficient evidence to conclude that there is a relationship between income and political party affiliation.
Unlock Deck
Unlock for access to all 78 flashcards in this deck.
Unlock Deck
k this deck
45
A researcher wishes to test the effectiveness of a flu vaccination.150 people are vaccinated,180 people are vaccinated with a placebo,and 100 people are not vaccinated.The number in each group who later caught the flu was recorded.The results are shown below.
Are the proportions of people catching the flu the same in all three groups? Use a 1% level of significance.
Are the proportions of people catching the flu the same in all three groups? Use a 1% level of significance.
Unlock Deck
Unlock for access to all 78 flashcards in this deck.
Unlock Deck
k this deck
46
A publishing company performs sample surveys to obtain information on characteristics of book readers.A book reader is defined to be one who read one or more books in the six months prior to the survey;a non-book reader is defined to be one who read newspapers or magazines but no books in the six months prior to the survey;a nonreader is defined to be one who did not read a book,newspaper,or magazine in the six months prior to the survey.The following data were obtained in a random sample of 1429 persons 16 years old and over in an effort to determine whether or not the proportions of book readers,non-book readers,and non-readers are the same for each income bracket.Use a 1% level of significance.
= 114.534;P-value = 2.287 ×
A)There is not sufficient evidence to reject the null hypothesis and conclude that the distributions of reader classification and household income are different.
B)There is sufficient evidence to reject the null hypothesis and conclude that the distributions of reader classification and household income are the same.
C)There is sufficient evidence to reject the null hypothesis and conclude that the distributions of reader classification and household income are different.
D)There is sufficient evidence to reject the null hypothesis and conclude that the reader classification is dependent on household income.
E)There is not sufficient evidence to reject the null hypothesis and conclude that the distributions of reader classification and household income are the same.
Unlock Deck
Unlock for access to all 78 flashcards in this deck.
Unlock Deck
k this deck
47
Research is conducted regarding the average age at retirement for four career groups.To test whether there is a relationship between age of retirement and career in these groups,700 employees,recently retired,are randomly selected.The resulting data are displayed in the contingency table below.
Does the data provide sufficient evidence to conclude that an association exists between age of retirement and career? Use a 5% level of significance.
Does the data provide sufficient evidence to conclude that an association exists between age of retirement and career? Use a 5% level of significance.
Unlock Deck
Unlock for access to all 78 flashcards in this deck.
Unlock Deck
k this deck
48
Tests for adverse reactions to a new drug yielded the results given in the table.Use a 10% level of significance.
= 1.798;P-value = 0.1799
The data will be analyzed to determine if there is sufficient evidence to conclude that an association exists between the treatment (drug or placebo)and the reaction (whether or not headaches were experienced).
A)Do not reject the null hypothesis.Report that there is insufficient evidence to conclude that the distribution of headaches is uniform for the drug and placebo.
B)Reject the null hypothesis.Report that there is sufficient evidence to conclude that treatment and reaction are dependent.
C)Reject the null hypothesis.Report that there is insufficient evidence to conclude that treatment and reaction are dependent.
D)Do not reject the null hypothesis.Report that there is sufficient evidence to conclude that treatment and reaction are dependent.
E)Do not reject the null hypothesis.Report that there is insufficient evidence to conclude that treatment and reaction are dependent.
Unlock Deck
Unlock for access to all 78 flashcards in this deck.
Unlock Deck
k this deck
49
Responses to a survey question are broken down according to employment status and the sample results are given below.Are the response and employment status independent? Use a 1% level of significance.
Unlock Deck
Unlock for access to all 78 flashcards in this deck.
Unlock Deck
k this deck
50
At a high school debate tournament,half of the teams were asked to wear suits and ties and the rest were asked to wear jeans and t-shirts.The results are given in the table below.Is the proportion of wins the same for teams wearing suits as for teams wearing jeans? Use a 10% level of significance.
Unlock Deck
Unlock for access to all 78 flashcards in this deck.
Unlock Deck
k this deck
51
A researcher wishes to test whether the proportion of college students who smoke is the same in four different colleges.She randomly selects 100 students from each college and records the number that smoke.The results are shown below.
Are the proportions of students smoking the same for all four colleges? Use a 1% level of significance.
Are the proportions of students smoking the same for all four colleges? Use a 1% level of significance.
Unlock Deck
Unlock for access to all 78 flashcards in this deck.
Unlock Deck
k this deck
52
A researcher performed a study to determine whether an association exists between political party affiliation and income.She obtained the following sample data.
Does the data provide sufficient evidence to conclude that an association exists between political party affiliation and income? Use a 1% level of significance.
Does the data provide sufficient evidence to conclude that an association exists between political party affiliation and income? Use a 1% level of significance.
Unlock Deck
Unlock for access to all 78 flashcards in this deck.
Unlock Deck
k this deck
53
Tests for adverse reactions to a new drug yielded the results given in the table.Is the treatment (drug or placebo)independent of the reaction (whether or not headaches were experienced)? Use a 5% level of significance.
Unlock Deck
Unlock for access to all 78 flashcards in this deck.
Unlock Deck
k this deck
54
Research is conducted regarding the average age at retirement for four career groups.To test whether there is a relationship between age of retirement and career in these groups,700 employees,recently retired,are randomly selected.The resulting data are displayed in the contingency table below.Use a 5% level of significance.
= 20.77;P-value = 0.0137
A)Do not reject the null hypothesis and conclude that career and retirement age are related.
B)Reject the null hypothesis and conclude that the age at retirement is uniformly distributed for each career.
C)Do not reject the null hypothesis and conclude that career and retirement age are independent.
D)Reject the null hypothesis and conclude that career and retirement age are related.
E)Reject the null hypothesis and conclude that career and retirement age are independent.
Unlock Deck
Unlock for access to all 78 flashcards in this deck.
Unlock Deck
k this deck
55
A study conducted for a woman's magazine indicates that the number of children desired by newly-married Canadian couples is distributed as follows.
A random sample of 600 couples in Ontario resulted in the following data.
Ontario couples is different from that of the Canadian population as a whole? Use a 5% level of significance.
A random sample of 600 couples in Ontario resulted in the following data.
Ontario couples is different from that of the Canadian population as a whole? Use a 5% level of significance.
Unlock Deck
Unlock for access to all 78 flashcards in this deck.
Unlock Deck
k this deck
56
A car insurance company performed a study to determine whether an association exists between age and the frequency of car accidents.They obtained the following sample data.Use a 5% level of significance.
= 9.13;P-value = 0.0579
A)Do not reject the null hypothesis.One can conclude that there is a relationship between age and number of accidents.
B)Do not reject the null hypothesis.The data do not provide sufficient evidence to conclude that the number of accidents is distributed uniformly for each age group.
C)Reject the null hypothesis.One cannot conclude that there is a relationship between age and number of accidents.
D)Do not reject the null hypothesis.The data do not provide sufficient evidence to conclude that there is an association between age and frequency of car accidents.
E)Reject the null hypothesis.One can conclude that there is a relationship between age and number of accidents.
Unlock Deck
Unlock for access to all 78 flashcards in this deck.
Unlock Deck
k this deck
57
160 students who were majoring in either math or English were asked a test question,and the researcher recorded whether they answered the question correctly.The sample results are given below.Are the response and major are independent? Use a 5% level of significance.
Unlock Deck
Unlock for access to all 78 flashcards in this deck.
Unlock Deck
k this deck
58
Responses to a survey question are broken down according to gender and the sample results are given below.Are the response and gender are independent?
Unlock Deck
Unlock for access to all 78 flashcards in this deck.
Unlock Deck
k this deck
59
Use the sample data below to test whether car colour affects the likelihood of being in an accident.Use a 5% level of significance.
Unlock Deck
Unlock for access to all 78 flashcards in this deck.
Unlock Deck
k this deck
60
The table below shows the age and favorite type of music of 668 randomly selected people.
Are age and preferred music type are associated? Use a 5% level of significance.
Are age and preferred music type are associated? Use a 5% level of significance.
Unlock Deck
Unlock for access to all 78 flashcards in this deck.
Unlock Deck
k this deck
61
The table below shows the age and favorite type of music of 668 randomly selected people.Use a 5% level of significance.
= 12.954;P-value = 0.0115
A)Reject the null hypothesis and conclude that the age distribution is not the same for each type of music.
B)Do not reject the null hypothesis and conclude that the age distribution is the same for each type of music.
C)Do not reject the null hypothesis and conclude that the age distribution is not the same for each type of music.
D)Reject the null hypothesis and conclude that the age distribution is uniform for each type of music.
E)Reject the null hypothesis and conclude that the age distribution is the same for each type of music.
Unlock Deck
Unlock for access to all 78 flashcards in this deck.
Unlock Deck
k this deck
62
A researcher wishes to test whether the proportion of college students who smoke is the same in four different colleges.She randomly selects 100 students from each college and records the number that smoke.The results are shown below.
Test statistic: χ2 = 17.832
P-value = 0.0004763
Test statistic: χ2 = 17.832
P-value = 0.0004763
Unlock Deck
Unlock for access to all 78 flashcards in this deck.
Unlock Deck
k this deck
63
Research is conducted regarding the average age at retirement for four career groups.To test whether there is a relationship between age of retirement and career in these groups,700 employees,recently retired,are randomly selected.The resulting data are displayed in the contingency table below.
How many degrees of freedom are there for the chi-square test statistic?
A)12
B)9
C)16
D)20
E)25
How many degrees of freedom are there for the chi-square test statistic?
A)12
B)9
C)16
D)20
E)25
Unlock Deck
Unlock for access to all 78 flashcards in this deck.
Unlock Deck
k this deck
64
When performing a chi-square goodness-of-fit test,how are the expected frequencies obtained?
Unlock Deck
Unlock for access to all 78 flashcards in this deck.
Unlock Deck
k this deck
65
In order to test a claim about the effectiveness of a flu vaccine,150 people were vaccinated,180 people were vaccinated with a placebo,and 100 people were not vaccinated.The number in each group who later caught the flu was recorded.The researcher wishes to test the claim that the proportion of people who catch the flu is the same for all three groups.The results are shown below.
Test statistic: χ2 = 14.965
P-value = 0.0005627
Test statistic: χ2 = 14.965
P-value = 0.0005627
Unlock Deck
Unlock for access to all 78 flashcards in this deck.
Unlock Deck
k this deck
66
What is the null hypothesis for the chi-square test of independence? What assumptions are required for this test?
Unlock Deck
Unlock for access to all 78 flashcards in this deck.
Unlock Deck
k this deck
67
Describe the null hypothesis for the test of independence.List the assumptions for the χ2 test of independence.What is the major difference between the assumptions for this test and the assumptions for the previous tests we have studied?
Unlock Deck
Unlock for access to all 78 flashcards in this deck.
Unlock Deck
k this deck
68
Suppose that a chi-square goodness-of-fit test is to be performed.Is it true or false that the more closely the observed frequencies match the frequencies that would be expected if the null hypothesis were true,the larger the value of the test statistic = Σ ?
= Σ ? Unlock Deck
Unlock for access to all 78 flashcards in this deck.
Unlock Deck
k this deck
69
Explain why a chi-square goodness-of-fit test is always right-tailed.
Unlock Deck
Unlock for access to all 78 flashcards in this deck.
Unlock Deck
k this deck
70
A researcher records for each of 500 randomly selected towns,the number of churches in the town and the number of homicides in the town in the past ten years.The towns range in size from a population of 1000 to a population of 1,000,000.He then performs a chi-square test of independence for these two variables.Would you expect that he would find association between the two variables? If so,should he conclude that a causal relationship exists? Explain your thinking.
Unlock Deck
Unlock for access to all 78 flashcards in this deck.
Unlock Deck
k this deck
71
Describe a goodness-of-fit test.What assumptions are made when using a goodness-of-fit test?
Unlock Deck
Unlock for access to all 78 flashcards in this deck.
Unlock Deck
k this deck
72
In studying the occurrence of genetic characteristics,the following sample data were obtained.Do the characteristics occur with the same frequency? Use a 10% level of significance.
Χ2 = 8.263;P-value = 0.1423
A)Reject the null hypothesis.There is sufficient evidence to warrant rejection of the claim that the characteristics occur with the same frequency.
B)Fail to reject the null hypothesis.There is not sufficient evidence to warrant rejection of the claim that the characteristics occur with the same frequency.
C)Fail to reject the null hypothesis.There is not sufficient evidence to warrant rejection of the claim that the characteristics are independent.
D)Fail to reject the null hypothesis.There is sufficient evidence to warrant rejection of the claim that the characteristics occur with the same frequency.
E)Reject the null hypothesis.There is not sufficient evidence to warrant rejection of the claim that the characteristics occur with the same frequency.
Unlock Deck
Unlock for access to all 78 flashcards in this deck.
Unlock Deck
k this deck
73
Suppose that you wish to perform a chi-square test of independence.The two variables under consideration are sex and blood type.Is it true or false that if the two variables are not associated,we would expect that the proportion of women in the sample with a given blood type would be roughly equal to the proportion of men in the sample with the same blood type?
Unlock Deck
Unlock for access to all 78 flashcards in this deck.
Unlock Deck
k this deck
74
A company manager wishes to test a union leader's claim that absences occur on the different week days with the same frequencies.He compiled the following data.
Test statistic: χ2 = 28.308
P-value = 0.0000108
Test statistic: χ2 = 28.308
P-value = 0.0000108
Unlock Deck
Unlock for access to all 78 flashcards in this deck.
Unlock Deck
k this deck
75
The sample data below was tested to determine whether car colour is related to the likelihood of being in an accident.
Test statistic: χ2 =34.38
P-value = 3.42 ×
Test statistic: χ2 =34.38
P-value = 3.42 ×
Unlock Deck
Unlock for access to all 78 flashcards in this deck.
Unlock Deck
k this deck
76
160 students who were majoring in either math or English were asked a test question,and the researcher recorded whether they answered the question correctly.The sample results are given below.
= 6.502;P-value = 0.011
Are the response and major independent? Use a 5% level of significance.
A)Report that the distribution of correct answers is uniform for both majors because the null hypothesis is rejected.
B)Report that response is not dependent on major because the null hypothesis is rejected.
C)Report that response is not dependent on major because the null hypothesis is not rejected.
D)Report that response is dependent on major because the null hypothesis is rejected.
E)Report that response is dependent on major because the null hypothesis is not rejected.
Unlock Deck
Unlock for access to all 78 flashcards in this deck.
Unlock Deck
k this deck
77
A die is rolled 180 times and the following data are obtained.
A chi-square test was conducted to determine whether or not the die is loaded (i.e. ,that the six numbers are not equally likely).Use a 5% level of significance.
= 11.8;P-value = 0.03763
A)Reject the null hypothesis.The data provide sufficient evidence to conclude that the die is loaded.
B)Reject the null hypothesis.The data provide sufficient evidence to conclude that the die is fair.
C)Do not reject the null hypothesis.The data provide sufficient evidence to conclude that the die is loaded.
D)Do not reject the null hypothesis.The data do not provide sufficient evidence to conclude that the die is loaded.
E)Reject the null hypothesis.The data do not provide sufficient evidence to conclude that the die is loaded.
Unlock Deck
Unlock for access to all 78 flashcards in this deck.
Unlock Deck
k this deck
78
When performing a chi-square goodness-of-fit test,why do large values of the test statistic suggest that the variable does not have the distribution stated in the null hypothesis? Refer to the formula for the test statistic in your explanation.
Unlock Deck
Unlock for access to all 78 flashcards in this deck.
Unlock Deck
k this deck
Unlock Deck
Unlock for access to all 78 flashcards in this deck.


