Exam 25: Comparing Counts
Exam 1: Data30 Questions
Exam 2: Displaying and Describing Categorical Data65 Questions
Exam 3: Displaying and Summarizing Quantitative Data93 Questions
Exam 4: Understanding and Comparing Distributions102 Questions
Exam 5: The Standard Deviation As a Ruler and the Normal Model131 Questions
Exam 6: Scatterplots, association, and Correlation74 Questions
Exam 7: Linear Regression57 Questions
Exam 8: Regression Wisdom32 Questions
Exam 9: Re-Expressing Data: Get It Straight51 Questions
Exam 10: Understanding Randomness26 Questions
Exam 11: Sample Surveys50 Questions
Exam 12: Experiments and Observational Surveys87 Questions
Exam 13: From Randomness to Probability64 Questions
Exam 14: Probability Rules90 Questions
Exam 15: Random Variables112 Questions
Exam 16: Probability Models114 Questions
Exam 17: Sampling Distribution Models45 Questions
Exam 18: Confidence Intervals for Proportions56 Questions
Exam 19: Testing Hypotheses About Proportions50 Questions
Exam 20: More About Tests69 Questions
Exam 21: Comparing Two Proportions52 Questions
Exam 22: Inferences About Means106 Questions
Exam 23: Comparing Means43 Questions
Exam 24: Paired Samples and Blocks33 Questions
Exam 25: Comparing Counts78 Questions
Exam 26: Inferences for Regression51 Questions
Exam 27: Analysis of Variance39 Questions
Exam 28: Multifactor Analysis of Variance22 Questions
Exam 29: Multiple Regression22 Questions
Exam 30: Multiple Regression Wisdom21 Questions
Exam 31: Rank-Based Nonparametric Tests29 Questions
Exam 32: The Bootstrap31 Questions
Select questions type
Research is conducted regarding the average age at retirement for four career groups.To test whether there is a relationship between age of retirement and career in these groups,700 employees,recently retired,are randomly selected.The resulting data are displayed in the contingency table below.  Does the data provide sufficient evidence to conclude that an association exists between age of retirement and career? Use a 5% level of significance.
Free
(Essay)
4.9/5  (33)
(33)
Correct Answer: Verified

: Age of retirement and career are independent. 
: Age of retirement and career are not independent.
Test statistic: 
= 20.77
P-value = 0.0137
Reject  .The data provides sufficient evidence to conclude that age of retirement and career are not independent.
The two-way table summarizes data from the human resource department at a university:
New Hires 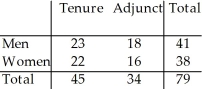 What is the probability (rounded to three decimal places)that a female new hire is adjunct?
Free
(Multiple Choice)
4.9/5 (36)
Correct Answer:Verified
E
A publishing company performs sample surveys to obtain information on characteristics of book readers.A book reader is defined to be one who read one or more books in the six months prior to the survey;a non-book reader is defined to be one who read newspapers or magazines but no books in the six months prior to the survey;a nonreader is defined to be one who did not read a book,newspaper,or magazine in the six months prior to the survey.The following data were obtained in a random sample of 1429 persons 16 years old and over in an effort to determine whether or not the proportions of book readers,non-book readers,and non-readers are the same for each income bracket.Use a 1% level of significance. 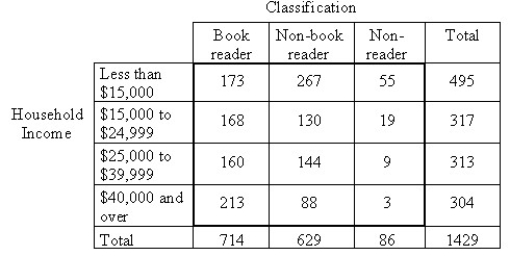
 = 114.534;P-value = 2.287 ×
Free
(Multiple Choice)
4.9/5 (37)
Correct Answer:Verified
C
Tests for adverse reactions to a new drug yielded the results given in the table.Is the treatment (drug or placebo)independent of the reaction (whether or not headaches were experienced)? Use a 5% level of significance. 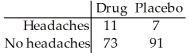
(Essay)
4.9/5 (30)
Test the claim that workplace accidents are distributed on workdays as follows: Monday 25%,Tuesday: 15%,Wednesday: 15%,Thursday: 15%,and Friday: 30%.
In a study of 100 workplace accidents,24 occurred on a Monday,15 occurred on a Tuesday,17 occurred on a Wednesday,18 occurred on a Thursday,and 26 occurred on a Friday.Use a 10% level of significance.
(Essay)
4.9/5 (41)
Tests for adverse reactions to a new drug yielded the results given in the table.The data will be analyzed to determine if they provide sufficient evidence to conclude that an association exists between the treatment (drug or placebo)and the reaction (whether or not headaches were experienced). 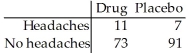
(Multiple Choice)
4.8/5 (34)
A company manager wishes to test a union leader's claim that absences occur on the different week days with the same frequencies.He compiled the following data. 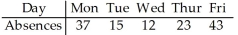 Test statistic: χ2 = 28.308
P-value = 0.0000108
Test statistic: χ2 = 28.308
P-value = 0.0000108
(Essay)
4.8/5 (40)
A researcher performed a study to determine whether an association exists between sex and blood type.He obtained the following data from a random sample. 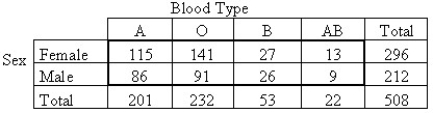
(Multiple Choice)
4.9/5 (31)
When performing a chi-square goodness-of-fit test,why do large values of the test statistic suggest that the variable does not have the distribution stated in the null hypothesis? Refer to the formula for the test statistic in your explanation.
(Essay)
4.8/5 (38)
A die,suspected of being unfair,was rolled 50 times.The number of times each face appeared was recorded in the following table. 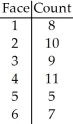
(Multiple Choice)
4.7/5 (28)
A researcher performed a study to determine whether political party affiliations are different for different income brackets.She obtained the following sample data. 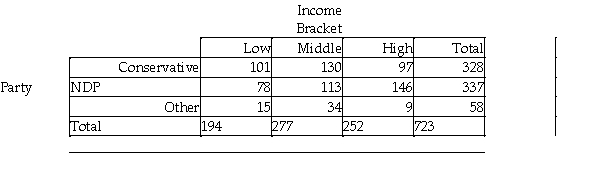
(Multiple Choice)
4.9/5 (34)
Research is conducted regarding the average age at retirement for four career groups.To test whether there is a relationship between age of retirement and career in these groups,700 employees,recently retired,are randomly selected.The resulting data are displayed in the contingency table below. 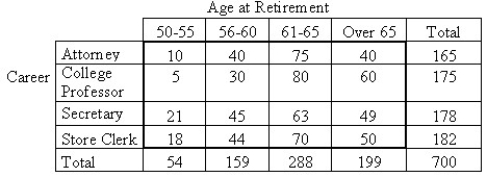 How many degrees of freedom are there for the chi-square test statistic?
(Multiple Choice)
4.9/5 (39)
The data will be analyzed to determine if they provide sufficient evidence to conclude that an association exists between car colour and the likelihood of being in an accident. 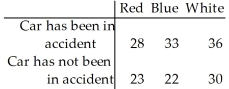
(Multiple Choice)
4.7/5 (36)
The data will be analyzed to determine if they provide sufficient evidence to conclude that an association exists between car colour and the likelihood of being in an accident. 
(Multiple Choice)
4.9/5 (39)
Suspecting that a die may be unfair,you want to investigate.To check,you roll it 90 times,recording the number of times each face appears. 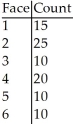 State your hypotheses.
(Multiple Choice)
4.7/5 (29)
160 students who were majoring in either math or English were asked a test question,and the researcher recorded whether they answered the question correctly.The sample results are given below. 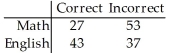
 = 6.502;P-value = 0.011
Are the response and major independent? Use a 5% level of significance.
= 6.502;P-value = 0.011
Are the response and major independent? Use a 5% level of significance.
(Multiple Choice)
4.9/5 (41)
Research is conducted regarding the average age at retirement for four career groups.To test whether there is a relationship between age of retirement and career in these groups,700 employees,recently retired,are randomly selected.The resulting data are displayed in the contingency table below.Use a 5% level of significance. 
 = 20.77;P-value = 0.0137
(Multiple Choice)
4.9/5 (39)
A company manager wishes to test a union leader's claim that absences occur on the different week days with the same frequencies.Are absences uniformly distributed over the week? Use a 1% level of significance. 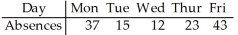
(Essay)
4.8/5 (32)
In studying the occurrence of genetic characteristics,the following sample data were obtained.Are they uniformly distributed? Use a 10% level of significance. 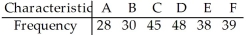
(Essay)
4.9/5 (40)
Suspecting that a die may be unfair,you want to investigate.To check,you roll it 18 times,recording the number of times each face appears. 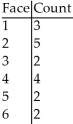 If the die is fair,how many times would you expect each face to show?
(Multiple Choice)
4.8/5 (32)
Filters
- Essay(0)
- Multiple Choice(0)
- Short Answer(0)
- True False(0)
- Matching(0)