Deck 10: Statistical Inference About Means and Proportions With Two Populations
Full screen (f)
Question
Exhibit 10-2
The following information was obtained from matched samples.
The daily production rates for a sample of workers before and after a training program are shown below.

Refer to Exhibit 10-2.The point estimate for the difference between the means of the two populations is
A)-1
B)-2
C)0
D)1
The following information was obtained from matched samples.
The daily production rates for a sample of workers before and after a training program are shown below.
Refer to Exhibit 10-2.The point estimate for the difference between the means of the two populations is
A)-1
B)-2
C)0
D)1
Question
Question
Exhibit 10-1
Salary information regarding male and female employees of a large company is shown below.

Refer to Exhibit 10-1.At 95% confidence,the conclusion is the
A)average salary of males is significantly greater than females
B)average salary of males is significantly lower than females
C)salaries of males and females are equal
D)None of these alternatives is correct.
Salary information regarding male and female employees of a large company is shown below.
Refer to Exhibit 10-1.At 95% confidence,the conclusion is the
A)average salary of males is significantly greater than females
B)average salary of males is significantly lower than females
C)salaries of males and females are equal
D)None of these alternatives is correct.
Question
Exhibit 10-2
The following information was obtained from matched samples.
The daily production rates for a sample of workers before and after a training program are shown below.
-Refer to Exhibit 10-2.The null hypothesis to be tested is H0: d = 0.The test statistic is
A)-1.96
B)1.96
C)0
D)1.645
The following information was obtained from matched samples.
The daily production rates for a sample of workers before and after a training program are shown below.
-Refer to Exhibit 10-2.The null hypothesis to be tested is H0: d = 0.The test statistic is
A)-1.96
B)1.96
C)0
D)1.645
Question
Exhibit 10-1
Salary information regarding male and female employees of a large company is shown below.
Refer to Exhibit 10-1.The standard error for the difference between the two means is
A)4
B)7.46
C)4.24
D)2.0
Salary information regarding male and female employees of a large company is shown below.
Refer to Exhibit 10-1.The standard error for the difference between the two means is
A)4
B)7.46
C)4.24
D)2.0
Question
Question
Exhibit 10-1
Salary information regarding male and female employees of a large company is shown below.
Refer to Exhibit 10-1.The 95% confidence interval for the difference between the means of the two populations is
A)0 to 6.92
B)-2 to 2
C)-1.96 to 1.96
D)-0.92 to 6.92
Salary information regarding male and female employees of a large company is shown below.
Refer to Exhibit 10-1.The 95% confidence interval for the difference between the means of the two populations is
A)0 to 6.92
B)-2 to 2
C)-1.96 to 1.96
D)-0.92 to 6.92
Question
Exhibit 10-1
Salary information regarding male and female employees of a large company is shown below.
Refer to Exhibit 10-1.At 95% confidence,the margin of error is
A)1.96
B)1.645
C)3.920
D)2.000
Salary information regarding male and female employees of a large company is shown below.
Refer to Exhibit 10-1.At 95% confidence,the margin of error is
A)1.96
B)1.645
C)3.920
D)2.000
Question
Question
The standard error of 
Is the
A)variance of
B)variance of the sampling distribution of
C)standard deviation of the sampling distribution of
D)difference between the two means
Is the
A)variance of
B)variance of the sampling distribution of
C)standard deviation of the sampling distribution of
D)difference between the two means
Question
Exhibit 10-1
Salary information regarding male and female employees of a large company is shown below.
Refer to Exhibit 10-1.The p-value is
A)0.0668
B)0.0334
C)1.336
D)1.96
Salary information regarding male and female employees of a large company is shown below.
Refer to Exhibit 10-1.The p-value is
A)0.0668
B)0.0334
C)1.336
D)1.96
Question
Question
Question
Question
Question
Exhibit 10-1
Salary information regarding male and female employees of a large company is shown below.
Refer to Exhibit 10-1.If you are interested in testing whether or not the average salary of males is significantly greater than that of females,the test statistic is
A)2.0
B)1.5
C)1.96
D)1.645
Salary information regarding male and female employees of a large company is shown below.
Refer to Exhibit 10-1.If you are interested in testing whether or not the average salary of males is significantly greater than that of females,the test statistic is
A)2.0
B)1.5
C)1.96
D)1.645
Question
Question
Exhibit 10-1
Salary information regarding male and female employees of a large company is shown below.
Refer to Exhibit 10-1.The point estimate of the difference between the means of the two populations is
A)-28
B)3
C)4
D)-4
Salary information regarding male and female employees of a large company is shown below.
Refer to Exhibit 10-1.The point estimate of the difference between the means of the two populations is
A)-28
B)3
C)4
D)-4
Question
Exhibit 10-2
The following information was obtained from matched samples.
The daily production rates for a sample of workers before and after a training program are shown below.
Refer to Exhibit 10-2.Based on the results of question 18,the
A)null hypothesis should be rejected
B)null hypothesis should not be rejected
C)alternative hypothesis should be accepted
D)None of these alternatives is correct.
Question
The sampling distribution of 
Is approximated by a
A)normal distribution
B)t-distribution with n1 + n2 degrees of freedom
C)t-distribution with n1 + n2 - 1 degrees of freedom
D)t-distribution with n1 + n2 + 2 degrees of freedom
Is approximated by a
A)normal distribution
B)t-distribution with n1 + n2 degrees of freedom
C)t-distribution with n1 + n2 - 1 degrees of freedom
D)t-distribution with n1 + n2 + 2 degrees of freedom
Question
Exhibit 10-3
A statistics teacher wants to see if there is any difference in the abilities of students enrolled in statistics today and those enrolled five years ago.A sample of final examination scores from students enrolled today and from students enrolled five years ago was taken.You are given the following information.

Refer to Exhibit 10-3.The test statistic for the difference between the two population means is
A)-.47
B)-.65
C)-1.5
D)-3
A statistics teacher wants to see if there is any difference in the abilities of students enrolled in statistics today and those enrolled five years ago.A sample of final examination scores from students enrolled today and from students enrolled five years ago was taken.You are given the following information.
Refer to Exhibit 10-3.The test statistic for the difference between the two population means is
A)-.47
B)-.65
C)-1.5
D)-3
Question
Exhibit 10-3
A statistics teacher wants to see if there is any difference in the abilities of students enrolled in statistics today and those enrolled five years ago.A sample of final examination scores from students enrolled today and from students enrolled five years ago was taken.You are given the following information.
Refer to Exhibit 10-3.The 95% confidence interval for the difference between the two population means is
A)-9.92 to -2.08
B)-3.92 to 3.92
C)-13.84 to 1.84
D)-24.228 to 12.23
Question
Exhibit 10-4
The following information was obtained from independent random samples.
Assume normally distributed populations with equal variances.

Refer to Exhibit 10-4.The degrees of freedom for the t-distribution are
A)22
B)23
C)24
D)19
The following information was obtained from independent random samples.
Assume normally distributed populations with equal variances.
Refer to Exhibit 10-4.The degrees of freedom for the t-distribution are
A)22
B)23
C)24
D)19
Question
Exhibit 10-6
The management of a department store is interested in estimating the difference between the mean credit purchases of customers using the store's credit card versus those customers using a national major credit card.You are given the following information.

Refer to Exhibit 10-6.A 95% confidence interval estimate for the difference between the average purchases of the customers using the two different credit cards is
A)49 to 64
B)11.68 to 18.32
C)125 to 140
D)8 to 10
The management of a department store is interested in estimating the difference between the mean credit purchases of customers using the store's credit card versus those customers using a national major credit card.You are given the following information.
Refer to Exhibit 10-6.A 95% confidence interval estimate for the difference between the average purchases of the customers using the two different credit cards is
A)49 to 64
B)11.68 to 18.32
C)125 to 140
D)8 to 10
Question
Exhibit 10-6
The management of a department store is interested in estimating the difference between the mean credit purchases of customers using the store's credit card versus those customers using a national major credit card.You are given the following information.
Refer to Exhibit 10-6.A point estimate for the difference between the mean purchases of the users of the two credit cards is
A)2
B)18
C)265
D)15
Question
Exhibit 10-5
The following information was obtained from matched samples.

Refer to Exhibit 10-5.The point estimate for the difference between the means of the two populations (Method 1 - Method 2)is
A)-1
B)0
C)-4
D)2
The following information was obtained from matched samples.
Refer to Exhibit 10-5.The point estimate for the difference between the means of the two populations (Method 1 - Method 2)is
A)-1
B)0
C)-4
D)2
Question
Exhibit 10-7
In order to estimate the difference between the average hourly wages of employees of two branches of a department store,the following data have been gathered.

Refer to Exhibit 10-7.A 95% interval estimate for the difference between the two population means is
A)0.078 to 1.922
B)1.922 to 2.078
C)1.09 to 4.078
D)1.078 to 2.922
In order to estimate the difference between the average hourly wages of employees of two branches of a department store,the following data have been gathered.
Refer to Exhibit 10-7.A 95% interval estimate for the difference between the two population means is
A)0.078 to 1.922
B)1.922 to 2.078
C)1.09 to 4.078
D)1.078 to 2.922
Question
Exhibit 10-3
A statistics teacher wants to see if there is any difference in the abilities of students enrolled in statistics today and those enrolled five years ago.A sample of final examination scores from students enrolled today and from students enrolled five years ago was taken.You are given the following information.
Refer to Exhibit 10-3.The p-value for the difference between the two population means is
A).0013
B).0026
C).4987
D).9987
Question
Exhibit 10-5
The following information was obtained from matched samples.
Refer to Exhibit 10-5.If the null hypothesis is tested at the 5% level,the null hypothesis
A)should be rejected
B)should not be rejected
C)should be revised
D)None of these alternatives is correct.
The following information was obtained from matched samples.
Refer to Exhibit 10-5.If the null hypothesis is tested at the 5% level,the null hypothesis
A)should be rejected
B)should not be rejected
C)should be revised
D)None of these alternatives is correct.
Question
Exhibit 10-6
The management of a department store is interested in estimating the difference between the mean credit purchases of customers using the store's credit card versus those customers using a national major credit card.You are given the following information.
Refer to Exhibit 10-6.At 95% confidence,the margin of error is
A)1.694
B)3.32
C)1.96
D)15
Question
Exhibit 10-5
The following information was obtained from matched samples.
Refer to Exhibit 10-5.The 95% confidence interval for the difference between the two population means is
A)-3.776 to 1.776
B)-2.776 to 2.776
C)-1.776 to 2.776
D)0 to 3.776
The following information was obtained from matched samples.
Refer to Exhibit 10-5.The 95% confidence interval for the difference between the two population means is
A)-3.776 to 1.776
B)-2.776 to 2.776
C)-1.776 to 2.776
D)0 to 3.776
Question
Exhibit 10-5
The following information was obtained from matched samples.
-Refer to Exhibit 10-5.The null hypothesis tested is H0: d = 0.The test statistic for the difference between the two population means is
A)2
B)0
C)-1
D)-2
The following information was obtained from matched samples.
-Refer to Exhibit 10-5.The null hypothesis tested is H0: d = 0.The test statistic for the difference between the two population means is
A)2
B)0
C)-1
D)-2
Question
Exhibit 10-4
The following information was obtained from independent random samples.
Assume normally distributed populations with equal variances.
Refer to Exhibit 10-4.The standard error of
Is
A)3.0
B)4.0
C)8.372
D)19.48
The following information was obtained from independent random samples.
Assume normally distributed populations with equal variances.
Refer to Exhibit 10-4.The standard error of
Is
A)3.0
B)4.0
C)8.372
D)19.48
Question
Exhibit 10-3
A statistics teacher wants to see if there is any difference in the abilities of students enrolled in statistics today and those enrolled five years ago.A sample of final examination scores from students enrolled today and from students enrolled five years ago was taken.You are given the following information.
Refer to Exhibit 10-3.The standard error of
Is
A)12.9
B)9.3
C)4
D)2
Question
Exhibit 10-4
The following information was obtained from independent random samples.
Assume normally distributed populations with equal variances.
Refer to Exhibit 10-4.The point estimate for the difference between the means of the two populations is
A)0
B)2
C)3
D)15
The following information was obtained from independent random samples.
Assume normally distributed populations with equal variances.
Refer to Exhibit 10-4.The point estimate for the difference between the means of the two populations is
A)0
B)2
C)3
D)15
Question
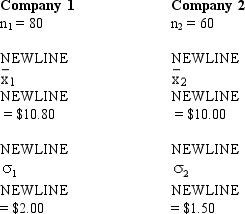
Exhibit 10-8
In order to determine whether or not there is a significant difference between the hourly wages of two companies,the following data have been accumulated.

Refer to Exhibit 10-8.A point estimate for the difference between the two sample means is
A)20
B)0.50
C)0.25
D)1.00
In order to determine whether or not there is a significant difference between the hourly wages of two companies,the following data have been accumulated.
Refer to Exhibit 10-8.A point estimate for the difference between the two sample means is
A)20
B)0.50
C)0.25
D)1.00
Question
Exhibit 10-3
A statistics teacher wants to see if there is any difference in the abilities of students enrolled in statistics today and those enrolled five years ago.A sample of final examination scores from students enrolled today and from students enrolled five years ago was taken.You are given the following information.
Refer to Exhibit 10-3.What is the conclusion that can be reached about the difference in the average final examination scores between the two classes? (Use a .05 level of significance. )
A)There is a statistically significant difference in the average final examination scores between the two classes.
B)There is no statistically significant difference in the average final examination scores between the two classes.
C)It is impossible to make a decision on the basis of the information given.
D)There is a difference,but it is not significant.
Question
Exhibit 10-7
In order to estimate the difference between the average hourly wages of employees of two branches of a department store,the following data have been gathered.
Refer to Exhibit 10-7.A point estimate for the difference between the two sample means is
A)1
B)2
C)3
D)4
In order to estimate the difference between the average hourly wages of employees of two branches of a department store,the following data have been gathered.
Refer to Exhibit 10-7.A point estimate for the difference between the two sample means is
A)1
B)2
C)3
D)4
Question
Exhibit 10-4
The following information was obtained from independent random samples.
Assume normally distributed populations with equal variances.
Refer to Exhibit 10-4.The 95% confidence interval for the difference between the two population means is
A)-5.372 to 11.372
B)-5 to 3
C)-4.86 to 10.86
D)-2.65 to 8.65
Question
Exhibit 10-3
A statistics teacher wants to see if there is any difference in the abilities of students enrolled in statistics today and those enrolled five years ago.A sample of final examination scores from students enrolled today and from students enrolled five years ago was taken.You are given the following information.
Refer to Exhibit 10-3.The point estimate for the difference between the means of the two populations is
A)58.5
B)9
C)-9
D)-6
Question
Exhibit 10-10
The results of a recent poll on the preference of shoppers regarding two products are shown below.

Refer to Exhibit 10-10.At 95% confidence,the margin of error is
A)0.064
B)0.044
C)0.0225
D)52
The results of a recent poll on the preference of shoppers regarding two products are shown below.
Refer to Exhibit 10-10.At 95% confidence,the margin of error is
A)0.064
B)0.044
C)0.0225
D)52
Question
Exhibit 10-9
Two major automobile manufacturers have produced compact cars with the same size engines.We are interested in determining whether or not there is a significant difference in the MPG (miles per gallon)of the two brands of automobiles.A random sample of eight cars from each manufacturer is selected,and eight drivers are selected to drive each automobile for a specified distance.The following data show the results of the test.

Refer to Exhibit 10-9.The mean for the differences is
A)0.50
B)1.5
C)2.0
D)2.5
Two major automobile manufacturers have produced compact cars with the same size engines.We are interested in determining whether or not there is a significant difference in the MPG (miles per gallon)of the two brands of automobiles.A random sample of eight cars from each manufacturer is selected,and eight drivers are selected to drive each automobile for a specified distance.The following data show the results of the test.
Refer to Exhibit 10-9.The mean for the differences is
A)0.50
B)1.5
C)2.0
D)2.5
Question
Exhibit 10-11
An insurance company selected samples of clients under 18 years of age and over 18 and recorded the number of accidents they had in the previous year.The results are shown below.
 We are interested in determining if the accident proportions differ between the two age groups.
Refer to Exhibit 10-11.The p-value is
A)less than 0.001
B)more than 0.10
C)0.0228
D)0.3
An insurance company selected samples of clients under 18 years of age and over 18 and recorded the number of accidents they had in the previous year.The results are shown below.
We are interested in determining if the accident proportions differ between the two age groups.Refer to Exhibit 10-11.The p-value is
A)less than 0.001
B)more than 0.10
C)0.0228
D)0.3
Question
Exhibit 10-8
In order to determine whether or not there is a significant difference between the hourly wages of two companies,the following data have been accumulated.
Refer to Exhibit 10-8.The p-value is
A)0.0013
B)0.0026
C)0.0042
D)0.0084
In order to determine whether or not there is a significant difference between the hourly wages of two companies,the following data have been accumulated.
Refer to Exhibit 10-8.The p-value is
A)0.0013
B)0.0026
C)0.0042
D)0.0084
Question
Exhibit 10-11
An insurance company selected samples of clients under 18 years of age and over 18 and recorded the number of accidents they had in the previous year.The results are shown below.
We are interested in determining if the accident proportions differ between the two age groups.
Refer to Exhibit 10-11.The pooled proportion is
A)0.305
B)0.300
C)0.027
D)0.450
An insurance company selected samples of clients under 18 years of age and over 18 and recorded the number of accidents they had in the previous year.The results are shown below.
We are interested in determining if the accident proportions differ between the two age groups.Refer to Exhibit 10-11.The pooled proportion is
A)0.305
B)0.300
C)0.027
D)0.450
Question
Exhibit 10-9
Two major automobile manufacturers have produced compact cars with the same size engines.We are interested in determining whether or not there is a significant difference in the MPG (miles per gallon)of the two brands of automobiles.A random sample of eight cars from each manufacturer is selected,and eight drivers are selected to drive each automobile for a specified distance.The following data show the results of the test.
Refer to Exhibit 10-9.At 90% confidence the null hypothesis
A)should not be rejected
B)should be rejected
C)should be revised
D)None of these alternatives is correct.
Question
Exhibit 10-13
In order to determine whether or not there is a significant difference between the hourly wages of two companies,the following data have been accumulated.
Refer to Exhibit 10-13.The test statistic has a value of
A)1.96
B)1.645
C)0.80
D)2.7
In order to determine whether or not there is a significant difference between the hourly wages of two companies,the following data have been accumulated.
Refer to Exhibit 10-13.The test statistic has a value of
A)1.96
B)1.645
C)0.80
D)2.7
Question
Exhibit 10-13
In order to determine whether or not there is a significant difference between the hourly wages of two companies,the following data have been accumulated.
-Refer to Exhibit 10-13.The null hypothesis for this test is
A) 1 - 2 0
B) 1 - 2 > 0
C) 1 - 2 < 0
D) 1 - 2 = 0
In order to determine whether or not there is a significant difference between the hourly wages of two companies,the following data have been accumulated.
-Refer to Exhibit 10-13.The null hypothesis for this test is
A) 1 - 2 0
B) 1 - 2 > 0
C) 1 - 2 < 0
D) 1 - 2 = 0
Question
Exhibit 10-10
The results of a recent poll on the preference of shoppers regarding two products are shown below.
Refer to Exhibit 10-10.The standard error of
Is
A)52
B)0.044
C)0.0225
D)100
The results of a recent poll on the preference of shoppers regarding two products are shown below.
Refer to Exhibit 10-10.The standard error of
Is
A)52
B)0.044
C)0.0225
D)100
Question
Exhibit 10-8
In order to determine whether or not there is a significant difference between the hourly wages of two companies,the following data have been accumulated.
Refer to Exhibit 10-8.The null hypothesis
A)should be rejected
B)should not be rejected
C)should be revised
D)None of these alternatives is correct.
Question
Exhibit 10-12
The results of a recent poll on the preference of teenagers regarding the types of music they listen to are shown below.

Refer to Exhibit 10-12.The point estimate for the difference between the proportions is
A)-0.02
B)0.048
C)100
D)66
The results of a recent poll on the preference of teenagers regarding the types of music they listen to are shown below.
Refer to Exhibit 10-12.The point estimate for the difference between the proportions is
A)-0.02
B)0.048
C)100
D)66
Question
Exhibit 10-8
In order to determine whether or not there is a significant difference between the hourly wages of two companies,the following data have been accumulated.
Refer to Exhibit 10-8.The test statistic is
A)0.098
B)1.645
C)2.75
D)3.01
In order to determine whether or not there is a significant difference between the hourly wages of two companies,the following data have been accumulated.
Refer to Exhibit 10-8.The test statistic is
A)0.098
B)1.645
C)2.75
D)3.01
Question
Exhibit 10-12
The results of a recent poll on the preference of teenagers regarding the types of music they listen to are shown below.
Refer to Exhibit 10-12.The 95% confidence interval for the difference between the two proportions is
A)384 to 450
B)0.48 to 0.5
C)0.028 to 0.068
D)-0.068 to 0.028
The results of a recent poll on the preference of teenagers regarding the types of music they listen to are shown below.
Refer to Exhibit 10-12.The 95% confidence interval for the difference between the two proportions is
A)384 to 450
B)0.48 to 0.5
C)0.028 to 0.068
D)-0.068 to 0.028
Question
Exhibit 10-13
In order to determine whether or not there is a significant difference between the hourly wages of two companies,the following data have been accumulated.
Refer to Exhibit 10-13.The point estimate of the difference between the means is
A)20
B)0.8
C)0.50
D)-20
In order to determine whether or not there is a significant difference between the hourly wages of two companies,the following data have been accumulated.
Refer to Exhibit 10-13.The point estimate of the difference between the means is
A)20
B)0.8
C)0.50
D)-20
Question
Exhibit 10-11
An insurance company selected samples of clients under 18 years of age and over 18 and recorded the number of accidents they had in the previous year.The results are shown below.
We are interested in determining if the accident proportions differ between the two age groups.
Refer to Exhibit 10-11.The test statistic is
A)0.96
B)1.96
C)2.96
D)3.96
An insurance company selected samples of clients under 18 years of age and over 18 and recorded the number of accidents they had in the previous year.The results are shown below.
We are interested in determining if the accident proportions differ between the two age groups.Refer to Exhibit 10-11.The test statistic is
A)0.96
B)1.96
C)2.96
D)3.96
Question
Exhibit 10-9
Two major automobile manufacturers have produced compact cars with the same size engines.We are interested in determining whether or not there is a significant difference in the MPG (miles per gallon)of the two brands of automobiles.A random sample of eight cars from each manufacturer is selected,and eight drivers are selected to drive each automobile for a specified distance.The following data show the results of the test.
Refer to Exhibit 10-9.The test statistic is
A)1.645
B)1.96
C)2.096
D)2.256
Question
Exhibit 10-12
The results of a recent poll on the preference of teenagers regarding the types of music they listen to are shown below.
Refer to Exhibit 10-12.The standard error of
Is
A)0.48
B)0.50
C)0.03
D)0.0243
The results of a recent poll on the preference of teenagers regarding the types of music they listen to are shown below.
Refer to Exhibit 10-12.The standard error of
Is
A)0.48
B)0.50
C)0.03
D)0.0243
Question
Exhibit 10-11
An insurance company selected samples of clients under 18 years of age and over 18 and recorded the number of accidents they had in the previous year.The results are shown below.
We are interested in determining if the accident proportions differ between the two age groups.
-Refer to Exhibit 10-11 and let pu represent the proportion under and po the proportion over the age of 18.The null hypothesis is
A)pu - po 0
B)pu - po 0
C)pu - po 0
D)pu - po = 0
An insurance company selected samples of clients under 18 years of age and over 18 and recorded the number of accidents they had in the previous year.The results are shown below.
We are interested in determining if the accident proportions differ between the two age groups.-Refer to Exhibit 10-11 and let pu represent the proportion under and po the proportion over the age of 18.The null hypothesis is
A)pu - po 0
B)pu - po 0
C)pu - po 0
D)pu - po = 0
Question
Exhibit 10-10
The results of a recent poll on the preference of shoppers regarding two products are shown below.
Refer to Exhibit 10-10.The 95% confidence interval estimate for the difference between the populations favoring the products is
A)-0.024 to 0.064
B)0.6 to 0.7
C)0.024 to 0.7
D)0.02 to 0.3
The results of a recent poll on the preference of shoppers regarding two products are shown below.
Refer to Exhibit 10-10.The 95% confidence interval estimate for the difference between the populations favoring the products is
A)-0.024 to 0.064
B)0.6 to 0.7
C)0.024 to 0.7
D)0.02 to 0.3
Question
Exhibit 10-10
The results of a recent poll on the preference of shoppers regarding two products are shown below.
Refer to Exhibit 10-10.The point estimate for the difference between the two population proportions in favor of this product is
A)52
B)100
C)0.44
D)0.02
The results of a recent poll on the preference of shoppers regarding two products are shown below.
Refer to Exhibit 10-10.The point estimate for the difference between the two population proportions in favor of this product is
A)52
B)100
C)0.44
D)0.02
Question
In order to estimate the difference between the yearly incomes of marketing managers in the East and West of the United States,the following information was gathered.

a.Develop an interval estimate for the difference between the average yearly incomes of the marketing managers in the East and West.Use = 0.05.
b.At 95% confidence,use the p-value approach and test to determine if the average yearly income of marketing managers in the East is significantly different from the West.
Question
In order to estimate the difference between the average Miles per Gallon of two different models of automobiles,samples are taken and the following information is collected.

a.At 95% confidence develop an interval estimate for the difference between the average Miles per Gallon for the two models.
b.Is there conclusive evidence to indicate that one model gets a higher MPG than the other? Why or why not? Explain.
a.At 95% confidence develop an interval estimate for the difference between the average Miles per Gallon for the two models.
b.Is there conclusive evidence to indicate that one model gets a higher MPG than the other? Why or why not? Explain.
Question
In order to determine whether or not a driver's education course improves the scores on a driving exam,a sample of 6 students were given the exam before and after taking the course.The results are shown below.
Let d = Score After - Score Before.

a.Compute the test statistic.
b.At 95% confidence using the p-value approach,test to see if taking the course actually increased scores on the driving exam.
Let d = Score After - Score Before.
a.Compute the test statistic.
b.At 95% confidence using the p-value approach,test to see if taking the course actually increased scores on the driving exam.
Question
Exhibit 10-13
In order to determine whether or not there is a significant difference between the hourly wages of two companies,the following data have been accumulated.
Refer to Exhibit 10-13.The p-value is
A)0.0035
B)0.007
C)0.4965
D)1.96
In order to determine whether or not there is a significant difference between the hourly wages of two companies,the following data have been accumulated.
Refer to Exhibit 10-13.The p-value is
A)0.0035
B)0.007
C)0.4965
D)1.96
Question
Question
Question
Consider the following results for two samples randomly taken from two populations.

a.What are the degrees of freedom for the t distribution?
b.At 95% confidence,compute the margin of error.
c.Develop a 95% confidence interval for the difference between the two population means.
a.What are the degrees of freedom for the t distribution?
b.At 95% confidence,compute the margin of error.
c.Develop a 95% confidence interval for the difference between the two population means.
Question
Question
Consider the following results for two samples randomly taken from two populations.

a.Determine the degrees of freedom for the t-distribution.
b.Develop a 95% confidence interval for the difference between the two population means.
a.Determine the degrees of freedom for the t-distribution.
b.Develop a 95% confidence interval for the difference between the two population means.
Question
Question
The business manager of a local health clinic is interested in estimating the difference between the fees for extended office visits in her center and the fees of a newly opened group practice.She gathered the following information regarding the two offices.

Develop a 95% confidence interval estimate for the difference between the average fees of the two offices.
Develop a 95% confidence interval estimate for the difference between the average fees of the two offices.
Question
A comparative study of organic and conventionally grown produce was checked for the presence of E.coli.Results are summarized below.Is there a significant difference in the proportion of E.Coli in organic vs.conventionally grown produce? Test at = 0.10.

Question
In order to estimate the difference between the average daily sales of two branches of a department store,the following data has been gathered.

a.Determine the point estimate of the difference between the means.
b.Determine the degrees of freedom for this interval estimation.
c.Compute the margin of error.
d.Develop a 95% confidence interval for the difference between the two population means.
a.Determine the point estimate of the difference between the means.
b.Determine the degrees of freedom for this interval estimation.
c.Compute the margin of error.
d.Develop a 95% confidence interval for the difference between the two population means.
Question
Question
Maxforce,Inc. ,manufactures racquetball racquets by two different manufacturing processes (A and B).Because the management of this company is interested in estimating the difference between the average time it takes each process to produce a racquet,they select independent samples from each process.The results of the samples are shown below.

a.Develop a 95% confidence interval estimate for the difference between the average time of the two processes.
b.Is there conclusive evidence to prove that one process takes longer than the other? If yes,which process? Explain.
a.Develop a 95% confidence interval estimate for the difference between the average time of the two processes.
b.Is there conclusive evidence to prove that one process takes longer than the other? If yes,which process? Explain.
Question
The following sample information is given concerning the ACT scores of high school seniors form two local schools.
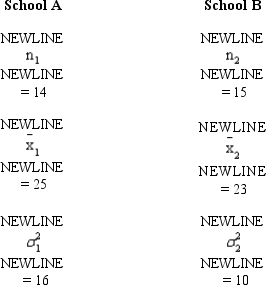
Develop a 95% confidence interval estimate for the difference between the two populations.
Develop a 95% confidence interval estimate for the difference between the two populations.
Question
The management of Regional Hospital has made substantial improvements in their hospital and would like to test and determine whether there has been a significant decrease in the average length of stay of their patients in their hospital.The following data has been accumulated from before and after the improvements.At 95% confidence,test to determine if there has been a significant reduction in the average length of stay.

a.Formulate the hypotheses.
b.Compute the test statistic.
c.Using the p-value approach,test to see if the average length of stay in RFH is significantly less than the average length of stay in GH.Let = 0.05.
a.Formulate the hypotheses.
b.Compute the test statistic.
c.Using the p-value approach,test to see if the average length of stay in RFH is significantly less than the average length of stay in GH.Let = 0.05.
Question
Consider the following results for two samples randomly taken from two normal populations with equal variances.

a.Develop a 95% confidence interval for the difference between the two population means.
b.Is there conclusive evidence that one population has a larger mean? Explain.
a.Develop a 95% confidence interval for the difference between the two population means.
b.Is there conclusive evidence that one population has a larger mean? Explain.
Question
Question
Independent random samples taken on two university campuses revealed the following information concerning the average amount of money spent on textbooks during the fall semester.

We want to determine if,on the average,students at University A spent more on textbooks then the students at University B.
a.Compute the test statistic.
b.Compute the p-value.
c.What is your conclusion? Let = .05.
We want to determine if,on the average,students at University A spent more on textbooks then the students at University B.
a.Compute the test statistic.
b.Compute the p-value.
c.What is your conclusion? Let = .05.

Unlock Deck
Sign up to unlock the cards in this deck!
Unlock Deck
Unlock Deck
1/121
Play
Full screen (f)
Deck 10: Statistical Inference About Means and Proportions With Two Populations
1
Exhibit 10-2
The following information was obtained from matched samples.
The daily production rates for a sample of workers before and after a training program are shown below.
Refer to Exhibit 10-2.The point estimate for the difference between the means of the two populations is
A)-1
B)-2
C)0
D)1
The following information was obtained from matched samples.
The daily production rates for a sample of workers before and after a training program are shown below.
Refer to Exhibit 10-2.The point estimate for the difference between the means of the two populations is
A)-1
B)-2
C)0
D)1
C
2
To construct an interval estimate for the difference between the means of two populations when the standard deviations of the two populations are unknown and it can be assumed the two populations have equal variances,we must use a t distribution with (let n1 be the size of sample 1 and n2 the size of sample 2)
A)(n1 + n2)degrees of freedom
B)(n1 + n2 - 1)degrees of freedom
C)(n1 + n2 - 2)degrees of freedom
D)n1 - n2 + 2
A)(n1 + n2)degrees of freedom
B)(n1 + n2 - 1)degrees of freedom
C)(n1 + n2 - 2)degrees of freedom
D)n1 - n2 + 2
C
3
Exhibit 10-1
Salary information regarding male and female employees of a large company is shown below.
Refer to Exhibit 10-1.At 95% confidence,the conclusion is the
A)average salary of males is significantly greater than females
B)average salary of males is significantly lower than females
C)salaries of males and females are equal
D)None of these alternatives is correct.
D
4
Exhibit 10-2
The following information was obtained from matched samples.
The daily production rates for a sample of workers before and after a training program are shown below.
-Refer to Exhibit 10-2.The null hypothesis to be tested is H0: d = 0.The test statistic is
A)-1.96
B)1.96
C)0
D)1.645
The following information was obtained from matched samples.
The daily production rates for a sample of workers before and after a training program are shown below.
-Refer to Exhibit 10-2.The null hypothesis to be tested is H0: d = 0.The test statistic is
A)-1.96
B)1.96
C)0
D)1.645
Unlock Deck
Unlock for access to all 121 flashcards in this deck.
Unlock Deck
k this deck
5
Exhibit 10-1
Salary information regarding male and female employees of a large company is shown below.
Refer to Exhibit 10-1.The standard error for the difference between the two means is
A)4
B)7.46
C)4.24
D)2.0
Salary information regarding male and female employees of a large company is shown below.
Refer to Exhibit 10-1.The standard error for the difference between the two means is
A)4
B)7.46
C)4.24
D)2.0
Unlock Deck
Unlock for access to all 121 flashcards in this deck.
Unlock Deck
k this deck
6
Independent simple random samples are taken to test the difference between the means of two populations whose variances are not known,but are assumed to be equal.The sample sizes are n1 = 32 and n2 = 40.The correct distribution to use is the
A)t distribution with 73 degrees of freedom
B)t distribution with 72 degrees of freedom
C)t distribution with 71 degrees of freedom
D)t distribution with 70 degrees of freedom
A)t distribution with 73 degrees of freedom
B)t distribution with 72 degrees of freedom
C)t distribution with 71 degrees of freedom
D)t distribution with 70 degrees of freedom
Unlock Deck
Unlock for access to all 121 flashcards in this deck.
Unlock Deck
k this deck
7
Exhibit 10-1
Salary information regarding male and female employees of a large company is shown below.
Refer to Exhibit 10-1.The 95% confidence interval for the difference between the means of the two populations is
A)0 to 6.92
B)-2 to 2
C)-1.96 to 1.96
D)-0.92 to 6.92
Salary information regarding male and female employees of a large company is shown below.
Refer to Exhibit 10-1.The 95% confidence interval for the difference between the means of the two populations is
A)0 to 6.92
B)-2 to 2
C)-1.96 to 1.96
D)-0.92 to 6.92
Unlock Deck
Unlock for access to all 121 flashcards in this deck.
Unlock Deck
k this deck
8
Exhibit 10-1
Salary information regarding male and female employees of a large company is shown below.
Refer to Exhibit 10-1.At 95% confidence,the margin of error is
A)1.96
B)1.645
C)3.920
D)2.000
Salary information regarding male and female employees of a large company is shown below.
Refer to Exhibit 10-1.At 95% confidence,the margin of error is
A)1.96
B)1.645
C)3.920
D)2.000
Unlock Deck
Unlock for access to all 121 flashcards in this deck.
Unlock Deck
k this deck
9
If two independent large samples are taken from two populations,the sampling distribution of the difference between the two sample means
A)can be approximated by a Poisson distribution
B)will have a variance of one
C)can be approximated by a normal distribution
D)will have a mean of one
A)can be approximated by a Poisson distribution
B)will have a variance of one
C)can be approximated by a normal distribution
D)will have a mean of one
Unlock Deck
Unlock for access to all 121 flashcards in this deck.
Unlock Deck
k this deck
10
The standard error of
Is the
A)variance of
B)variance of the sampling distribution of
C)standard deviation of the sampling distribution of
D)difference between the two means
Is the
A)variance of
B)variance of the sampling distribution of
C)standard deviation of the sampling distribution of
D)difference between the two means
Unlock Deck
Unlock for access to all 121 flashcards in this deck.
Unlock Deck
k this deck
11
Exhibit 10-1
Salary information regarding male and female employees of a large company is shown below.
Refer to Exhibit 10-1.The p-value is
A)0.0668
B)0.0334
C)1.336
D)1.96
Salary information regarding male and female employees of a large company is shown below.
Refer to Exhibit 10-1.The p-value is
A)0.0668
B)0.0334
C)1.336
D)1.96
Unlock Deck
Unlock for access to all 121 flashcards in this deck.
Unlock Deck
k this deck
12
To compute an interval estimate for the difference between the means of two populations,the t distribution
A)is restricted to small sample situations
B)is not restricted to small sample situations
C)can be applied when the populations have equal means
D)None of these alternatives is correct.
A)is restricted to small sample situations
B)is not restricted to small sample situations
C)can be applied when the populations have equal means
D)None of these alternatives is correct.
Unlock Deck
Unlock for access to all 121 flashcards in this deck.
Unlock Deck
k this deck
13
Independent simple random samples are taken to test the difference between the means of two populations whose standard deviations are not known,but are assumed to be equal.The sample sizes are n1 = 25 and n2 = 35.The correct distribution to use is the
A)t distribution with 61 degrees of freedom
B)t distribution with 60 degrees of freedom
C)t distribution with 59 degrees of freedom
D)t distribution with 58 degrees of freedom
A)t distribution with 61 degrees of freedom
B)t distribution with 60 degrees of freedom
C)t distribution with 59 degrees of freedom
D)t distribution with 58 degrees of freedom
Unlock Deck
Unlock for access to all 121 flashcards in this deck.
Unlock Deck
k this deck
14
When each data value in one sample is matched with a corresponding data value in another sample,the samples are known as
A)corresponding samples
B)matched samples
C)independent samples
D)None of these alternatives is correct.
A)corresponding samples
B)matched samples
C)independent samples
D)None of these alternatives is correct.
Unlock Deck
Unlock for access to all 121 flashcards in this deck.
Unlock Deck
k this deck
15
When developing an interval estimate for the difference between two sample means,with sample sizes of n1 and n2,
A)n1 must be equal to n2
B)n1 must be smaller than n2
C)n1 must be larger than n2
D)n1 and n2 can be of different sizes,
A)n1 must be equal to n2
B)n1 must be smaller than n2
C)n1 must be larger than n2
D)n1 and n2 can be of different sizes,
Unlock Deck
Unlock for access to all 121 flashcards in this deck.
Unlock Deck
k this deck
16
Exhibit 10-1
Salary information regarding male and female employees of a large company is shown below.
Refer to Exhibit 10-1.If you are interested in testing whether or not the average salary of males is significantly greater than that of females,the test statistic is
A)2.0
B)1.5
C)1.96
D)1.645
Salary information regarding male and female employees of a large company is shown below.
Refer to Exhibit 10-1.If you are interested in testing whether or not the average salary of males is significantly greater than that of females,the test statistic is
A)2.0
B)1.5
C)1.96
D)1.645
Unlock Deck
Unlock for access to all 121 flashcards in this deck.
Unlock Deck
k this deck
17
If we are interested in testing whether the proportion of items in population 1 is larger than the proportion of items in population 2,the
A)null hypothesis should state P1 - P2 < 0
B)null hypothesis should state P1 - P2 > 0
C)alternative hypothesis should state P1 - P2 > 0
D)alternative hypothesis should state P1 - P2 < 0
A)null hypothesis should state P1 - P2 < 0
B)null hypothesis should state P1 - P2 > 0
C)alternative hypothesis should state P1 - P2 > 0
D)alternative hypothesis should state P1 - P2 < 0
Unlock Deck
Unlock for access to all 121 flashcards in this deck.
Unlock Deck
k this deck
18
Exhibit 10-1
Salary information regarding male and female employees of a large company is shown below.
Refer to Exhibit 10-1.The point estimate of the difference between the means of the two populations is
A)-28
B)3
C)4
D)-4
Salary information regarding male and female employees of a large company is shown below.
Refer to Exhibit 10-1.The point estimate of the difference between the means of the two populations is
A)-28
B)3
C)4
D)-4
Unlock Deck
Unlock for access to all 121 flashcards in this deck.
Unlock Deck
k this deck
19
Exhibit 10-2
The following information was obtained from matched samples.
The daily production rates for a sample of workers before and after a training program are shown below.
Refer to Exhibit 10-2.Based on the results of question 18,the
A)null hypothesis should be rejected
B)null hypothesis should not be rejected
C)alternative hypothesis should be accepted
D)None of these alternatives is correct.
Unlock Deck
Unlock for access to all 121 flashcards in this deck.
Unlock Deck
k this deck
20
The sampling distribution of
Is approximated by a
A)normal distribution
B)t-distribution with n1 + n2 degrees of freedom
C)t-distribution with n1 + n2 - 1 degrees of freedom
D)t-distribution with n1 + n2 + 2 degrees of freedom
Is approximated by a
A)normal distribution
B)t-distribution with n1 + n2 degrees of freedom
C)t-distribution with n1 + n2 - 1 degrees of freedom
D)t-distribution with n1 + n2 + 2 degrees of freedom
Unlock Deck
Unlock for access to all 121 flashcards in this deck.
Unlock Deck
k this deck
21
Exhibit 10-3
A statistics teacher wants to see if there is any difference in the abilities of students enrolled in statistics today and those enrolled five years ago.A sample of final examination scores from students enrolled today and from students enrolled five years ago was taken.You are given the following information.
Refer to Exhibit 10-3.The test statistic for the difference between the two population means is
A)-.47
B)-.65
C)-1.5
D)-3
Unlock Deck
Unlock for access to all 121 flashcards in this deck.
Unlock Deck
k this deck
22
Exhibit 10-3
A statistics teacher wants to see if there is any difference in the abilities of students enrolled in statistics today and those enrolled five years ago.A sample of final examination scores from students enrolled today and from students enrolled five years ago was taken.You are given the following information.
Refer to Exhibit 10-3.The 95% confidence interval for the difference between the two population means is
A)-9.92 to -2.08
B)-3.92 to 3.92
C)-13.84 to 1.84
D)-24.228 to 12.23
Unlock Deck
Unlock for access to all 121 flashcards in this deck.
Unlock Deck
k this deck
23
Exhibit 10-4
The following information was obtained from independent random samples.
Assume normally distributed populations with equal variances.
Refer to Exhibit 10-4.The degrees of freedom for the t-distribution are
A)22
B)23
C)24
D)19
The following information was obtained from independent random samples.
Assume normally distributed populations with equal variances.
Refer to Exhibit 10-4.The degrees of freedom for the t-distribution are
A)22
B)23
C)24
D)19
Unlock Deck
Unlock for access to all 121 flashcards in this deck.
Unlock Deck
k this deck
24
Exhibit 10-6
The management of a department store is interested in estimating the difference between the mean credit purchases of customers using the store's credit card versus those customers using a national major credit card.You are given the following information.
Refer to Exhibit 10-6.A 95% confidence interval estimate for the difference between the average purchases of the customers using the two different credit cards is
A)49 to 64
B)11.68 to 18.32
C)125 to 140
D)8 to 10
Unlock Deck
Unlock for access to all 121 flashcards in this deck.
Unlock Deck
k this deck
25
Exhibit 10-6
The management of a department store is interested in estimating the difference between the mean credit purchases of customers using the store's credit card versus those customers using a national major credit card.You are given the following information.
Refer to Exhibit 10-6.A point estimate for the difference between the mean purchases of the users of the two credit cards is
A)2
B)18
C)265
D)15
Unlock Deck
Unlock for access to all 121 flashcards in this deck.
Unlock Deck
k this deck
26
Exhibit 10-5
The following information was obtained from matched samples.
Refer to Exhibit 10-5.The point estimate for the difference between the means of the two populations (Method 1 - Method 2)is
A)-1
B)0
C)-4
D)2
The following information was obtained from matched samples.
Refer to Exhibit 10-5.The point estimate for the difference between the means of the two populations (Method 1 - Method 2)is
A)-1
B)0
C)-4
D)2
Unlock Deck
Unlock for access to all 121 flashcards in this deck.
Unlock Deck
k this deck
27
Exhibit 10-7
In order to estimate the difference between the average hourly wages of employees of two branches of a department store,the following data have been gathered.
Refer to Exhibit 10-7.A 95% interval estimate for the difference between the two population means is
A)0.078 to 1.922
B)1.922 to 2.078
C)1.09 to 4.078
D)1.078 to 2.922
Unlock Deck
Unlock for access to all 121 flashcards in this deck.
Unlock Deck
k this deck
28
Exhibit 10-3
A statistics teacher wants to see if there is any difference in the abilities of students enrolled in statistics today and those enrolled five years ago.A sample of final examination scores from students enrolled today and from students enrolled five years ago was taken.You are given the following information.
Refer to Exhibit 10-3.The p-value for the difference between the two population means is
A).0013
B).0026
C).4987
D).9987
Unlock Deck
Unlock for access to all 121 flashcards in this deck.
Unlock Deck
k this deck
29
Exhibit 10-5
The following information was obtained from matched samples.
Refer to Exhibit 10-5.If the null hypothesis is tested at the 5% level,the null hypothesis
A)should be rejected
B)should not be rejected
C)should be revised
D)None of these alternatives is correct.
The following information was obtained from matched samples.
Refer to Exhibit 10-5.If the null hypothesis is tested at the 5% level,the null hypothesis
A)should be rejected
B)should not be rejected
C)should be revised
D)None of these alternatives is correct.
Unlock Deck
Unlock for access to all 121 flashcards in this deck.
Unlock Deck
k this deck
30
Exhibit 10-6
The management of a department store is interested in estimating the difference between the mean credit purchases of customers using the store's credit card versus those customers using a national major credit card.You are given the following information.
Refer to Exhibit 10-6.At 95% confidence,the margin of error is
A)1.694
B)3.32
C)1.96
D)15
Unlock Deck
Unlock for access to all 121 flashcards in this deck.
Unlock Deck
k this deck
31
Exhibit 10-5
The following information was obtained from matched samples.
Refer to Exhibit 10-5.The 95% confidence interval for the difference between the two population means is
A)-3.776 to 1.776
B)-2.776 to 2.776
C)-1.776 to 2.776
D)0 to 3.776
The following information was obtained from matched samples.
Refer to Exhibit 10-5.The 95% confidence interval for the difference between the two population means is
A)-3.776 to 1.776
B)-2.776 to 2.776
C)-1.776 to 2.776
D)0 to 3.776
Unlock Deck
Unlock for access to all 121 flashcards in this deck.
Unlock Deck
k this deck
32
Exhibit 10-5
The following information was obtained from matched samples.
-Refer to Exhibit 10-5.The null hypothesis tested is H0: d = 0.The test statistic for the difference between the two population means is
A)2
B)0
C)-1
D)-2
The following information was obtained from matched samples.
-Refer to Exhibit 10-5.The null hypothesis tested is H0: d = 0.The test statistic for the difference between the two population means is
A)2
B)0
C)-1
D)-2
Unlock Deck
Unlock for access to all 121 flashcards in this deck.
Unlock Deck
k this deck
33
Exhibit 10-4
The following information was obtained from independent random samples.
Assume normally distributed populations with equal variances.
Refer to Exhibit 10-4.The standard error of
Is
A)3.0
B)4.0
C)8.372
D)19.48
The following information was obtained from independent random samples.
Assume normally distributed populations with equal variances.
Refer to Exhibit 10-4.The standard error of
Is
A)3.0
B)4.0
C)8.372
D)19.48
Unlock Deck
Unlock for access to all 121 flashcards in this deck.
Unlock Deck
k this deck
34
Exhibit 10-3
A statistics teacher wants to see if there is any difference in the abilities of students enrolled in statistics today and those enrolled five years ago.A sample of final examination scores from students enrolled today and from students enrolled five years ago was taken.You are given the following information.
Refer to Exhibit 10-3.The standard error of
Is
A)12.9
B)9.3
C)4
D)2
Unlock Deck
Unlock for access to all 121 flashcards in this deck.
Unlock Deck
k this deck
35
Exhibit 10-4
The following information was obtained from independent random samples.
Assume normally distributed populations with equal variances.
Refer to Exhibit 10-4.The point estimate for the difference between the means of the two populations is
A)0
B)2
C)3
D)15
The following information was obtained from independent random samples.
Assume normally distributed populations with equal variances.
Refer to Exhibit 10-4.The point estimate for the difference between the means of the two populations is
A)0
B)2
C)3
D)15
Unlock Deck
Unlock for access to all 121 flashcards in this deck.
Unlock Deck
k this deck
36
Exhibit 10-8
In order to determine whether or not there is a significant difference between the hourly wages of two companies,the following data have been accumulated.
Refer to Exhibit 10-8.A point estimate for the difference between the two sample means is
A)20
B)0.50
C)0.25
D)1.00
In order to determine whether or not there is a significant difference between the hourly wages of two companies,the following data have been accumulated.
Refer to Exhibit 10-8.A point estimate for the difference between the two sample means is
A)20
B)0.50
C)0.25
D)1.00
Unlock Deck
Unlock for access to all 121 flashcards in this deck.
Unlock Deck
k this deck
37
Exhibit 10-3
A statistics teacher wants to see if there is any difference in the abilities of students enrolled in statistics today and those enrolled five years ago.A sample of final examination scores from students enrolled today and from students enrolled five years ago was taken.You are given the following information.
Refer to Exhibit 10-3.What is the conclusion that can be reached about the difference in the average final examination scores between the two classes? (Use a .05 level of significance. )
A)There is a statistically significant difference in the average final examination scores between the two classes.
B)There is no statistically significant difference in the average final examination scores between the two classes.
C)It is impossible to make a decision on the basis of the information given.
D)There is a difference,but it is not significant.
Unlock Deck
Unlock for access to all 121 flashcards in this deck.
Unlock Deck
k this deck
38
Exhibit 10-7
In order to estimate the difference between the average hourly wages of employees of two branches of a department store,the following data have been gathered.
Refer to Exhibit 10-7.A point estimate for the difference between the two sample means is
A)1
B)2
C)3
D)4
In order to estimate the difference between the average hourly wages of employees of two branches of a department store,the following data have been gathered.
Refer to Exhibit 10-7.A point estimate for the difference between the two sample means is
A)1
B)2
C)3
D)4
Unlock Deck
Unlock for access to all 121 flashcards in this deck.
Unlock Deck
k this deck
39
Exhibit 10-4
The following information was obtained from independent random samples.
Assume normally distributed populations with equal variances.
Refer to Exhibit 10-4.The 95% confidence interval for the difference between the two population means is
A)-5.372 to 11.372
B)-5 to 3
C)-4.86 to 10.86
D)-2.65 to 8.65
Unlock Deck
Unlock for access to all 121 flashcards in this deck.
Unlock Deck
k this deck
40
Exhibit 10-3
A statistics teacher wants to see if there is any difference in the abilities of students enrolled in statistics today and those enrolled five years ago.A sample of final examination scores from students enrolled today and from students enrolled five years ago was taken.You are given the following information.
Refer to Exhibit 10-3.The point estimate for the difference between the means of the two populations is
A)58.5
B)9
C)-9
D)-6
Unlock Deck
Unlock for access to all 121 flashcards in this deck.
Unlock Deck
k this deck
41
Exhibit 10-10
The results of a recent poll on the preference of shoppers regarding two products are shown below.
Refer to Exhibit 10-10.At 95% confidence,the margin of error is
A)0.064
B)0.044
C)0.0225
D)52
The results of a recent poll on the preference of shoppers regarding two products are shown below.
Refer to Exhibit 10-10.At 95% confidence,the margin of error is
A)0.064
B)0.044
C)0.0225
D)52
Unlock Deck
Unlock for access to all 121 flashcards in this deck.
Unlock Deck
k this deck
42
Exhibit 10-9
Two major automobile manufacturers have produced compact cars with the same size engines.We are interested in determining whether or not there is a significant difference in the MPG (miles per gallon)of the two brands of automobiles.A random sample of eight cars from each manufacturer is selected,and eight drivers are selected to drive each automobile for a specified distance.The following data show the results of the test.
Refer to Exhibit 10-9.The mean for the differences is
A)0.50
B)1.5
C)2.0
D)2.5
Unlock Deck
Unlock for access to all 121 flashcards in this deck.
Unlock Deck
k this deck
43
Exhibit 10-11
An insurance company selected samples of clients under 18 years of age and over 18 and recorded the number of accidents they had in the previous year.The results are shown below.
We are interested in determining if the accident proportions differ between the two age groups.
Refer to Exhibit 10-11.The p-value is
A)less than 0.001
B)more than 0.10
C)0.0228
D)0.3
An insurance company selected samples of clients under 18 years of age and over 18 and recorded the number of accidents they had in the previous year.The results are shown below.
We are interested in determining if the accident proportions differ between the two age groups.Refer to Exhibit 10-11.The p-value is
A)less than 0.001
B)more than 0.10
C)0.0228
D)0.3
Unlock Deck
Unlock for access to all 121 flashcards in this deck.
Unlock Deck
k this deck
44
Exhibit 10-8
In order to determine whether or not there is a significant difference between the hourly wages of two companies,the following data have been accumulated.
Refer to Exhibit 10-8.The p-value is
A)0.0013
B)0.0026
C)0.0042
D)0.0084
In order to determine whether or not there is a significant difference between the hourly wages of two companies,the following data have been accumulated.
Refer to Exhibit 10-8.The p-value is
A)0.0013
B)0.0026
C)0.0042
D)0.0084
Unlock Deck
Unlock for access to all 121 flashcards in this deck.
Unlock Deck
k this deck
45
Exhibit 10-11
An insurance company selected samples of clients under 18 years of age and over 18 and recorded the number of accidents they had in the previous year.The results are shown below.
We are interested in determining if the accident proportions differ between the two age groups.
Refer to Exhibit 10-11.The pooled proportion is
A)0.305
B)0.300
C)0.027
D)0.450
An insurance company selected samples of clients under 18 years of age and over 18 and recorded the number of accidents they had in the previous year.The results are shown below.
We are interested in determining if the accident proportions differ between the two age groups.Refer to Exhibit 10-11.The pooled proportion is
A)0.305
B)0.300
C)0.027
D)0.450
Unlock Deck
Unlock for access to all 121 flashcards in this deck.
Unlock Deck
k this deck
46
Exhibit 10-9
Two major automobile manufacturers have produced compact cars with the same size engines.We are interested in determining whether or not there is a significant difference in the MPG (miles per gallon)of the two brands of automobiles.A random sample of eight cars from each manufacturer is selected,and eight drivers are selected to drive each automobile for a specified distance.The following data show the results of the test.
Refer to Exhibit 10-9.At 90% confidence the null hypothesis
A)should not be rejected
B)should be rejected
C)should be revised
D)None of these alternatives is correct.
Unlock Deck
Unlock for access to all 121 flashcards in this deck.
Unlock Deck
k this deck
47
Exhibit 10-13
In order to determine whether or not there is a significant difference between the hourly wages of two companies,the following data have been accumulated.
Refer to Exhibit 10-13.The test statistic has a value of
A)1.96
B)1.645
C)0.80
D)2.7
In order to determine whether or not there is a significant difference between the hourly wages of two companies,the following data have been accumulated.
Refer to Exhibit 10-13.The test statistic has a value of
A)1.96
B)1.645
C)0.80
D)2.7
Unlock Deck
Unlock for access to all 121 flashcards in this deck.
Unlock Deck
k this deck
48
Exhibit 10-13
In order to determine whether or not there is a significant difference between the hourly wages of two companies,the following data have been accumulated.
-Refer to Exhibit 10-13.The null hypothesis for this test is
A) 1 - 2 0
B) 1 - 2 > 0
C) 1 - 2 < 0
D) 1 - 2 = 0
In order to determine whether or not there is a significant difference between the hourly wages of two companies,the following data have been accumulated.
-Refer to Exhibit 10-13.The null hypothesis for this test is
A) 1 - 2 0
B) 1 - 2 > 0
C) 1 - 2 < 0
D) 1 - 2 = 0
Unlock Deck
Unlock for access to all 121 flashcards in this deck.
Unlock Deck
k this deck
49
Exhibit 10-10
The results of a recent poll on the preference of shoppers regarding two products are shown below.
Refer to Exhibit 10-10.The standard error of
Is
A)52
B)0.044
C)0.0225
D)100
The results of a recent poll on the preference of shoppers regarding two products are shown below.
Refer to Exhibit 10-10.The standard error of
Is
A)52
B)0.044
C)0.0225
D)100
Unlock Deck
Unlock for access to all 121 flashcards in this deck.
Unlock Deck
k this deck
50
Exhibit 10-8
In order to determine whether or not there is a significant difference between the hourly wages of two companies,the following data have been accumulated.
Refer to Exhibit 10-8.The null hypothesis
A)should be rejected
B)should not be rejected
C)should be revised
D)None of these alternatives is correct.
Unlock Deck
Unlock for access to all 121 flashcards in this deck.
Unlock Deck
k this deck
51
Exhibit 10-12
The results of a recent poll on the preference of teenagers regarding the types of music they listen to are shown below.
Refer to Exhibit 10-12.The point estimate for the difference between the proportions is
A)-0.02
B)0.048
C)100
D)66
The results of a recent poll on the preference of teenagers regarding the types of music they listen to are shown below.
Refer to Exhibit 10-12.The point estimate for the difference between the proportions is
A)-0.02
B)0.048
C)100
D)66
Unlock Deck
Unlock for access to all 121 flashcards in this deck.
Unlock Deck
k this deck
52
Exhibit 10-8
In order to determine whether or not there is a significant difference between the hourly wages of two companies,the following data have been accumulated.
Refer to Exhibit 10-8.The test statistic is
A)0.098
B)1.645
C)2.75
D)3.01
In order to determine whether or not there is a significant difference between the hourly wages of two companies,the following data have been accumulated.
Refer to Exhibit 10-8.The test statistic is
A)0.098
B)1.645
C)2.75
D)3.01
Unlock Deck
Unlock for access to all 121 flashcards in this deck.
Unlock Deck
k this deck
53
Exhibit 10-12
The results of a recent poll on the preference of teenagers regarding the types of music they listen to are shown below.
Refer to Exhibit 10-12.The 95% confidence interval for the difference between the two proportions is
A)384 to 450
B)0.48 to 0.5
C)0.028 to 0.068
D)-0.068 to 0.028
The results of a recent poll on the preference of teenagers regarding the types of music they listen to are shown below.
Refer to Exhibit 10-12.The 95% confidence interval for the difference between the two proportions is
A)384 to 450
B)0.48 to 0.5
C)0.028 to 0.068
D)-0.068 to 0.028
Unlock Deck
Unlock for access to all 121 flashcards in this deck.
Unlock Deck
k this deck
54
Exhibit 10-13
In order to determine whether or not there is a significant difference between the hourly wages of two companies,the following data have been accumulated.
Refer to Exhibit 10-13.The point estimate of the difference between the means is
A)20
B)0.8
C)0.50
D)-20
In order to determine whether or not there is a significant difference between the hourly wages of two companies,the following data have been accumulated.
Refer to Exhibit 10-13.The point estimate of the difference between the means is
A)20
B)0.8
C)0.50
D)-20
Unlock Deck
Unlock for access to all 121 flashcards in this deck.
Unlock Deck
k this deck
55
Exhibit 10-11
An insurance company selected samples of clients under 18 years of age and over 18 and recorded the number of accidents they had in the previous year.The results are shown below.
We are interested in determining if the accident proportions differ between the two age groups.
Refer to Exhibit 10-11.The test statistic is
A)0.96
B)1.96
C)2.96
D)3.96
An insurance company selected samples of clients under 18 years of age and over 18 and recorded the number of accidents they had in the previous year.The results are shown below.
We are interested in determining if the accident proportions differ between the two age groups.Refer to Exhibit 10-11.The test statistic is
A)0.96
B)1.96
C)2.96
D)3.96
Unlock Deck
Unlock for access to all 121 flashcards in this deck.
Unlock Deck
k this deck
56
Exhibit 10-9
Two major automobile manufacturers have produced compact cars with the same size engines.We are interested in determining whether or not there is a significant difference in the MPG (miles per gallon)of the two brands of automobiles.A random sample of eight cars from each manufacturer is selected,and eight drivers are selected to drive each automobile for a specified distance.The following data show the results of the test.
Refer to Exhibit 10-9.The test statistic is
A)1.645
B)1.96
C)2.096
D)2.256
Unlock Deck
Unlock for access to all 121 flashcards in this deck.
Unlock Deck
k this deck
57
Exhibit 10-12
The results of a recent poll on the preference of teenagers regarding the types of music they listen to are shown below.
Refer to Exhibit 10-12.The standard error of
Is
A)0.48
B)0.50
C)0.03
D)0.0243
The results of a recent poll on the preference of teenagers regarding the types of music they listen to are shown below.
Refer to Exhibit 10-12.The standard error of
Is
A)0.48
B)0.50
C)0.03
D)0.0243
Unlock Deck
Unlock for access to all 121 flashcards in this deck.
Unlock Deck
k this deck
58
Exhibit 10-11
An insurance company selected samples of clients under 18 years of age and over 18 and recorded the number of accidents they had in the previous year.The results are shown below.
We are interested in determining if the accident proportions differ between the two age groups.
-Refer to Exhibit 10-11 and let pu represent the proportion under and po the proportion over the age of 18.The null hypothesis is
A)pu - po 0
B)pu - po 0
C)pu - po 0
D)pu - po = 0
An insurance company selected samples of clients under 18 years of age and over 18 and recorded the number of accidents they had in the previous year.The results are shown below.
We are interested in determining if the accident proportions differ between the two age groups.-Refer to Exhibit 10-11 and let pu represent the proportion under and po the proportion over the age of 18.The null hypothesis is
A)pu - po 0
B)pu - po 0
C)pu - po 0
D)pu - po = 0
Unlock Deck
Unlock for access to all 121 flashcards in this deck.
Unlock Deck
k this deck
59
Exhibit 10-10
The results of a recent poll on the preference of shoppers regarding two products are shown below.
Refer to Exhibit 10-10.The 95% confidence interval estimate for the difference between the populations favoring the products is
A)-0.024 to 0.064
B)0.6 to 0.7
C)0.024 to 0.7
D)0.02 to 0.3
The results of a recent poll on the preference of shoppers regarding two products are shown below.
Refer to Exhibit 10-10.The 95% confidence interval estimate for the difference between the populations favoring the products is
A)-0.024 to 0.064
B)0.6 to 0.7
C)0.024 to 0.7
D)0.02 to 0.3
Unlock Deck
Unlock for access to all 121 flashcards in this deck.
Unlock Deck
k this deck
60
Exhibit 10-10
The results of a recent poll on the preference of shoppers regarding two products are shown below.
Refer to Exhibit 10-10.The point estimate for the difference between the two population proportions in favor of this product is
A)52
B)100
C)0.44
D)0.02
The results of a recent poll on the preference of shoppers regarding two products are shown below.
Refer to Exhibit 10-10.The point estimate for the difference between the two population proportions in favor of this product is
A)52
B)100
C)0.44
D)0.02
Unlock Deck
Unlock for access to all 121 flashcards in this deck.
Unlock Deck
k this deck
61
In order to estimate the difference between the yearly incomes of marketing managers in the East and West of the United States,the following information was gathered.
a.Develop an interval estimate for the difference between the average yearly incomes of the marketing managers in the East and West.Use = 0.05.
b.At 95% confidence,use the p-value approach and test to determine if the average yearly income of marketing managers in the East is significantly different from the West.
Unlock Deck
Unlock for access to all 121 flashcards in this deck.
Unlock Deck
k this deck
62
In order to estimate the difference between the average Miles per Gallon of two different models of automobiles,samples are taken and the following information is collected.
a.At 95% confidence develop an interval estimate for the difference between the average Miles per Gallon for the two models.
b.Is there conclusive evidence to indicate that one model gets a higher MPG than the other? Why or why not? Explain.
a.At 95% confidence develop an interval estimate for the difference between the average Miles per Gallon for the two models.
b.Is there conclusive evidence to indicate that one model gets a higher MPG than the other? Why or why not? Explain.
Unlock Deck
Unlock for access to all 121 flashcards in this deck.
Unlock Deck
k this deck
63
In order to determine whether or not a driver's education course improves the scores on a driving exam,a sample of 6 students were given the exam before and after taking the course.The results are shown below.
Let d = Score After - Score Before.
a.Compute the test statistic.
b.At 95% confidence using the p-value approach,test to see if taking the course actually increased scores on the driving exam.
Let d = Score After - Score Before.
a.Compute the test statistic.
b.At 95% confidence using the p-value approach,test to see if taking the course actually increased scores on the driving exam.
Unlock Deck
Unlock for access to all 121 flashcards in this deck.
Unlock Deck
k this deck
64
Exhibit 10-13
In order to determine whether or not there is a significant difference between the hourly wages of two companies,the following data have been accumulated.
Refer to Exhibit 10-13.The p-value is
A)0.0035
B)0.007
C)0.4965
D)1.96
In order to determine whether or not there is a significant difference between the hourly wages of two companies,the following data have been accumulated.
Refer to Exhibit 10-13.The p-value is
A)0.0035
B)0.007
C)0.4965
D)1.96
Unlock Deck
Unlock for access to all 121 flashcards in this deck.
Unlock Deck
k this deck
65
A potential investor conducted a 144 day survey in each theater in order to determine the difference between the average daily attendance at the North Mall and South Mall theaters.The North Mall Theater averaged 630 patrons per day;while the South Mall Theater averaged 598 patrons per day.From past information,it is known that the variance for North Mall is 1,000;while the variance for the South Mall is 1,304.Develop a 95% confidence interval for the difference between the average daily attendance at the two theaters.
Unlock Deck
Unlock for access to all 121 flashcards in this deck.
Unlock Deck
k this deck
66
Among a sample of 50 M.D.'s (medical doctors)in the city of Memphis,Tennessee,10 indicated they make house calls;while among a sample of 100 M.D.'s in Atlanta,Georgia,18 said they make house calls.Determine a 95% interval estimate for the difference between the proportion of doctors who make house calls in the two cities.
Unlock Deck
Unlock for access to all 121 flashcards in this deck.
Unlock Deck
k this deck
67
Consider the following results for two samples randomly taken from two populations.
a.What are the degrees of freedom for the t distribution?
b.At 95% confidence,compute the margin of error.
c.Develop a 95% confidence interval for the difference between the two population means.
a.What are the degrees of freedom for the t distribution?
b.At 95% confidence,compute the margin of error.
c.Develop a 95% confidence interval for the difference between the two population means.
Unlock Deck
Unlock for access to all 121 flashcards in this deck.
Unlock Deck
k this deck
68
Of 150 Chattanooga residents surveyed,60 indicated that they participated in a recycling program.In Knoxville,120 residents were surveyed and 36 claimed to recycle.
a.Determine a 95% confidence interval estimate for the difference between the proportion of residents recycling in the two cities.
b.From your answer in Part a,is there sufficient evidence to conclude that there is a significant difference in the proportion of residents participating in a recycling program?
Unlock Deck
Unlock for access to all 121 flashcards in this deck.
Unlock Deck
k this deck
69
Consider the following results for two samples randomly taken from two populations.
a.Determine the degrees of freedom for the t-distribution.
b.Develop a 95% confidence interval for the difference between the two population means.
a.Determine the degrees of freedom for the t-distribution.
b.Develop a 95% confidence interval for the difference between the two population means.
Unlock Deck
Unlock for access to all 121 flashcards in this deck.
Unlock Deck
k this deck
70
Of 300 female registered voters surveyed,120 indicated they were planning to vote for the incumbent president;while of 400 male registered voters,140 indicated they were planning to vote for the incumbent president.
a.Compute the test statistic.
b.At alpha = .05,test to see if there is a significant difference between the proportions of females and males who plan to vote for the incumbent president.(Use the p-value approach. )
a.Compute the test statistic.
b.At alpha = .05,test to see if there is a significant difference between the proportions of females and males who plan to vote for the incumbent president.(Use the p-value approach. )
Unlock Deck
Unlock for access to all 121 flashcards in this deck.
Unlock Deck
k this deck
71
The business manager of a local health clinic is interested in estimating the difference between the fees for extended office visits in her center and the fees of a newly opened group practice.She gathered the following information regarding the two offices.
Develop a 95% confidence interval estimate for the difference between the average fees of the two offices.
Develop a 95% confidence interval estimate for the difference between the average fees of the two offices.
Unlock Deck
Unlock for access to all 121 flashcards in this deck.
Unlock Deck
k this deck
72
A comparative study of organic and conventionally grown produce was checked for the presence of E.coli.Results are summarized below.Is there a significant difference in the proportion of E.Coli in organic vs.conventionally grown produce? Test at = 0.10.
Unlock Deck
Unlock for access to all 121 flashcards in this deck.
Unlock Deck
k this deck
73
In order to estimate the difference between the average daily sales of two branches of a department store,the following data has been gathered.
a.Determine the point estimate of the difference between the means.
b.Determine the degrees of freedom for this interval estimation.
c.Compute the margin of error.
d.Develop a 95% confidence interval for the difference between the two population means.
a.Determine the point estimate of the difference between the means.
b.Determine the degrees of freedom for this interval estimation.
c.Compute the margin of error.
d.Develop a 95% confidence interval for the difference between the two population means.
Unlock Deck
Unlock for access to all 121 flashcards in this deck.
Unlock Deck
k this deck
74
Of 200 UTC seniors surveyed,60 were planning on attending Graduate School.At UTK,400 seniors were surveyed and 100 indicated that they were planning to attend Graduate School.
a.Determine a 95% confidence interval estimate for the difference between the proportion of seniors at the two universities that were planning to attend Graduate School.
b.Is there conclusive evidence to prove that the proportion of students from UTC who plan to go to Graduate School is significantly more than those from UTK? Explain.
Unlock Deck
Unlock for access to all 121 flashcards in this deck.
Unlock Deck
k this deck
75
Maxforce,Inc. ,manufactures racquetball racquets by two different manufacturing processes (A and B).Because the management of this company is interested in estimating the difference between the average time it takes each process to produce a racquet,they select independent samples from each process.The results of the samples are shown below.
a.Develop a 95% confidence interval estimate for the difference between the average time of the two processes.
b.Is there conclusive evidence to prove that one process takes longer than the other? If yes,which process? Explain.
a.Develop a 95% confidence interval estimate for the difference between the average time of the two processes.
b.Is there conclusive evidence to prove that one process takes longer than the other? If yes,which process? Explain.
Unlock Deck
Unlock for access to all 121 flashcards in this deck.
Unlock Deck
k this deck
76
The following sample information is given concerning the ACT scores of high school seniors form two local schools.
Develop a 95% confidence interval estimate for the difference between the two populations.
Develop a 95% confidence interval estimate for the difference between the two populations.
Unlock Deck
Unlock for access to all 121 flashcards in this deck.
Unlock Deck
k this deck
77
The management of Regional Hospital has made substantial improvements in their hospital and would like to test and determine whether there has been a significant decrease in the average length of stay of their patients in their hospital.The following data has been accumulated from before and after the improvements.At 95% confidence,test to determine if there has been a significant reduction in the average length of stay.
a.Formulate the hypotheses.
b.Compute the test statistic.
c.Using the p-value approach,test to see if the average length of stay in RFH is significantly less than the average length of stay in GH.Let = 0.05.
a.Formulate the hypotheses.
b.Compute the test statistic.
c.Using the p-value approach,test to see if the average length of stay in RFH is significantly less than the average length of stay in GH.Let = 0.05.
Unlock Deck
Unlock for access to all 121 flashcards in this deck.
Unlock Deck
k this deck
78
Consider the following results for two samples randomly taken from two normal populations with equal variances.
a.Develop a 95% confidence interval for the difference between the two population means.
b.Is there conclusive evidence that one population has a larger mean? Explain.
a.Develop a 95% confidence interval for the difference between the two population means.
b.Is there conclusive evidence that one population has a larger mean? Explain.
Unlock Deck
Unlock for access to all 121 flashcards in this deck.
Unlock Deck
k this deck
79
A random sample of 89 tourists in Chattanooga showed that they spent an average of $2,860 (in a week)with a standard deviation of $126;and a sample of 64 tourists in Orlando showed that they spent an average of $2,935 (in a week)with a standard deviation of $138.We are interested in determining if there is any significant difference between the average expenditures of those who visited the two cities?
a.Determine the degrees of freedom for this test.
b.Compute the test statistic.
c.Compute the p-value.
d.What is your conclusion? Let = .05.
a.Determine the degrees of freedom for this test.
b.Compute the test statistic.
c.Compute the p-value.
d.What is your conclusion? Let = .05.
Unlock Deck
Unlock for access to all 121 flashcards in this deck.
Unlock Deck
k this deck
80
Independent random samples taken on two university campuses revealed the following information concerning the average amount of money spent on textbooks during the fall semester.
We want to determine if,on the average,students at University A spent more on textbooks then the students at University B.
a.Compute the test statistic.
b.Compute the p-value.
c.What is your conclusion? Let = .05.
We want to determine if,on the average,students at University A spent more on textbooks then the students at University B.
a.Compute the test statistic.
b.Compute the p-value.
c.What is your conclusion? Let = .05.
Unlock Deck
Unlock for access to all 121 flashcards in this deck.
Unlock Deck
k this deck
Unlock Deck
Unlock for access to all 121 flashcards in this deck.


