Exam 10: Statistical Inference About Means and Proportions With Two Populations
Exam 1: Data and Statistics98 Questions
Exam 2: Descriptive Statistics: Tabular and Graphical Presentations64 Questions
Exam 3: Descriptive Statistics: Numerical Measures156 Questions
Exam 4: Introduction to Probability138 Questions
Exam 5: Discrete Probability Distributions122 Questions
Exam 6: Continuous Probability Distributions165 Questions
Exam 7: Sampling and Sampling Distributions131 Questions
Exam 8: Interval Estimation131 Questions
Exam 9: Hypothesis Tests133 Questions
Exam 10: Statistical Inference About Means and Proportions With Two Populations121 Questions
Exam 11: Inferences About Population Variances91 Questions
Exam 12: Tests of Goodness of Fit and Independence80 Questions
Exam 13: Analysis of Variance and Experimental Design113 Questions
Exam 14: Simple Linear Regression140 Questions
Exam 15: Multiple Regression106 Questions
Exam 16: Regression Analysis: Model Building75 Questions
Exam 17: Index Numbers52 Questions
Exam 18: Forecasting67 Questions
Exam 19: Nonparametric Methods81 Questions
Exam 20: Statistical Methods for Quality Control30 Questions
Exam 21: Decision Analysis65 Questions
Exam 22: Sample Survey63 Questions
Select questions type
During the recent primary elections,the democratic presidential candidate showed the following pre-election voter support in Alabama and Mississippi.
 a.We want to determine whether or not the proportions of voters favoring the Democratic candidate were the same in both states.Provide the hypotheses.
b.Compute the test statistic.
c.Determine the p-value;and at 95% confidence,test the above hypotheses.
a.We want to determine whether or not the proportions of voters favoring the Democratic candidate were the same in both states.Provide the hypotheses.
b.Compute the test statistic.
c.Determine the p-value;and at 95% confidence,test the above hypotheses.
Free
(Essay)
4.8/5  (32)
(32)
Correct Answer: Verified
a.H0: P1 - P2 = 0
Ha: P1 - P2 0
b.Z = -1.87
c.p-value = 0.0614 (using the normal distribution);do not reject H0
In order to improve the grades of students at UTC,several incentive programs have been introduced.Results of random samples of grades from after and before the incentive programs are given below.
 a.Give the hypotheses.
b.Compute the test statistic.
c.At a 0.1 level of significance,test tto determine whether the incentive programs have significantly increased the average grades.
a.Give the hypotheses.
b.Compute the test statistic.
c.At a 0.1 level of significance,test tto determine whether the incentive programs have significantly increased the average grades.
Free
(Essay)
4.7/5 (22)
Correct Answer:Verified
a.H0: after - before 0
Ha: after - before > 0
b.t = 1.632
c.p-value is between .05 to 0.1,reject H0
From production line A,a sample of 500 items is selected at random,and it is determined that 30 items are defective.In a sample of 300 items from production process B (which produces identical items to line A),there are 12 defective items.Determine a 95% confidence interval estimate for the difference between the proportion of defectives in the two lines.
Free
(Essay)
4.8/5 (32)
Correct Answer:Verified
-0.01 to 0.05
Exhibit 10-8
In order to determine whether or not there is a significant difference between the hourly wages of two companies,the following data have been accumulated.
 -Refer to Exhibit 10-8.The null hypothesis
(Multiple Choice)
4.8/5 (29)
Exhibit 10-4
The following information was obtained from independent random samples.
Assume normally distributed populations with equal variances.
 -Refer to Exhibit 10-4.The 95% confidence interval for the difference between the two population means is
(Multiple Choice)
4.7/5 (38)
A potential investor conducted a 49 day survey in two theaters in order to determine the difference between the average daily attendance at North Mall and South Mall Theaters.The North Mall Theater averaged 720 patrons per day with a variance of 100;while the South Mall Theater averaged 700 patrons per day with a variance of 96.Develop an interval estimate for the difference between the average daily attendance at the two theaters.Use a confidence coefficient of 0.95.
(Essay)
4.9/5 (31)
The following sample information is given concerning the ACT scores of high school seniors form two local schools.
 Develop a 95% confidence interval estimate for the difference between the two populations.
(Essay)
4.9/5 (35)
Allied Corporation is trying to determine whether to purchase Machine A or B.It has leased the two machines for a month.A random sample of 5 employees has been taken.These employees have gone through a training session on both machines.Below you are given information on their productivity rate on both machines.(Let the difference d = Machine A - Machine B. )
 a.State the null and alternative hypotheses for a two-tailed test.
b.Find the mean and standard deviation for the difference.
c.Compute the test statistic.
d.Test the null hypothesis stated in Part a at the 10% level.
a.State the null and alternative hypotheses for a two-tailed test.
b.Find the mean and standard deviation for the difference.
c.Compute the test statistic.
d.Test the null hypothesis stated in Part a at the 10% level.
(Essay)
4.8/5 (29)
Exhibit 10-13
In order to determine whether or not there is a significant difference between the hourly wages of two companies,the following data have been accumulated.
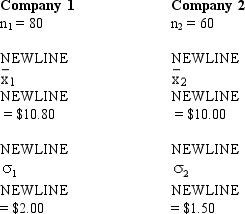 -Refer to Exhibit 10-13.The point estimate of the difference between the means is
(Multiple Choice)
4.8/5 (34)
Exhibit 10-11
An insurance company selected samples of clients under 18 years of age and over 18 and recorded the number of accidents they had in the previous year.The results are shown below.
 We are interested in determining if the accident proportions differ between the two age groups.
-Refer to Exhibit 10-11.The p-value is
We are interested in determining if the accident proportions differ between the two age groups.
-Refer to Exhibit 10-11.The p-value is
(Multiple Choice)
4.9/5 (38)
The management of Regional Hospital has made substantial improvements in their hospital and would like to test and determine whether there has been a significant decrease in the average length of stay of their patients in their hospital.The following data has been accumulated from before and after the improvements.At 95% confidence,test to determine if there has been a significant reduction in the average length of stay.
 a.Formulate the hypotheses.
b.Compute the test statistic.
c.Using the p-value approach,test to see if the average length of stay in RFH is significantly less than the average length of stay in GH.Let = 0.05.
a.Formulate the hypotheses.
b.Compute the test statistic.
c.Using the p-value approach,test to see if the average length of stay in RFH is significantly less than the average length of stay in GH.Let = 0.05.
(Essay)
4.8/5 (32)
Independent random samples of managers' yearly salaries (in $1000)taken from governmental and private organizations provided the following information.At 95% confidence,test to determine if there is a significant difference between the average salaries of the managers in the two sectors.

(Essay)
4.9/5 (33)
Exhibit 10-9
Two major automobile manufacturers have produced compact cars with the same size engines.We are interested in determining whether or not there is a significant difference in the MPG (miles per gallon)of the two brands of automobiles.A random sample of eight cars from each manufacturer is selected,and eight drivers are selected to drive each automobile for a specified distance.The following data show the results of the test.
 -Refer to Exhibit 10-9.The mean for the differences is
(Multiple Choice)
4.8/5 (34)
Exhibit 10-9
Two major automobile manufacturers have produced compact cars with the same size engines.We are interested in determining whether or not there is a significant difference in the MPG (miles per gallon)of the two brands of automobiles.A random sample of eight cars from each manufacturer is selected,and eight drivers are selected to drive each automobile for a specified distance.The following data show the results of the test.
-Refer to Exhibit 10-9.At 90% confidence the null hypothesis
(Multiple Choice)
4.8/5 (37)
The results of a recent poll on the preference of voters regarding presidential candidates are shown below.
 At 95% confidence,test to determine whether or not there is a significant difference between the preferences for the two candidates.
(Essay)
4.9/5 (30)
A potential investor conducted a 144 day survey in each theater in order to determine the difference between the average daily attendance at the North Mall and South Mall theaters.The North Mall Theater averaged 630 patrons per day;while the South Mall Theater averaged 598 patrons per day.From past information,it is known that the variance for North Mall is 1,000;while the variance for the South Mall is 1,304.Develop a 95% confidence interval for the difference between the average daily attendance at the two theaters.
(Essay)
4.7/5 (29)
Independent random samples taken at two local malls provided the following information regarding purchases by patrons of the two malls.
 We want to determine whether or not there is a significant difference between the average purchases by the patrons of the two malls.
a.Give the hypotheses for the above.
b.Compute the test statistic.
c.At 95% confidence,test the hypotheses.
We want to determine whether or not there is a significant difference between the average purchases by the patrons of the two malls.
a.Give the hypotheses for the above.
b.Compute the test statistic.
c.At 95% confidence,test the hypotheses.
(Essay)
4.7/5 (37)
Exhibit 10-13
In order to determine whether or not there is a significant difference between the hourly wages of two companies,the following data have been accumulated.
-Refer to Exhibit 10-13.The p-value is
(Multiple Choice)
5.0/5 (47)
Exhibit 10-3
A statistics teacher wants to see if there is any difference in the abilities of students enrolled in statistics today and those enrolled five years ago.A sample of final examination scores from students enrolled today and from students enrolled five years ago was taken.You are given the following information.
 -Refer to Exhibit 10-3.The standard error of
  Is
Is
(Multiple Choice)
4.9/5 (25)
Filters
- Essay(0)
- Multiple Choice(0)
- Short Answer(0)
- True False(0)
- Matching(0)