Deck 15: Multiple Regression
Full screen (f)
Question
Question
Question
Question
Question
Question
Question
The mathematical equation relating the expected value of the dependent variable to the value of the independent variables,which has the form of E(y)= 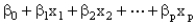
Is
A)a simple linear regression model
B)a multiple nonlinear regression model
C)an estimated multiple regression equation
D)a multiple regression equation
Is
A)a simple linear regression model
B)a multiple nonlinear regression model
C)an estimated multiple regression equation
D)a multiple regression equation
Question
Question
The estimate of the multiple regression equation based on the sample data,which has the form of E(y)= 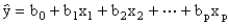
Is
A)a simple linear regression model
B)a multiple nonlinear regression model
C)an estimated multiple regression equation
D)a multiple regression equation
Is
A)a simple linear regression model
B)a multiple nonlinear regression model
C)an estimated multiple regression equation
D)a multiple regression equation
Question
Question
Question
Question
Question
Question
Question
Question
Question
Question
Question
Question
Question
Question
Question
Question
Question
A multiple regression model has the form 
As x1 increases by 1 unit (holding x2 constant),y is expected to
A)increase by 9 units
B)decrease by 9 units
C)increase by 2 units
D)decrease by 2 units
As x1 increases by 1 unit (holding x2 constant),y is expected to
A)increase by 9 units
B)decrease by 9 units
C)increase by 2 units
D)decrease by 2 units
Question
Question
Question
Question
Question
Question
Question
Question
Question
Question
Question
Question
Question
Question
A multiple regression model has the form 
As X increases by 1 unit (holding W constant),Y is expected to
A)increase by 11 units
B)decrease by 11 units
C)increase by 6 units
D)decrease by 6 units
As X increases by 1 unit (holding W constant),Y is expected to
A)increase by 11 units
B)decrease by 11 units
C)increase by 6 units
D)decrease by 6 units
Question
Exhibit 15-1
In a regression model involving 44 observations,the following estimated regression equation was obtained.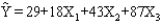 For this model SSR = 600 and SSE = 400.
Refer to Exhibit 15-1.The coefficient of determination for the above model is
A)0.667
B)0.600
C)0.336
D)o.400
In a regression model involving 44 observations,the following estimated regression equation was obtained.
For this model SSR = 600 and SSE = 400.Refer to Exhibit 15-1.The coefficient of determination for the above model is
A)0.667
B)0.600
C)0.336
D)o.400
Question
Question
Exhibit 15-2
A regression model between sales (Y in $1,000),unit price (X1 in dollars)and television advertisement (X2 in dollars)resulted in the following function: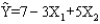 For this model SSR = 3500,SSE = 1500,and the sample size is 18.
Refer to Exhibit 15-2.To test for the significance of the model,the test statistic F is
A)2.33
B)0.70
C)17.5
D)1.75
A regression model between sales (Y in $1,000),unit price (X1 in dollars)and television advertisement (X2 in dollars)resulted in the following function:
For this model SSR = 3500,SSE = 1500,and the sample size is 18.Refer to Exhibit 15-2.To test for the significance of the model,the test statistic F is
A)2.33
B)0.70
C)17.5
D)1.75
Question
Exhibit 15-2
A regression model between sales (Y in $1,000),unit price (X1 in dollars)and television advertisement (X2 in dollars)resulted in the following function: For this model SSR = 3500,SSE = 1500,and the sample size is 18.
Refer to Exhibit 15-2.The coefficient of X2 indicates that if television advertising is increased by $1 (holding the unit price constant),sales are expected to
A)increase by $5
B)increase by $12,000
C)increase by $5,000
D)decrease by $2,000
A regression model between sales (Y in $1,000),unit price (X1 in dollars)and television advertisement (X2 in dollars)resulted in the following function:
For this model SSR = 3500,SSE = 1500,and the sample size is 18.Refer to Exhibit 15-2.The coefficient of X2 indicates that if television advertising is increased by $1 (holding the unit price constant),sales are expected to
A)increase by $5
B)increase by $12,000
C)increase by $5,000
D)decrease by $2,000
Question
Exhibit 15-4
a.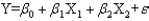 b.
b. 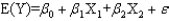 c.
c.  d.
d. 
Which equation describes the multiple regression model?
A)Equation A
B)Equation B
C)Equation C
D)Equation D
a.
b. c. d. Which equation describes the multiple regression model?
A)Equation A
B)Equation B
C)Equation C
D)Equation D
Question
Exhibit 15-2
A regression model between sales (Y in $1,000),unit price (X1 in dollars)and television advertisement (X2 in dollars)resulted in the following function: For this model SSR = 3500,SSE = 1500,and the sample size is 18.
Refer to Exhibit 15-2.To test for the significance of the model,the p-value is
A)less than 0.01
B)between 0.01 and 0.025
C)between 0.025 and 0.05
D)between 0.05 and 0.10
A regression model between sales (Y in $1,000),unit price (X1 in dollars)and television advertisement (X2 in dollars)resulted in the following function:
For this model SSR = 3500,SSE = 1500,and the sample size is 18.Refer to Exhibit 15-2.To test for the significance of the model,the p-value is
A)less than 0.01
B)between 0.01 and 0.025
C)between 0.025 and 0.05
D)between 0.05 and 0.10
Question
Exhibit 15-2
PTS: 1 TOP: Multiple Regression
NARRBEGIN: Exhibit 15-3
Exhibit 15-3
In a regression model involving 30 observations,the following estimated regression equation was obtained: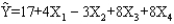 For this model SSR = 700 and SSE = 100.
Refer to Exhibit 15-3.The computed F statistic for testing the significance of the above model is
A)43.75
B)0.875
C)50.19
D)7.00
PTS: 1 TOP: Multiple Regression
NARRBEGIN: Exhibit 15-3
Exhibit 15-3
In a regression model involving 30 observations,the following estimated regression equation was obtained:
For this model SSR = 700 and SSE = 100.Refer to Exhibit 15-3.The computed F statistic for testing the significance of the above model is
A)43.75
B)0.875
C)50.19
D)7.00
Question
Question
Question
Exhibit 15-2
PTS: 1 TOP: Multiple Regression
NARRBEGIN: Exhibit 15-3
Exhibit 15-3
In a regression model involving 30 observations,the following estimated regression equation was obtained: For this model SSR = 700 and SSE = 100.
Refer to Exhibit 15-3.The critical F value at 95% confidence is
A)2.53
B)2.69
C)2.76
D)2.99
PTS: 1 TOP: Multiple Regression
NARRBEGIN: Exhibit 15-3
Exhibit 15-3
In a regression model involving 30 observations,the following estimated regression equation was obtained:
For this model SSR = 700 and SSE = 100.Refer to Exhibit 15-3.The critical F value at 95% confidence is
A)2.53
B)2.69
C)2.76
D)2.99
Question
Exhibit 15-1
In a regression model involving 44 observations,the following estimated regression equation was obtained. For this model SSR = 600 and SSE = 400.
Refer to Exhibit 15-1.MSR for this model is
A)200
B)10
C)1,000
D)43
In a regression model involving 44 observations,the following estimated regression equation was obtained.
For this model SSR = 600 and SSE = 400.Refer to Exhibit 15-1.MSR for this model is
A)200
B)10
C)1,000
D)43
Question
Exhibit 15-2
PTS: 1 TOP: Multiple Regression
NARRBEGIN: Exhibit 15-3
Exhibit 15-3
In a regression model involving 30 observations,the following estimated regression equation was obtained: For this model SSR = 700 and SSE = 100.
Refer to Exhibit 15-3.The coefficient of determination for the above model is approximately
A)-0.875
B)0.875
C)0.125
D)0.144
PTS: 1 TOP: Multiple Regression
NARRBEGIN: Exhibit 15-3
Exhibit 15-3
In a regression model involving 30 observations,the following estimated regression equation was obtained:
For this model SSR = 700 and SSE = 100.Refer to Exhibit 15-3.The coefficient of determination for the above model is approximately
A)-0.875
B)0.875
C)0.125
D)0.144
Question
Exhibit 15-2
PTS: 1 TOP: Multiple Regression
NARRBEGIN: Exhibit 15-3
Exhibit 15-3
In a regression model involving 30 observations,the following estimated regression equation was obtained: For this model SSR = 700 and SSE = 100.
Refer to Exhibit 15-3.The conclusion is that the
A)model is not significant
B)model is significant
C)slope of X1 is significant
D)slope of X2 is significant
PTS: 1 TOP: Multiple Regression
NARRBEGIN: Exhibit 15-3
Exhibit 15-3
In a regression model involving 30 observations,the following estimated regression equation was obtained:
For this model SSR = 700 and SSE = 100.Refer to Exhibit 15-3.The conclusion is that the
A)model is not significant
B)model is significant
C)slope of X1 is significant
D)slope of X2 is significant
Question
Exhibit 15-1
In a regression model involving 44 observations,the following estimated regression equation was obtained. For this model SSR = 600 and SSE = 400.
Refer to Exhibit 15-1.The computed F statistics for testing the significance of the above model is
A)1.500
B)20.00
C)0.600
D)0.6667
In a regression model involving 44 observations,the following estimated regression equation was obtained.
For this model SSR = 600 and SSE = 400.Refer to Exhibit 15-1.The computed F statistics for testing the significance of the above model is
A)1.500
B)20.00
C)0.600
D)0.6667
Question
Exhibit 15-5
Below you are given a partial Minitab output based on a sample of 25 observations.

Refer to Exhibit 15-5.The interpretation of the coefficient on X1 is that
A)a one unit change in X1 will lead to a 25.625 unit change in Y
B)a one unit change in X1 will lead to a 25.625 unit increase in Y when all other variables are held constant
C)a one unit change in X1 will lead to a 25.625 unit increase in X2 when all other variables are held constant
D)It is impossible to interpret the coefficient.
Below you are given a partial Minitab output based on a sample of 25 observations.
Refer to Exhibit 15-5.The interpretation of the coefficient on X1 is that
A)a one unit change in X1 will lead to a 25.625 unit change in Y
B)a one unit change in X1 will lead to a 25.625 unit increase in Y when all other variables are held constant
C)a one unit change in X1 will lead to a 25.625 unit increase in X2 when all other variables are held constant
D)It is impossible to interpret the coefficient.
Question
Exhibit 15-2
A regression model between sales (Y in $1,000),unit price (X1 in dollars)and television advertisement (X2 in dollars)resulted in the following function: For this model SSR = 3500,SSE = 1500,and the sample size is 18.
Refer to Exhibit 15-2.The coefficient of the unit price indicates that if the unit price is
A)increased by $1 (holding advertising constant),sales are expected to increase by $3
B)decreased by $1 (holding advertising constant),sales are expected to decrease by $3
C)increased by $1 (holding advertising constant),sales are expected to increase by $4,000
D)increased by $1 (holding advertising constant),sales are expected to decrease by $3,000
A regression model between sales (Y in $1,000),unit price (X1 in dollars)and television advertisement (X2 in dollars)resulted in the following function:
For this model SSR = 3500,SSE = 1500,and the sample size is 18.Refer to Exhibit 15-2.The coefficient of the unit price indicates that if the unit price is
A)increased by $1 (holding advertising constant),sales are expected to increase by $3
B)decreased by $1 (holding advertising constant),sales are expected to decrease by $3
C)increased by $1 (holding advertising constant),sales are expected to increase by $4,000
D)increased by $1 (holding advertising constant),sales are expected to decrease by $3,000
Question
Exhibit 15-2
A regression model between sales (Y in $1,000),unit price (X1 in dollars)and television advertisement (X2 in dollars)resulted in the following function: For this model SSR = 3500,SSE = 1500,and the sample size is 18.
Refer to Exhibit 15-2.The multiple coefficient of correlation for this problem is
A)0.70
B)0.8367
C)0.49
D)0.2289
A regression model between sales (Y in $1,000),unit price (X1 in dollars)and television advertisement (X2 in dollars)resulted in the following function:
For this model SSR = 3500,SSE = 1500,and the sample size is 18.Refer to Exhibit 15-2.The multiple coefficient of correlation for this problem is
A)0.70
B)0.8367
C)0.49
D)0.2289
Question
Question
Exhibit 15-4
a. b. c. d.
Which equation gives the estimated regression line?
A)Equation A
B)Equation B
C)Equation C
D)Equation D
a.
b. c. d. Which equation gives the estimated regression line?
A)Equation A
B)Equation B
C)Equation C
D)Equation D
Question
Exhibit 15-4
a. b. c. d.
Which equation describes the multiple regression equation?
A)Equation A
B)Equation B
C)Equation C
D)Equation D
a.
b. c. d. Which equation describes the multiple regression equation?
A)Equation A
B)Equation B
C)Equation C
D)Equation D
Question
Exhibit 15-6
Below you are given a partial computer output based on a sample of 16 observations.

Refer to Exhibit 15-6.The t value obtained from the table which is used to test an individual parameter at the 1% level is
A)2.65
B)2.921
C)2.977
D)3.012
Below you are given a partial computer output based on a sample of 16 observations.
Refer to Exhibit 15-6.The t value obtained from the table which is used to test an individual parameter at the 1% level is
A)2.65
B)2.921
C)2.977
D)3.012
Question
Exhibit 15-6
Below you are given a partial computer output based on a sample of 16 observations.
-Refer to Exhibit 15-6.We want to test whether the parameter 1 is significant.The test statistic equals
A)-1.4
B)1.4
C)3.6
D)5
Below you are given a partial computer output based on a sample of 16 observations.
-Refer to Exhibit 15-6.We want to test whether the parameter 1 is significant.The test statistic equals
A)-1.4
B)1.4
C)3.6
D)5
Question
Exhibit 15-8
The following estimated regression model was developed relating yearly income (Y in $1,000s)of 30 individuals with their age (X1)and their gender (X2)(0 if male and 1 if female).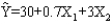 Also provided are SST = 1,200 and SSE = 384.
Refer to Exhibit 15-8.The yearly income of a 24-year-old male individual is
A)$13.80
B)$13,800
C)$46,800
D)$49,800
The following estimated regression model was developed relating yearly income (Y in $1,000s)of 30 individuals with their age (X1)and their gender (X2)(0 if male and 1 if female).
Also provided are SST = 1,200 and SSE = 384.Refer to Exhibit 15-8.The yearly income of a 24-year-old male individual is
A)$13.80
B)$13,800
C)$46,800
D)$49,800
Question
Exhibit 15-6
Below you are given a partial computer output based on a sample of 16 observations.
Refer to Exhibit 15-6.The test statistic used to determine if there is a relationship among the variables equals
A)-1.4
B)0.2
C)0.77
D)5
Below you are given a partial computer output based on a sample of 16 observations.
Refer to Exhibit 15-6.The test statistic used to determine if there is a relationship among the variables equals
A)-1.4
B)0.2
C)0.77
D)5
Question
Exhibit 15-8
The following estimated regression model was developed relating yearly income (Y in $1,000s)of 30 individuals with their age (X1)and their gender (X2)(0 if male and 1 if female). Also provided are SST = 1,200 and SSE = 384.
Refer to Exhibit 15-8.The multiple coefficient of determination is
A)0.32
B)0.42
C)0.68
D)0.50
The following estimated regression model was developed relating yearly income (Y in $1,000s)of 30 individuals with their age (X1)and their gender (X2)(0 if male and 1 if female).
Also provided are SST = 1,200 and SSE = 384.Refer to Exhibit 15-8.The multiple coefficient of determination is
A)0.32
B)0.42
C)0.68
D)0.50
Question
Exhibit 15-8
The following estimated regression model was developed relating yearly income (Y in $1,000s)of 30 individuals with their age (X1)and their gender (X2)(0 if male and 1 if female). Also provided are SST = 1,200 and SSE = 384.
Refer to Exhibit 15-8.From the above function,it can be said that the expected yearly income of
A)males is $3 more than females
B)females is $3 more than males
C)males is $3,000 more than females
D)females is $3,000 more than males
The following estimated regression model was developed relating yearly income (Y in $1,000s)of 30 individuals with their age (X1)and their gender (X2)(0 if male and 1 if female).
Also provided are SST = 1,200 and SSE = 384.Refer to Exhibit 15-8.From the above function,it can be said that the expected yearly income of
A)males is $3 more than females
B)females is $3 more than males
C)males is $3,000 more than females
D)females is $3,000 more than males
Question
Exhibit 15-7
A regression model involving 4 independent variables and a sample of 15 periods resulted in the following sum of squares.

Refer to Exhibit 15-7.The test statistic from the information provided is
A)2.110
B)3.480
C)4.710
D)6.875
A regression model involving 4 independent variables and a sample of 15 periods resulted in the following sum of squares.
Refer to Exhibit 15-7.The test statistic from the information provided is
A)2.110
B)3.480
C)4.710
D)6.875
Question
Exhibit 15-6
Below you are given a partial computer output based on a sample of 16 observations.
Refer to Exhibit 15-6.Carry out the test to determine if there is a relationship among the variables at the 5% level.The null hypothesis should
A)be rejected
B)not be rejected
C)revised
D)None of these alternatives is correct.
Question
Exhibit 15-5
Below you are given a partial Minitab output based on a sample of 25 observations.
-Refer to Exhibit 15-5.We want to test whether the parameter 1 is significant.The test statistic equals
A)0.357
B)2.8
C)14
D)1.96
Below you are given a partial Minitab output based on a sample of 25 observations.
-Refer to Exhibit 15-5.We want to test whether the parameter 1 is significant.The test statistic equals
A)0.357
B)2.8
C)14
D)1.96
Question
Exhibit 15-5
Below you are given a partial Minitab output based on a sample of 25 observations.
Refer to Exhibit 15-5.The t value obtained from the table to test an individual parameter at the 5% level is
A)2.06
B)2.069
C)2.074
D)2.080
Below you are given a partial Minitab output based on a sample of 25 observations.
Refer to Exhibit 15-5.The t value obtained from the table to test an individual parameter at the 5% level is
A)2.06
B)2.069
C)2.074
D)2.080
Question
Exhibit 15-6
Below you are given a partial computer output based on a sample of 16 observations.
Refer to Exhibit 15-6.The interpretation of the coefficient of X1 is that
A)a one unit change in X1 will lead to a 3.682 unit decrease in Y
B)a one unit increase in X1 will lead to a 3.682 unit decrease in Y when all other variables are held constant
C)a one unit increase in X1 will lead to a 3.682 unit decrease in X2 when all other variables are held constant
D)It is impossible to interpret the coefficient.
Question
Exhibit 15-5
Below you are given a partial Minitab output based on a sample of 25 observations.
-Refer to Exhibit 15-5.Carry out the test of significance for the parameter 1at the 5% level.The null hypothesis should be
A)rejected
B)not rejected
C)revised
D)None of these alternatives is correct.
Below you are given a partial Minitab output based on a sample of 25 observations.
-Refer to Exhibit 15-5.Carry out the test of significance for the parameter 1at the 5% level.The null hypothesis should be
A)rejected
B)not rejected
C)revised
D)None of these alternatives is correct.
Question
Exhibit 15-7
A regression model involving 4 independent variables and a sample of 15 periods resulted in the following sum of squares.
Refer to Exhibit 15-7.If we want to test for the significance of the model at 95% confidence,the critical F value (from the table)is
A)3.06
B)3.48
C)3.34
D)3.11
A regression model involving 4 independent variables and a sample of 15 periods resulted in the following sum of squares.
Refer to Exhibit 15-7.If we want to test for the significance of the model at 95% confidence,the critical F value (from the table)is
A)3.06
B)3.48
C)3.34
D)3.11
Question
Exhibit 15-6
Below you are given a partial computer output based on a sample of 16 observations.
-Refer to Exhibit 15-6.Carry out the test of significance for the parameter 1 at the 1% level.The null hypothesis should be
A)rejected
B)not rejected
C)revised
D)None of these alternatives is correct.
Below you are given a partial computer output based on a sample of 16 observations.
-Refer to Exhibit 15-6.Carry out the test of significance for the parameter 1 at the 1% level.The null hypothesis should be
A)rejected
B)not rejected
C)revised
D)None of these alternatives is correct.
Question
Exhibit 15-6
Below you are given a partial computer output based on a sample of 16 observations.
Refer to Exhibit 15-6.The estimated regression equation is
A)
B)
C)
D)
Below you are given a partial computer output based on a sample of 16 observations.
Refer to Exhibit 15-6.The estimated regression equation is
A)
B)
C)
D)
Question
Exhibit 15-6
Below you are given a partial computer output based on a sample of 16 observations.
Refer to Exhibit 15-6.The degrees of freedom for the sum of squares explained by the regression (SSR)are
A)2
B)3
C)13
D)15
Below you are given a partial computer output based on a sample of 16 observations.
Refer to Exhibit 15-6.The degrees of freedom for the sum of squares explained by the regression (SSR)are
A)2
B)3
C)13
D)15
Question
Exhibit 15-7
A regression model involving 4 independent variables and a sample of 15 periods resulted in the following sum of squares.
Refer to Exhibit 15-7.The coefficient of determination is
A)0.3636
B)0.7333
C)0.275
D)0.5
A regression model involving 4 independent variables and a sample of 15 periods resulted in the following sum of squares.
Refer to Exhibit 15-7.The coefficient of determination is
A)0.3636
B)0.7333
C)0.275
D)0.5
Question
Exhibit 15-6
Below you are given a partial computer output based on a sample of 16 observations.
Refer to Exhibit 15-6.The F value obtained from the table used to test if there is a relationship among the variables at the 5% level equals
A)3.41
B)3.63
C)3.81
D)19.41
Below you are given a partial computer output based on a sample of 16 observations.
Refer to Exhibit 15-6.The F value obtained from the table used to test if there is a relationship among the variables at the 5% level equals
A)3.41
B)3.63
C)3.81
D)19.41
Question
Exhibit 15-8
The following estimated regression model was developed relating yearly income (Y in $1,000s)of 30 individuals with their age (X1)and their gender (X2)(0 if male and 1 if female). Also provided are SST = 1,200 and SSE = 384.
Refer to Exhibit 15-8.The yearly income of a 24-year-old female individual is
A)$19.80
B)$19,800
C)$49.80
D)$49,800
The following estimated regression model was developed relating yearly income (Y in $1,000s)of 30 individuals with their age (X1)and their gender (X2)(0 if male and 1 if female).
Also provided are SST = 1,200 and SSE = 384.Refer to Exhibit 15-8.The yearly income of a 24-year-old female individual is
A)$19.80
B)$19,800
C)$49.80
D)$49,800
Question
Exhibit 15-6
Below you are given a partial computer output based on a sample of 16 observations.
Refer to Exhibit 15-6.The sum of squares due to error (SSE)equals
A)37.33
B)485.3
C)4,853
D)6,308.9
Below you are given a partial computer output based on a sample of 16 observations.
Refer to Exhibit 15-6.The sum of squares due to error (SSE)equals
A)37.33
B)485.3
C)4,853
D)6,308.9

Unlock Deck
Sign up to unlock the cards in this deck!
Unlock Deck
Unlock Deck
1/106
Play
Full screen (f)
Deck 15: Multiple Regression
1
In regression analysis,an outlier is an observation whose
A)mean is larger than the standard deviation
B)residual is zero
C)mean is zero
D)residual is much larger than the rest of the residual values
A)mean is larger than the standard deviation
B)residual is zero
C)mean is zero
D)residual is much larger than the rest of the residual values
D
2
In a multiple regression model,the error term is assumed to
A)have a mean of 1
B)have a variance of zero
C)have a standard deviation of 1
D)be normally distributed
A)have a mean of 1
B)have a variance of zero
C)have a standard deviation of 1
D)be normally distributed
be normally distributed
3
In regression analysis,the response variable is the
A)independent variable
B)dependent variable
C)slope of the regression function
D)intercept
A)independent variable
B)dependent variable
C)slope of the regression function
D)intercept
B
4
In multiple regression analysis,
A)there can be any number of dependent variables but only one independent variable
B)there must be only one independent variable
C)the coefficient of determination must be larger than 1
D)there can be several independent variables,but only one dependent variable
A)there can be any number of dependent variables but only one independent variable
B)there must be only one independent variable
C)the coefficient of determination must be larger than 1
D)there can be several independent variables,but only one dependent variable
Unlock Deck
Unlock for access to all 106 flashcards in this deck.
Unlock Deck
k this deck
5
A measure of goodness of fit for the estimated regression equation is the
A)multiple coefficient of determination
B)mean square due to error
C)mean square due to regression
D)sample size
A)multiple coefficient of determination
B)mean square due to error
C)mean square due to regression
D)sample size
Unlock Deck
Unlock for access to all 106 flashcards in this deck.
Unlock Deck
k this deck
6
The numerical value of the coefficient of determination
A)is always larger than the coefficient of correlation
B)is always smaller than the coefficient of correlation
C)is negative if the coefficient of determination is negative
D)can be larger or smaller than the coefficient of correlation
A)is always larger than the coefficient of correlation
B)is always smaller than the coefficient of correlation
C)is negative if the coefficient of determination is negative
D)can be larger or smaller than the coefficient of correlation
Unlock Deck
Unlock for access to all 106 flashcards in this deck.
Unlock Deck
k this deck
7
The mathematical equation relating the expected value of the dependent variable to the value of the independent variables,which has the form of E(y)=
Is
A)a simple linear regression model
B)a multiple nonlinear regression model
C)an estimated multiple regression equation
D)a multiple regression equation
Is
A)a simple linear regression model
B)a multiple nonlinear regression model
C)an estimated multiple regression equation
D)a multiple regression equation
Unlock Deck
Unlock for access to all 106 flashcards in this deck.
Unlock Deck
k this deck
8
In a multiple regression model,the variance of the error term is assumed to be
A)the same for all values of the dependent variable
B)zero
C)the same for all values of the independent variable
D)-1
A)the same for all values of the dependent variable
B)zero
C)the same for all values of the independent variable
D)-1
Unlock Deck
Unlock for access to all 106 flashcards in this deck.
Unlock Deck
k this deck
9
The estimate of the multiple regression equation based on the sample data,which has the form of E(y)=
Is
A)a simple linear regression model
B)a multiple nonlinear regression model
C)an estimated multiple regression equation
D)a multiple regression equation
Is
A)a simple linear regression model
B)a multiple nonlinear regression model
C)an estimated multiple regression equation
D)a multiple regression equation
Unlock Deck
Unlock for access to all 106 flashcards in this deck.
Unlock Deck
k this deck
10
The mathematical equation that explains how the dependent variable y is related to several independent variables x1,x2,....,xp and the error term is
A)a simple nonlinear regression model
B)a multiple regression model
C)an estimated multiple regression equation
D)a multiple regression equation
A)a simple nonlinear regression model
B)a multiple regression model
C)an estimated multiple regression equation
D)a multiple regression equation
Unlock Deck
Unlock for access to all 106 flashcards in this deck.
Unlock Deck
k this deck
11
A regression model in which more than one independent variable is used to predict the dependent variable is called
A)a simple linear regression model
B)a multiple regression model
C)an independent model
D)None of these alternatives is correct.
A)a simple linear regression model
B)a multiple regression model
C)an independent model
D)None of these alternatives is correct.
Unlock Deck
Unlock for access to all 106 flashcards in this deck.
Unlock Deck
k this deck
12
The adjusted multiple coefficient of determination is adjusted for
A)the number of dependent variables
B)the number of independent variables
C)the number of equations
D)detrimental situations
A)the number of dependent variables
B)the number of independent variables
C)the number of equations
D)detrimental situations
Unlock Deck
Unlock for access to all 106 flashcards in this deck.
Unlock Deck
k this deck
13
A multiple regression model has
A)only one independent variable
B)more than one dependent variable
C)more than one independent variable
D)at least 2 dependent variables
A)only one independent variable
B)more than one dependent variable
C)more than one independent variable
D)at least 2 dependent variables
Unlock Deck
Unlock for access to all 106 flashcards in this deck.
Unlock Deck
k this deck
14
A variable that cannot be measured in terms of how much or how many but instead is assigned values to represent categories is called
A)an interaction
B)a constant variable
C)a category variable
D)a qualitative variable
A)an interaction
B)a constant variable
C)a category variable
D)a qualitative variable
Unlock Deck
Unlock for access to all 106 flashcards in this deck.
Unlock Deck
k this deck
15
In a multiple regression model,the error term is assumed to be a random variable with a mean of
A)zero
B)-1
C)1
D)any value
A)zero
B)-1
C)1
D)any value
Unlock Deck
Unlock for access to all 106 flashcards in this deck.
Unlock Deck
k this deck
16
In order to test for the significance of a regression model involving 3 independent variables and 47 observations,the numerator and denominator degrees of freedom (respectively)for the critical value of F are
A)47 and 3
B)3 and 47
C)2 and 43
D)3 and 43
A)47 and 3
B)3 and 47
C)2 and 43
D)3 and 43
Unlock Deck
Unlock for access to all 106 flashcards in this deck.
Unlock Deck
k this deck
17
A variable that takes on the values of 0 or 1 and is used to incorporate the effect of qualitative variables in a regression model is called
A)an interaction
B)a constant variable
C)a dummy variable
D)None of these alternatives is correct.
A)an interaction
B)a constant variable
C)a dummy variable
D)None of these alternatives is correct.
Unlock Deck
Unlock for access to all 106 flashcards in this deck.
Unlock Deck
k this deck
18
A measure of the effect of an unusual x value on the regression results is called
A)Cook's D
B)Leverage
C)odd ratio
D)unusual regression
A)Cook's D
B)Leverage
C)odd ratio
D)unusual regression
Unlock Deck
Unlock for access to all 106 flashcards in this deck.
Unlock Deck
k this deck
19
In a multiple regression model,the values of the error term , ,are assumed to be
A)zero
B)dependent on each other
C)independent of each other
D)always negative
A)zero
B)dependent on each other
C)independent of each other
D)always negative
Unlock Deck
Unlock for access to all 106 flashcards in this deck.
Unlock Deck
k this deck
20
In multiple regression analysis,the correlation among the independent variables is termed
A)homoscedasticity
B)linearity
C)multicollinearity
D)adjusted coefficient of determination
A)homoscedasticity
B)linearity
C)multicollinearity
D)adjusted coefficient of determination
Unlock Deck
Unlock for access to all 106 flashcards in this deck.
Unlock Deck
k this deck
21
A regression model involved 5 independent variables and 136 observations.The critical value of t for testing the significance of each of the independent variable's coefficients will have
A)121 degrees of freedom
B)135 degrees of freedom
C)130 degrees of freedom
D)4 degrees of freedom
A)121 degrees of freedom
B)135 degrees of freedom
C)130 degrees of freedom
D)4 degrees of freedom
Unlock Deck
Unlock for access to all 106 flashcards in this deck.
Unlock Deck
k this deck
22
In a multiple regression analysis involving 15 independent variables and 200 observations,SST = 800 and SSE = 240.The coefficient of determination is
A)0.300
B)0.192
C)0.500
D)0.700
A)0.300
B)0.192
C)0.500
D)0.700
Unlock Deck
Unlock for access to all 106 flashcards in this deck.
Unlock Deck
k this deck
23
The multiple coefficient of determination is
A)MSR/MST
B)MSR/MSE
C)SSR/SST
D)SSE/SSR
A)MSR/MST
B)MSR/MSE
C)SSR/SST
D)SSE/SSR
Unlock Deck
Unlock for access to all 106 flashcards in this deck.
Unlock Deck
k this deck
24
A regression analysis involved 8 independent variables and 99 observations.The critical value of t for testing the significance of each of the independent variable's coefficients will have
A)98 degrees of freedom
B)97 degrees of freedom
C)90 degrees of freedom
D)7 degrees of freedom
A)98 degrees of freedom
B)97 degrees of freedom
C)90 degrees of freedom
D)7 degrees of freedom
Unlock Deck
Unlock for access to all 106 flashcards in this deck.
Unlock Deck
k this deck
25
A term used to describe the case when the independent variables in a multiple regression model are correlated is
A)regression
B)correlation
C)multicollinearity
D)None of the above answers is correct.
A)regression
B)correlation
C)multicollinearity
D)None of the above answers is correct.
Unlock Deck
Unlock for access to all 106 flashcards in this deck.
Unlock Deck
k this deck
26
A multiple regression model has the form
As x1 increases by 1 unit (holding x2 constant),y is expected to
A)increase by 9 units
B)decrease by 9 units
C)increase by 2 units
D)decrease by 2 units
As x1 increases by 1 unit (holding x2 constant),y is expected to
A)increase by 9 units
B)decrease by 9 units
C)increase by 2 units
D)decrease by 2 units
Unlock Deck
Unlock for access to all 106 flashcards in this deck.
Unlock Deck
k this deck
27
The ratio of MSE/MSR yields
A)SST
B)the F statistic
C)SSR
D)None of these alternatives is correct.
A)SST
B)the F statistic
C)SSR
D)None of these alternatives is correct.
Unlock Deck
Unlock for access to all 106 flashcards in this deck.
Unlock Deck
k this deck
28
The correct relationship between SST,SSR,and SSE is given by
A)SSR = SST + SSE
B)SSR = SST - SSE
C)SSE = SSR - SST
D)None of these alternatives is correct.
A)SSR = SST + SSE
B)SSR = SST - SSE
C)SSE = SSR - SST
D)None of these alternatives is correct.
Unlock Deck
Unlock for access to all 106 flashcards in this deck.
Unlock Deck
k this deck
29
In logistic regression,
A)there can only be two independent variables
B)there are two dependent variables
C)the dependent variable only assumes two discrete values
D)the dependent variable only assumes two continuous values
A)there can only be two independent variables
B)there are two dependent variables
C)the dependent variable only assumes two discrete values
D)the dependent variable only assumes two continuous values
Unlock Deck
Unlock for access to all 106 flashcards in this deck.
Unlock Deck
k this deck
30
In a multiple regression analysis SSR = 1,000 and SSE = 200.The F statistic for this model is
A)5.0
B)1,200
C)800
D)Not enough information is provided to answer this question.
A)5.0
B)1,200
C)800
D)Not enough information is provided to answer this question.
Unlock Deck
Unlock for access to all 106 flashcards in this deck.
Unlock Deck
k this deck
31
In a situation where the dependent variable can assume only one of the two possible discrete values,
A)we must use multiple regression
B)there can only be two independent variables
C)logistic regression should be applied
D)all the independent variables must have values of either zero or one
A)we must use multiple regression
B)there can only be two independent variables
C)logistic regression should be applied
D)all the independent variables must have values of either zero or one
Unlock Deck
Unlock for access to all 106 flashcards in this deck.
Unlock Deck
k this deck
32
In a regression model involving more than one independent variable,which of the following tests must be used in order to determine if the relationship between the dependent variable and the set of independent variables is significant?
A)t test
B)F test
C)Either a t test or a chi-square test can be used.
D)chi-square test
A)t test
B)F test
C)Either a t test or a chi-square test can be used.
D)chi-square test
Unlock Deck
Unlock for access to all 106 flashcards in this deck.
Unlock Deck
k this deck
33
A regression model involved 18 independent variables and 200 observations.The critical value of t for testing the significance of each of the independent variable's coefficients will have
A)18 degrees of freedom
B)200 degrees of freedom
C)199 degrees of freedom
D)181 degrees of freedom
A)18 degrees of freedom
B)200 degrees of freedom
C)199 degrees of freedom
D)181 degrees of freedom
Unlock Deck
Unlock for access to all 106 flashcards in this deck.
Unlock Deck
k this deck
34
For a multiple regression model,SST = 200 and SSE = 50.The multiple coefficient of determination is
A)0.25
B)4.00
C)250
D)0.75
A)0.25
B)4.00
C)250
D)0.75
Unlock Deck
Unlock for access to all 106 flashcards in this deck.
Unlock Deck
k this deck
35
For a multiple regression model,SSR = 600 and SSE = 200.The multiple coefficient of determination is
A)0.333
B)0.275
C)0.300
D)0.75
A)0.333
B)0.275
C)0.300
D)0.75
Unlock Deck
Unlock for access to all 106 flashcards in this deck.
Unlock Deck
k this deck
36
In a multiple regression analysis involving 10 independent variables and 81 observations,SST = 120 and SSE = 42.The coefficient of determination is
A)0.81
B)0.11
C)0.35
D)0.65
A)0.81
B)0.11
C)0.35
D)0.65
Unlock Deck
Unlock for access to all 106 flashcards in this deck.
Unlock Deck
k this deck
37
In a multiple regression analysis involving 12 independent variables and 166 observations,SSR = 878 and SSE = 122.The coefficient of determination is
A)0.1389
B)0.1220
C)0.878
D)0.7317
A)0.1389
B)0.1220
C)0.878
D)0.7317
Unlock Deck
Unlock for access to all 106 flashcards in this deck.
Unlock Deck
k this deck
38
In order to test for the significance of a regression model involving 14 independent variables and 255 observations,the numerator and denominator degrees of freedom (respectively)for the critical value of F are
A)14 and 255
B)255 and 14
C)13 and 240
D)14 and 240
A)14 and 255
B)255 and 14
C)13 and 240
D)14 and 240
Unlock Deck
Unlock for access to all 106 flashcards in this deck.
Unlock Deck
k this deck
39
A variable that cannot be measured in numerical terms is called
A)a nonmeasurable random variable
B)a constant variable
C)a dependent variable
D)a qualitative variable
A)a nonmeasurable random variable
B)a constant variable
C)a dependent variable
D)a qualitative variable
Unlock Deck
Unlock for access to all 106 flashcards in this deck.
Unlock Deck
k this deck
40
A multiple regression model has the form
As X increases by 1 unit (holding W constant),Y is expected to
A)increase by 11 units
B)decrease by 11 units
C)increase by 6 units
D)decrease by 6 units
As X increases by 1 unit (holding W constant),Y is expected to
A)increase by 11 units
B)decrease by 11 units
C)increase by 6 units
D)decrease by 6 units
Unlock Deck
Unlock for access to all 106 flashcards in this deck.
Unlock Deck
k this deck
41
Exhibit 15-1
In a regression model involving 44 observations,the following estimated regression equation was obtained. For this model SSR = 600 and SSE = 400.
Refer to Exhibit 15-1.The coefficient of determination for the above model is
A)0.667
B)0.600
C)0.336
D)o.400
In a regression model involving 44 observations,the following estimated regression equation was obtained.
For this model SSR = 600 and SSE = 400.Refer to Exhibit 15-1.The coefficient of determination for the above model is
A)0.667
B)0.600
C)0.336
D)o.400
Unlock Deck
Unlock for access to all 106 flashcards in this deck.
Unlock Deck
k this deck
42
In order to test for the significance of a regression model involving 8 independent variables and 121 observations,the numerator and denominator degrees of freedom (respectively)for the critical value of F are
A)8 and 121
B)7 and 120
C)8 and 112
D)7 and 112
A)8 and 121
B)7 and 120
C)8 and 112
D)7 and 112
Unlock Deck
Unlock for access to all 106 flashcards in this deck.
Unlock Deck
k this deck
43
Exhibit 15-2
A regression model between sales (Y in $1,000),unit price (X1 in dollars)and television advertisement (X2 in dollars)resulted in the following function: For this model SSR = 3500,SSE = 1500,and the sample size is 18.
Refer to Exhibit 15-2.To test for the significance of the model,the test statistic F is
A)2.33
B)0.70
C)17.5
D)1.75
A regression model between sales (Y in $1,000),unit price (X1 in dollars)and television advertisement (X2 in dollars)resulted in the following function:
For this model SSR = 3500,SSE = 1500,and the sample size is 18.Refer to Exhibit 15-2.To test for the significance of the model,the test statistic F is
A)2.33
B)0.70
C)17.5
D)1.75
Unlock Deck
Unlock for access to all 106 flashcards in this deck.
Unlock Deck
k this deck
44
Exhibit 15-2
A regression model between sales (Y in $1,000),unit price (X1 in dollars)and television advertisement (X2 in dollars)resulted in the following function: For this model SSR = 3500,SSE = 1500,and the sample size is 18.
Refer to Exhibit 15-2.The coefficient of X2 indicates that if television advertising is increased by $1 (holding the unit price constant),sales are expected to
A)increase by $5
B)increase by $12,000
C)increase by $5,000
D)decrease by $2,000
A regression model between sales (Y in $1,000),unit price (X1 in dollars)and television advertisement (X2 in dollars)resulted in the following function:
For this model SSR = 3500,SSE = 1500,and the sample size is 18.Refer to Exhibit 15-2.The coefficient of X2 indicates that if television advertising is increased by $1 (holding the unit price constant),sales are expected to
A)increase by $5
B)increase by $12,000
C)increase by $5,000
D)decrease by $2,000
Unlock Deck
Unlock for access to all 106 flashcards in this deck.
Unlock Deck
k this deck
45
Exhibit 15-4
a. b. c. d.
Which equation describes the multiple regression model?
A)Equation A
B)Equation B
C)Equation C
D)Equation D
a.
b. c. d. Which equation describes the multiple regression model?
A)Equation A
B)Equation B
C)Equation C
D)Equation D
Unlock Deck
Unlock for access to all 106 flashcards in this deck.
Unlock Deck
k this deck
46
Exhibit 15-2
A regression model between sales (Y in $1,000),unit price (X1 in dollars)and television advertisement (X2 in dollars)resulted in the following function: For this model SSR = 3500,SSE = 1500,and the sample size is 18.
Refer to Exhibit 15-2.To test for the significance of the model,the p-value is
A)less than 0.01
B)between 0.01 and 0.025
C)between 0.025 and 0.05
D)between 0.05 and 0.10
A regression model between sales (Y in $1,000),unit price (X1 in dollars)and television advertisement (X2 in dollars)resulted in the following function:
For this model SSR = 3500,SSE = 1500,and the sample size is 18.Refer to Exhibit 15-2.To test for the significance of the model,the p-value is
A)less than 0.01
B)between 0.01 and 0.025
C)between 0.025 and 0.05
D)between 0.05 and 0.10
Unlock Deck
Unlock for access to all 106 flashcards in this deck.
Unlock Deck
k this deck
47
Exhibit 15-2
PTS: 1 TOP: Multiple Regression
NARRBEGIN: Exhibit 15-3
Exhibit 15-3
In a regression model involving 30 observations,the following estimated regression equation was obtained: For this model SSR = 700 and SSE = 100.
Refer to Exhibit 15-3.The computed F statistic for testing the significance of the above model is
A)43.75
B)0.875
C)50.19
D)7.00
PTS: 1 TOP: Multiple Regression
NARRBEGIN: Exhibit 15-3
Exhibit 15-3
In a regression model involving 30 observations,the following estimated regression equation was obtained:
For this model SSR = 700 and SSE = 100.Refer to Exhibit 15-3.The computed F statistic for testing the significance of the above model is
A)43.75
B)0.875
C)50.19
D)7.00
Unlock Deck
Unlock for access to all 106 flashcards in this deck.
Unlock Deck
k this deck
48
In order to test for the significance of a regression model involving 4 independent variables and 36 observations,the numerator and denominator degrees of freedom (respectively)for the critical value of F are
A)4 and 36
B)3 and 35
C)4 and 31
D)4 and 32
A)4 and 36
B)3 and 35
C)4 and 31
D)4 and 32
Unlock Deck
Unlock for access to all 106 flashcards in this deck.
Unlock Deck
k this deck
49
In a multiple regression analysis involving 5 independent variables and 30 observations,SSR = 360 and SSE = 40.The coefficient of determination is
A)0.80
B)0.90
C)0.25
D)0.15
A)0.80
B)0.90
C)0.25
D)0.15
Unlock Deck
Unlock for access to all 106 flashcards in this deck.
Unlock Deck
k this deck
50
Exhibit 15-2
PTS: 1 TOP: Multiple Regression
NARRBEGIN: Exhibit 15-3
Exhibit 15-3
In a regression model involving 30 observations,the following estimated regression equation was obtained: For this model SSR = 700 and SSE = 100.
Refer to Exhibit 15-3.The critical F value at 95% confidence is
A)2.53
B)2.69
C)2.76
D)2.99
PTS: 1 TOP: Multiple Regression
NARRBEGIN: Exhibit 15-3
Exhibit 15-3
In a regression model involving 30 observations,the following estimated regression equation was obtained:
For this model SSR = 700 and SSE = 100.Refer to Exhibit 15-3.The critical F value at 95% confidence is
A)2.53
B)2.69
C)2.76
D)2.99
Unlock Deck
Unlock for access to all 106 flashcards in this deck.
Unlock Deck
k this deck
51
Exhibit 15-1
In a regression model involving 44 observations,the following estimated regression equation was obtained. For this model SSR = 600 and SSE = 400.
Refer to Exhibit 15-1.MSR for this model is
A)200
B)10
C)1,000
D)43
In a regression model involving 44 observations,the following estimated regression equation was obtained.
For this model SSR = 600 and SSE = 400.Refer to Exhibit 15-1.MSR for this model is
A)200
B)10
C)1,000
D)43
Unlock Deck
Unlock for access to all 106 flashcards in this deck.
Unlock Deck
k this deck
52
Exhibit 15-2
PTS: 1 TOP: Multiple Regression
NARRBEGIN: Exhibit 15-3
Exhibit 15-3
In a regression model involving 30 observations,the following estimated regression equation was obtained: For this model SSR = 700 and SSE = 100.
Refer to Exhibit 15-3.The coefficient of determination for the above model is approximately
A)-0.875
B)0.875
C)0.125
D)0.144
PTS: 1 TOP: Multiple Regression
NARRBEGIN: Exhibit 15-3
Exhibit 15-3
In a regression model involving 30 observations,the following estimated regression equation was obtained:
For this model SSR = 700 and SSE = 100.Refer to Exhibit 15-3.The coefficient of determination for the above model is approximately
A)-0.875
B)0.875
C)0.125
D)0.144
Unlock Deck
Unlock for access to all 106 flashcards in this deck.
Unlock Deck
k this deck
53
Exhibit 15-2
PTS: 1 TOP: Multiple Regression
NARRBEGIN: Exhibit 15-3
Exhibit 15-3
In a regression model involving 30 observations,the following estimated regression equation was obtained: For this model SSR = 700 and SSE = 100.
Refer to Exhibit 15-3.The conclusion is that the
A)model is not significant
B)model is significant
C)slope of X1 is significant
D)slope of X2 is significant
PTS: 1 TOP: Multiple Regression
NARRBEGIN: Exhibit 15-3
Exhibit 15-3
In a regression model involving 30 observations,the following estimated regression equation was obtained:
For this model SSR = 700 and SSE = 100.Refer to Exhibit 15-3.The conclusion is that the
A)model is not significant
B)model is significant
C)slope of X1 is significant
D)slope of X2 is significant
Unlock Deck
Unlock for access to all 106 flashcards in this deck.
Unlock Deck
k this deck
54
Exhibit 15-1
In a regression model involving 44 observations,the following estimated regression equation was obtained. For this model SSR = 600 and SSE = 400.
Refer to Exhibit 15-1.The computed F statistics for testing the significance of the above model is
A)1.500
B)20.00
C)0.600
D)0.6667
In a regression model involving 44 observations,the following estimated regression equation was obtained.
For this model SSR = 600 and SSE = 400.Refer to Exhibit 15-1.The computed F statistics for testing the significance of the above model is
A)1.500
B)20.00
C)0.600
D)0.6667
Unlock Deck
Unlock for access to all 106 flashcards in this deck.
Unlock Deck
k this deck
55
Exhibit 15-5
Below you are given a partial Minitab output based on a sample of 25 observations.
Refer to Exhibit 15-5.The interpretation of the coefficient on X1 is that
A)a one unit change in X1 will lead to a 25.625 unit change in Y
B)a one unit change in X1 will lead to a 25.625 unit increase in Y when all other variables are held constant
C)a one unit change in X1 will lead to a 25.625 unit increase in X2 when all other variables are held constant
D)It is impossible to interpret the coefficient.
Unlock Deck
Unlock for access to all 106 flashcards in this deck.
Unlock Deck
k this deck
56
Exhibit 15-2
A regression model between sales (Y in $1,000),unit price (X1 in dollars)and television advertisement (X2 in dollars)resulted in the following function: For this model SSR = 3500,SSE = 1500,and the sample size is 18.
Refer to Exhibit 15-2.The coefficient of the unit price indicates that if the unit price is
A)increased by $1 (holding advertising constant),sales are expected to increase by $3
B)decreased by $1 (holding advertising constant),sales are expected to decrease by $3
C)increased by $1 (holding advertising constant),sales are expected to increase by $4,000
D)increased by $1 (holding advertising constant),sales are expected to decrease by $3,000
A regression model between sales (Y in $1,000),unit price (X1 in dollars)and television advertisement (X2 in dollars)resulted in the following function:
For this model SSR = 3500,SSE = 1500,and the sample size is 18.Refer to Exhibit 15-2.The coefficient of the unit price indicates that if the unit price is
A)increased by $1 (holding advertising constant),sales are expected to increase by $3
B)decreased by $1 (holding advertising constant),sales are expected to decrease by $3
C)increased by $1 (holding advertising constant),sales are expected to increase by $4,000
D)increased by $1 (holding advertising constant),sales are expected to decrease by $3,000
Unlock Deck
Unlock for access to all 106 flashcards in this deck.
Unlock Deck
k this deck
57
Exhibit 15-2
A regression model between sales (Y in $1,000),unit price (X1 in dollars)and television advertisement (X2 in dollars)resulted in the following function: For this model SSR = 3500,SSE = 1500,and the sample size is 18.
Refer to Exhibit 15-2.The multiple coefficient of correlation for this problem is
A)0.70
B)0.8367
C)0.49
D)0.2289
A regression model between sales (Y in $1,000),unit price (X1 in dollars)and television advertisement (X2 in dollars)resulted in the following function:
For this model SSR = 3500,SSE = 1500,and the sample size is 18.Refer to Exhibit 15-2.The multiple coefficient of correlation for this problem is
A)0.70
B)0.8367
C)0.49
D)0.2289
Unlock Deck
Unlock for access to all 106 flashcards in this deck.
Unlock Deck
k this deck
58
A regression analysis involved 6 independent variables and 27 observations.The critical value of t for testing the significance of each of the independent variable's coefficients will have
A)27 degrees of freedom
B)26 degrees of freedom
C)21 degrees of freedom
D)20 degrees of freedom
A)27 degrees of freedom
B)26 degrees of freedom
C)21 degrees of freedom
D)20 degrees of freedom
Unlock Deck
Unlock for access to all 106 flashcards in this deck.
Unlock Deck
k this deck
59
Exhibit 15-4
a. b. c. d.
Which equation gives the estimated regression line?
A)Equation A
B)Equation B
C)Equation C
D)Equation D
a.
b. c. d. Which equation gives the estimated regression line?
A)Equation A
B)Equation B
C)Equation C
D)Equation D
Unlock Deck
Unlock for access to all 106 flashcards in this deck.
Unlock Deck
k this deck
60
Exhibit 15-4
a. b. c. d.
Which equation describes the multiple regression equation?
A)Equation A
B)Equation B
C)Equation C
D)Equation D
a.
b. c. d. Which equation describes the multiple regression equation?
A)Equation A
B)Equation B
C)Equation C
D)Equation D
Unlock Deck
Unlock for access to all 106 flashcards in this deck.
Unlock Deck
k this deck
61
Exhibit 15-6
Below you are given a partial computer output based on a sample of 16 observations.
Refer to Exhibit 15-6.The t value obtained from the table which is used to test an individual parameter at the 1% level is
A)2.65
B)2.921
C)2.977
D)3.012
Below you are given a partial computer output based on a sample of 16 observations.
Refer to Exhibit 15-6.The t value obtained from the table which is used to test an individual parameter at the 1% level is
A)2.65
B)2.921
C)2.977
D)3.012
Unlock Deck
Unlock for access to all 106 flashcards in this deck.
Unlock Deck
k this deck
62
Exhibit 15-6
Below you are given a partial computer output based on a sample of 16 observations.
-Refer to Exhibit 15-6.We want to test whether the parameter 1 is significant.The test statistic equals
A)-1.4
B)1.4
C)3.6
D)5
Below you are given a partial computer output based on a sample of 16 observations.
-Refer to Exhibit 15-6.We want to test whether the parameter 1 is significant.The test statistic equals
A)-1.4
B)1.4
C)3.6
D)5
Unlock Deck
Unlock for access to all 106 flashcards in this deck.
Unlock Deck
k this deck
63
Exhibit 15-8
The following estimated regression model was developed relating yearly income (Y in $1,000s)of 30 individuals with their age (X1)and their gender (X2)(0 if male and 1 if female). Also provided are SST = 1,200 and SSE = 384.
Refer to Exhibit 15-8.The yearly income of a 24-year-old male individual is
A)$13.80
B)$13,800
C)$46,800
D)$49,800
The following estimated regression model was developed relating yearly income (Y in $1,000s)of 30 individuals with their age (X1)and their gender (X2)(0 if male and 1 if female).
Also provided are SST = 1,200 and SSE = 384.Refer to Exhibit 15-8.The yearly income of a 24-year-old male individual is
A)$13.80
B)$13,800
C)$46,800
D)$49,800
Unlock Deck
Unlock for access to all 106 flashcards in this deck.
Unlock Deck
k this deck
64
Exhibit 15-6
Below you are given a partial computer output based on a sample of 16 observations.
Refer to Exhibit 15-6.The test statistic used to determine if there is a relationship among the variables equals
A)-1.4
B)0.2
C)0.77
D)5
Below you are given a partial computer output based on a sample of 16 observations.
Refer to Exhibit 15-6.The test statistic used to determine if there is a relationship among the variables equals
A)-1.4
B)0.2
C)0.77
D)5
Unlock Deck
Unlock for access to all 106 flashcards in this deck.
Unlock Deck
k this deck
65
Exhibit 15-8
The following estimated regression model was developed relating yearly income (Y in $1,000s)of 30 individuals with their age (X1)and their gender (X2)(0 if male and 1 if female). Also provided are SST = 1,200 and SSE = 384.
Refer to Exhibit 15-8.The multiple coefficient of determination is
A)0.32
B)0.42
C)0.68
D)0.50
The following estimated regression model was developed relating yearly income (Y in $1,000s)of 30 individuals with their age (X1)and their gender (X2)(0 if male and 1 if female).
Also provided are SST = 1,200 and SSE = 384.Refer to Exhibit 15-8.The multiple coefficient of determination is
A)0.32
B)0.42
C)0.68
D)0.50
Unlock Deck
Unlock for access to all 106 flashcards in this deck.
Unlock Deck
k this deck
66
Exhibit 15-8
The following estimated regression model was developed relating yearly income (Y in $1,000s)of 30 individuals with their age (X1)and their gender (X2)(0 if male and 1 if female). Also provided are SST = 1,200 and SSE = 384.
Refer to Exhibit 15-8.From the above function,it can be said that the expected yearly income of
A)males is $3 more than females
B)females is $3 more than males
C)males is $3,000 more than females
D)females is $3,000 more than males
The following estimated regression model was developed relating yearly income (Y in $1,000s)of 30 individuals with their age (X1)and their gender (X2)(0 if male and 1 if female).
Also provided are SST = 1,200 and SSE = 384.Refer to Exhibit 15-8.From the above function,it can be said that the expected yearly income of
A)males is $3 more than females
B)females is $3 more than males
C)males is $3,000 more than females
D)females is $3,000 more than males
Unlock Deck
Unlock for access to all 106 flashcards in this deck.
Unlock Deck
k this deck
67
Exhibit 15-7
A regression model involving 4 independent variables and a sample of 15 periods resulted in the following sum of squares.
Refer to Exhibit 15-7.The test statistic from the information provided is
A)2.110
B)3.480
C)4.710
D)6.875
A regression model involving 4 independent variables and a sample of 15 periods resulted in the following sum of squares.
Refer to Exhibit 15-7.The test statistic from the information provided is
A)2.110
B)3.480
C)4.710
D)6.875
Unlock Deck
Unlock for access to all 106 flashcards in this deck.
Unlock Deck
k this deck
68
Exhibit 15-6
Below you are given a partial computer output based on a sample of 16 observations.
Refer to Exhibit 15-6.Carry out the test to determine if there is a relationship among the variables at the 5% level.The null hypothesis should
A)be rejected
B)not be rejected
C)revised
D)None of these alternatives is correct.
Unlock Deck
Unlock for access to all 106 flashcards in this deck.
Unlock Deck
k this deck
69
Exhibit 15-5
Below you are given a partial Minitab output based on a sample of 25 observations.
-Refer to Exhibit 15-5.We want to test whether the parameter 1 is significant.The test statistic equals
A)0.357
B)2.8
C)14
D)1.96
Below you are given a partial Minitab output based on a sample of 25 observations.
-Refer to Exhibit 15-5.We want to test whether the parameter 1 is significant.The test statistic equals
A)0.357
B)2.8
C)14
D)1.96
Unlock Deck
Unlock for access to all 106 flashcards in this deck.
Unlock Deck
k this deck
70
Exhibit 15-5
Below you are given a partial Minitab output based on a sample of 25 observations.
Refer to Exhibit 15-5.The t value obtained from the table to test an individual parameter at the 5% level is
A)2.06
B)2.069
C)2.074
D)2.080
Below you are given a partial Minitab output based on a sample of 25 observations.
Refer to Exhibit 15-5.The t value obtained from the table to test an individual parameter at the 5% level is
A)2.06
B)2.069
C)2.074
D)2.080
Unlock Deck
Unlock for access to all 106 flashcards in this deck.
Unlock Deck
k this deck
71
Exhibit 15-6
Below you are given a partial computer output based on a sample of 16 observations.
Refer to Exhibit 15-6.The interpretation of the coefficient of X1 is that
A)a one unit change in X1 will lead to a 3.682 unit decrease in Y
B)a one unit increase in X1 will lead to a 3.682 unit decrease in Y when all other variables are held constant
C)a one unit increase in X1 will lead to a 3.682 unit decrease in X2 when all other variables are held constant
D)It is impossible to interpret the coefficient.
Unlock Deck
Unlock for access to all 106 flashcards in this deck.
Unlock Deck
k this deck
72
Exhibit 15-5
Below you are given a partial Minitab output based on a sample of 25 observations.
-Refer to Exhibit 15-5.Carry out the test of significance for the parameter 1at the 5% level.The null hypothesis should be
A)rejected
B)not rejected
C)revised
D)None of these alternatives is correct.
Below you are given a partial Minitab output based on a sample of 25 observations.
-Refer to Exhibit 15-5.Carry out the test of significance for the parameter 1at the 5% level.The null hypothesis should be
A)rejected
B)not rejected
C)revised
D)None of these alternatives is correct.
Unlock Deck
Unlock for access to all 106 flashcards in this deck.
Unlock Deck
k this deck
73
Exhibit 15-7
A regression model involving 4 independent variables and a sample of 15 periods resulted in the following sum of squares.
Refer to Exhibit 15-7.If we want to test for the significance of the model at 95% confidence,the critical F value (from the table)is
A)3.06
B)3.48
C)3.34
D)3.11
A regression model involving 4 independent variables and a sample of 15 periods resulted in the following sum of squares.
Refer to Exhibit 15-7.If we want to test for the significance of the model at 95% confidence,the critical F value (from the table)is
A)3.06
B)3.48
C)3.34
D)3.11
Unlock Deck
Unlock for access to all 106 flashcards in this deck.
Unlock Deck
k this deck
74
Exhibit 15-6
Below you are given a partial computer output based on a sample of 16 observations.
-Refer to Exhibit 15-6.Carry out the test of significance for the parameter 1 at the 1% level.The null hypothesis should be
A)rejected
B)not rejected
C)revised
D)None of these alternatives is correct.
Below you are given a partial computer output based on a sample of 16 observations.
-Refer to Exhibit 15-6.Carry out the test of significance for the parameter 1 at the 1% level.The null hypothesis should be
A)rejected
B)not rejected
C)revised
D)None of these alternatives is correct.
Unlock Deck
Unlock for access to all 106 flashcards in this deck.
Unlock Deck
k this deck
75
Exhibit 15-6
Below you are given a partial computer output based on a sample of 16 observations.
Refer to Exhibit 15-6.The estimated regression equation is
A)
B)
C)
D)
Below you are given a partial computer output based on a sample of 16 observations.
Refer to Exhibit 15-6.The estimated regression equation is
A)
B)
C)
D)
Unlock Deck
Unlock for access to all 106 flashcards in this deck.
Unlock Deck
k this deck
76
Exhibit 15-6
Below you are given a partial computer output based on a sample of 16 observations.
Refer to Exhibit 15-6.The degrees of freedom for the sum of squares explained by the regression (SSR)are
A)2
B)3
C)13
D)15
Below you are given a partial computer output based on a sample of 16 observations.
Refer to Exhibit 15-6.The degrees of freedom for the sum of squares explained by the regression (SSR)are
A)2
B)3
C)13
D)15
Unlock Deck
Unlock for access to all 106 flashcards in this deck.
Unlock Deck
k this deck
77
Exhibit 15-7
A regression model involving 4 independent variables and a sample of 15 periods resulted in the following sum of squares.
Refer to Exhibit 15-7.The coefficient of determination is
A)0.3636
B)0.7333
C)0.275
D)0.5
A regression model involving 4 independent variables and a sample of 15 periods resulted in the following sum of squares.
Refer to Exhibit 15-7.The coefficient of determination is
A)0.3636
B)0.7333
C)0.275
D)0.5
Unlock Deck
Unlock for access to all 106 flashcards in this deck.
Unlock Deck
k this deck
78
Exhibit 15-6
Below you are given a partial computer output based on a sample of 16 observations.
Refer to Exhibit 15-6.The F value obtained from the table used to test if there is a relationship among the variables at the 5% level equals
A)3.41
B)3.63
C)3.81
D)19.41
Below you are given a partial computer output based on a sample of 16 observations.
Refer to Exhibit 15-6.The F value obtained from the table used to test if there is a relationship among the variables at the 5% level equals
A)3.41
B)3.63
C)3.81
D)19.41
Unlock Deck
Unlock for access to all 106 flashcards in this deck.
Unlock Deck
k this deck
79
Exhibit 15-8
The following estimated regression model was developed relating yearly income (Y in $1,000s)of 30 individuals with their age (X1)and their gender (X2)(0 if male and 1 if female). Also provided are SST = 1,200 and SSE = 384.
Refer to Exhibit 15-8.The yearly income of a 24-year-old female individual is
A)$19.80
B)$19,800
C)$49.80
D)$49,800
The following estimated regression model was developed relating yearly income (Y in $1,000s)of 30 individuals with their age (X1)and their gender (X2)(0 if male and 1 if female).
Also provided are SST = 1,200 and SSE = 384.Refer to Exhibit 15-8.The yearly income of a 24-year-old female individual is
A)$19.80
B)$19,800
C)$49.80
D)$49,800
Unlock Deck
Unlock for access to all 106 flashcards in this deck.
Unlock Deck
k this deck
80
Exhibit 15-6
Below you are given a partial computer output based on a sample of 16 observations.
Refer to Exhibit 15-6.The sum of squares due to error (SSE)equals
A)37.33
B)485.3
C)4,853
D)6,308.9
Below you are given a partial computer output based on a sample of 16 observations.
Refer to Exhibit 15-6.The sum of squares due to error (SSE)equals
A)37.33
B)485.3
C)4,853
D)6,308.9
Unlock Deck
Unlock for access to all 106 flashcards in this deck.
Unlock Deck
k this deck
Unlock Deck
Unlock for access to all 106 flashcards in this deck.


