Exam 15: Multiple Regression
Exam 1: Data and Statistics98 Questions
Exam 2: Descriptive Statistics: Tabular and Graphical Presentations64 Questions
Exam 3: Descriptive Statistics: Numerical Measures156 Questions
Exam 4: Introduction to Probability138 Questions
Exam 5: Discrete Probability Distributions122 Questions
Exam 6: Continuous Probability Distributions165 Questions
Exam 7: Sampling and Sampling Distributions131 Questions
Exam 8: Interval Estimation131 Questions
Exam 9: Hypothesis Tests133 Questions
Exam 10: Statistical Inference About Means and Proportions With Two Populations121 Questions
Exam 11: Inferences About Population Variances91 Questions
Exam 12: Tests of Goodness of Fit and Independence80 Questions
Exam 13: Analysis of Variance and Experimental Design113 Questions
Exam 14: Simple Linear Regression140 Questions
Exam 15: Multiple Regression106 Questions
Exam 16: Regression Analysis: Model Building75 Questions
Exam 17: Index Numbers52 Questions
Exam 18: Forecasting67 Questions
Exam 19: Nonparametric Methods81 Questions
Exam 20: Statistical Methods for Quality Control30 Questions
Exam 21: Decision Analysis65 Questions
Exam 22: Sample Survey63 Questions
Select questions type
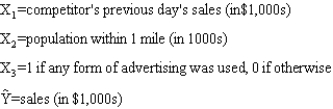
The following regression model has been proposed to predict sales at a fast food outlet. 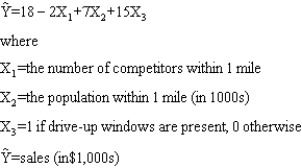 a.What is the interpretation of 15 (the coefficient of X3)in the regression equation?
b.Predict sales for a store with 2 competitors,a population of 10,000 within one mile,and one drive-up window (give the answer in dollars).
c.Predict sales for the store with 2 competitors,a population of 10,000 within one mile,and no drive-up window (give the answer in dollars).
a.What is the interpretation of 15 (the coefficient of X3)in the regression equation?
b.Predict sales for a store with 2 competitors,a population of 10,000 within one mile,and one drive-up window (give the answer in dollars).
c.Predict sales for the store with 2 competitors,a population of 10,000 within one mile,and no drive-up window (give the answer in dollars).
Free
(Essay)
4.7/5  (36)
(36)
Correct Answer: Verified
a.Sales of stores with drive-up windows are $15,000 higher than those without drive-up windows.b.$99,000
c.$84,000
The following is part of the results of a regression analysis involving sales (Y in millions of dollars),advertising expenditures (X1 in thousands of dollars),and number of sales people (X2)for a corporation:
 a.At = 0.05 level of significance,test to determine if the model is significant.That is,determine if there exists a significant relationship between the independent variables and the dependent variable.
b.Determine the multiple coefficient of determination.
c.Determine the adjusted multiple coefficient of determination.
d.What has been the sample size for this regression analysis?
a.At = 0.05 level of significance,test to determine if the model is significant.That is,determine if there exists a significant relationship between the independent variables and the dependent variable.
b.Determine the multiple coefficient of determination.
c.Determine the adjusted multiple coefficient of determination.
d.What has been the sample size for this regression analysis?
Free
(Essay)
4.8/5 (32)
Correct Answer:Verified
a.F = 3.91;p-value is between .05 and 0.1;do not reject H0;not significant (critical F = 4.74)
b.0.528
c.0.393
d.10
Exhibit 15-8
The following estimated regression model was developed relating yearly income (Y in $1,000s)of 30 individuals with their age (X1)and their gender (X2)(0 if male and 1 if female). 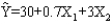 Also provided are SST = 1,200 and SSE = 384.
-Refer to Exhibit 15-8.From the above function,it can be said that the expected yearly income of
Also provided are SST = 1,200 and SSE = 384.
-Refer to Exhibit 15-8.From the above function,it can be said that the expected yearly income of
(Multiple Choice)
4.9/5 (33)
A variable that cannot be measured in numerical terms is called
(Multiple Choice)
4.8/5 (30)
The mathematical equation relating the expected value of the dependent variable to the value of the independent variables,which has the form of E(y)= 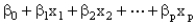 Is
Is
(Multiple Choice)
4.9/5 (26)
Exhibit 15-8
The following estimated regression model was developed relating yearly income (Y in $1,000s)of 30 individuals with their age (X1)and their gender (X2)(0 if male and 1 if female). Also provided are SST = 1,200 and SSE = 384.
-Refer to Exhibit 15-8.The estimated income of a 30-year-old male is
(Multiple Choice)
4.8/5 (40)
The following is part of the results of a regression analysis involving sales (Y in millions of dollars),advertising expenditures (X1 in thousands of dollars),and number of salespeople (X2)for a corporation.The regression was performed on a sample of 10 observations.
 a.Write the regression equation.
b.Interpret the coefficients of the estimated regression equation found in Part (a).
c.At =0.05,test for the significance of the coefficient of advertising.
d.At =0.05,test for the significance of the coefficient of number of salespeople.
e.If the company uses $50,000 in advertisement and has 800 salespersons,what are the expected sales? Give your answer in dollars.
a.Write the regression equation.
b.Interpret the coefficients of the estimated regression equation found in Part (a).
c.At =0.05,test for the significance of the coefficient of advertising.
d.At =0.05,test for the significance of the coefficient of number of salespeople.
e.If the company uses $50,000 in advertisement and has 800 salespersons,what are the expected sales? Give your answer in dollars.
(Essay)
4.8/5 (43)
The following regression model has been proposed to predict sales at a furniture store. 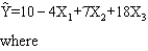
 a.Fully interpret the meaning of the coefficient of X3.
b.Predict sales (in dollars)for a store with competitor's previous day's sale of $3,000,a population of 10,000 within 1 mile,and six radio advertisements.
a.Fully interpret the meaning of the coefficient of X3.
b.Predict sales (in dollars)for a store with competitor's previous day's sale of $3,000,a population of 10,000 within 1 mile,and six radio advertisements.
(Essay)
4.8/5 (33)
Exhibit 15-6
Below you are given a partial computer output based on a sample of 16 observations.
 -Refer to Exhibit 15-6.The estimated regression equation is
(Multiple Choice)
4.7/5 (44)
Exhibit 15-2
PTS: 1 TOP: Multiple Regression
NARRBEGIN: Exhibit 15-3
Exhibit 15-3
In a regression model involving 30 observations,the following estimated regression equation was obtained: 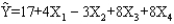 For this model SSR = 700 and SSE = 100.
-Refer to Exhibit 15-3.The conclusion is that the
For this model SSR = 700 and SSE = 100.
-Refer to Exhibit 15-3.The conclusion is that the
(Multiple Choice)
4.7/5 (44)
Exhibit 15-2
A regression model between sales (Y in $1,000),unit price (X1 in dollars)and television advertisement (X2 in dollars)resulted in the following function: 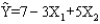 For this model SSR = 3500,SSE = 1500,and the sample size is 18.
-Refer to Exhibit 15-2.To test for the significance of the model,the test statistic F is
For this model SSR = 3500,SSE = 1500,and the sample size is 18.
-Refer to Exhibit 15-2.To test for the significance of the model,the test statistic F is
(Multiple Choice)
4.7/5 (36)
Exhibit 15-2
PTS: 1 TOP: Multiple Regression
NARRBEGIN: Exhibit 15-3
Exhibit 15-3
In a regression model involving 30 observations,the following estimated regression equation was obtained: For this model SSR = 700 and SSE = 100.
-Refer to Exhibit 15-3.The coefficient of determination for the above model is approximately
(Multiple Choice)
4.8/5 (27)
Exhibit 15-7
A regression model involving 4 independent variables and a sample of 15 periods resulted in the following sum of squares.
 -Refer to Exhibit 15-7.If we want to test for the significance of the model at 95% confidence,the critical F value (from the table)is
(Multiple Choice)
4.8/5 (27)
In a multiple regression model,the values of the error term , ,are assumed to be
(Multiple Choice)
4.7/5 (36)
In a multiple regression analysis SSR = 1,000 and SSE = 200.The F statistic for this model is
(Multiple Choice)
4.9/5 (31)
Shown below is a partial computer output from a regression analysis.
 a.Use the above results and write the regression equation.
b.Compute the coefficient of determination and fully interpret its meaning.
c.At = 0.05,test to see if there is a relation between X1 and Y.
d.At = 0.05,test to see if there is a relation between X3 and Y.
e.Is the regression model significant? Perform an F test and let = 0.05.
a.Use the above results and write the regression equation.
b.Compute the coefficient of determination and fully interpret its meaning.
c.At = 0.05,test to see if there is a relation between X1 and Y.
d.At = 0.05,test to see if there is a relation between X3 and Y.
e.Is the regression model significant? Perform an F test and let = 0.05.
(Essay)
4.9/5 (38)
Filters
- Essay(0)
- Multiple Choice(0)
- Short Answer(0)
- True False(0)
- Matching(0)