Deck 15: Simple Linear Regression and Correlation
Full screen (f)
Question
Question
Question
Question
Question
Question
Question
Question
Question
Question
Question
Question
Question
Question
Question
Question
Question
Question
Question
Question
Question
Question
Question
Question
Question
Question
Question
Question
Question
Question
Question
Question
Question
Question
Question
Question
Question
Question
Question
Question
Question
Question
Question
Question
Question
Question
Question
Question
Question
Question
Question
Question
Question
A simple linear regression problem produced the following sum of squares:  = 240,
  = 60,
= 60,  = 180
= 180
What percentage of the variation in y is explained by the regression line?
= 240, = 60, = 180What percentage of the variation in y is explained by the regression line?
Question
Question
Consider the following data values of variables x and y
 Use Excel or Minitab to construct a scatter diagram of the data points
Use Excel or Minitab to construct a scatter diagram of the data points Question
Question
Question
Question
Question
Question
NARRBEGIN: Used cars
The following table shows the selling prices and mileages for 7 used cars of a certain model.

Using the least-squares regression line,predict the selling price of a car with 55,000 miles.
The following table shows the selling prices and mileages for 7 used cars of a certain model.
Using the least-squares regression line,predict the selling price of a car with 55,000 miles.
Question
NARRBEGIN: Used cars
The following table shows the selling prices and mileages for 7 used cars of a certain model.
Identify the dependent and independent variable.
The following table shows the selling prices and mileages for 7 used cars of a certain model.
Identify the dependent and independent variable.
Question
NARRBEGIN: Used cars
The following table shows the selling prices and mileages for 7 used cars of a certain model.
Find the least-squares regression line.
The following table shows the selling prices and mileages for 7 used cars of a certain model.
Find the least-squares regression line.
Question
NARRBEGIN: Teacher
A statistics teacher collected the following data to determine if the number of hours a student studied during the semester could be used to predict the final grade for the course.

In testing the hypotheses vs.
vs.  ,what is the value of the test statistic?
A statistics teacher collected the following data to determine if the number of hours a student studied during the semester could be used to predict the final grade for the course.
In testing the hypotheses
vs. ,what is the value of the test statistic? Question
NARRBEGIN: Teacher
A statistics teacher collected the following data to determine if the number of hours a student studied during the semester could be used to predict the final grade for the course.
In testing the hypotheses vs.
vs.  ,what is the conclusion at the 0.05 significance level?
A statistics teacher collected the following data to determine if the number of hours a student studied during the semester could be used to predict the final grade for the course.
In testing the hypotheses
vs. ,what is the conclusion at the 0.05 significance level? Question
NARRBEGIN: GPA
The following table shows the grade point average (GPA)for 5 students along with their entrance exam scores for MBA programs (GMAT).Develop a model that would predict the GPA of a student based on their GMAT score.

Determine the standard error of estimate.
The following table shows the grade point average (GPA)for 5 students along with their entrance exam scores for MBA programs (GMAT).Develop a model that would predict the GPA of a student based on their GMAT score.
Determine the standard error of estimate.
Question
NARRBEGIN: Number of years
Data was collected to describe the relationship between salary and number of years of working experience at a particular organization and is shown below in the following table.

Identify the dependent and independent variables.
Data was collected to describe the relationship between salary and number of years of working experience at a particular organization and is shown below in the following table.
Identify the dependent and independent variables.
Question
NARRBEGIN: GPA
The following table shows the grade point average (GPA)for 5 students along with their entrance exam scores for MBA programs (GMAT).Develop a model that would predict the GPA of a student based on their GMAT score.
Determine the least-squares regression line.
The following table shows the grade point average (GPA)for 5 students along with their entrance exam scores for MBA programs (GMAT).Develop a model that would predict the GPA of a student based on their GMAT score.
Determine the least-squares regression line.
Question
NARRBEGIN: Teacher
A statistics teacher collected the following data to determine if the number of hours a student studied during the semester could be used to predict the final grade for the course.
In testing the hypotheses vs.
vs.  ,what is the rejection region at the 0.05 significance level?
A statistics teacher collected the following data to determine if the number of hours a student studied during the semester could be used to predict the final grade for the course.
In testing the hypotheses
vs. ,what is the rejection region at the 0.05 significance level? Question
NARRBEGIN: X and Y
Consider the following data values of variables x and y

Given that when a simple linear regression model applied to the data,it produced the following residuals:
0.062,-0.195,0.548,-0.682,0.089,-0.168,and 0.346.
Apply the Lilliefors test to the residuals at = 0.05.What is your conclusion?
Consider the following data values of variables x and y
Given that when a simple linear regression model applied to the data,it produced the following residuals:
0.062,-0.195,0.548,-0.682,0.089,-0.168,and 0.346.
Apply the Lilliefors test to the residuals at
= 0.05.What is your conclusion? Question
NARRBEGIN: X and Y
Consider the following data values of variables x and y
Given that the simple linear regression equation is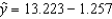 ,use Minitab to create a normal probability plot of the residuals.
Consider the following data values of variables x and y
Given that the simple linear regression equation is
,use Minitab to create a normal probability plot of the residuals. Question
NARRBEGIN: Used cars
The following table shows the selling prices and mileages for 7 used cars of a certain model.
Consider the following data values of variables x and y

 What does the scatter diagram tell you about the relationship between x and y?
The following table shows the selling prices and mileages for 7 used cars of a certain model.
Consider the following data values of variables x and y
What does the scatter diagram tell you about the relationship between x and y? Question
What does the following scatter diagram tell you about the relationship between x and y? 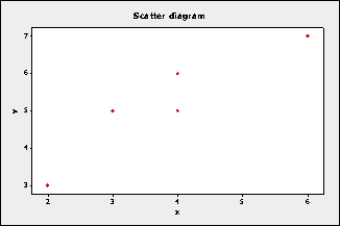
Question
Question
NARRBEGIN: Number of years
Data was collected to describe the relationship between salary and number of years of working experience at a particular organization and is shown below in the following table.
Find the least-squares regression line.
Data was collected to describe the relationship between salary and number of years of working experience at a particular organization and is shown below in the following table.
Find the least-squares regression line.
Question
NARRBEGIN: Used cars
The following table shows the selling prices and mileages for 7 used cars of a certain model.
Consider the following data values of variables x and y
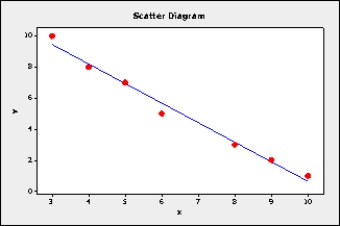
 Use Minitab or Excel to construct a scatter diagram of the data points and plot the least squares regression line on it.
The following table shows the selling prices and mileages for 7 used cars of a certain model.
Consider the following data values of variables x and y
Use Minitab or Excel to construct a scatter diagram of the data points and plot the least squares regression line on it. Question
NARRBEGIN: Number of years
Data was collected to describe the relationship between salary and number of years of working experience at a particular organization and is shown below in the following table.
The divisor of the standard error of estimate in simple linear regression is:
Data was collected to describe the relationship between salary and number of years of working experience at a particular organization and is shown below in the following table.
The divisor of the standard error of estimate in simple linear regression is:
Question
NARRBEGIN: Number of years
Data was collected to describe the relationship between salary and number of years of working experience at a particular organization and is shown below in the following table.
Using the least-squares regression line,predict the salary of an employee with 11 years of experience.
Data was collected to describe the relationship between salary and number of years of working experience at a particular organization and is shown below in the following table.
Using the least-squares regression line,predict the salary of an employee with 11 years of experience.
Question
Question
A simple linear regression problem produced the following sum of squares:  = 240,
  = 60,
= 60,  = 180
= 180
What percentage of the variation in y is not explained by the regression line?
= 240, = 60, = 180What percentage of the variation in y is not explained by the regression line?

Unlock Deck
Sign up to unlock the cards in this deck!
Unlock Deck
Unlock Deck
1/145
Play
Full screen (f)
Deck 15: Simple Linear Regression and Correlation
1
True or False The value of the variation explained by the regression line can never be larger than 1.0.
False
2
True or False The simple linear regression model assumes that regardless of the value for x,the standard deviation of the distribution of y values about the regression line is the same.
True
3
True or False In a simple linear regression model,the residual is the horizontal distance from the regression line to an observed data point.
False
4
True or False The coefficient of determination is a number that indicates both the direction and the strength of the linear relationship between the dependent and independent variable.
Unlock Deck
Unlock for access to all 145 flashcards in this deck.
Unlock Deck
k this deck
5
True or False For a given data set of (x,y)values,an infinite number of possible regression equations can be fitted to the corresponding scatter diagram,and each equation will have a unique combination of values for the y-intercept b0 and the slope b1.However,only one equation will be the "best fit" as defined by the least-squares criterion.
Unlock Deck
Unlock for access to all 145 flashcards in this deck.
Unlock Deck
k this deck
6
Another name for the residual term in a regression equation is:
A) random error.
B) heteroscedasticity.
C) homoscedasticity.
D) pooled variances.
E) residual analysis.
A) random error.
B) heteroscedasticity.
C) homoscedasticity.
D) pooled variances.
E) residual analysis.
Unlock Deck
Unlock for access to all 145 flashcards in this deck.
Unlock Deck
k this deck
7
A regression analysis between weight (y in pounds)and height (x in inches)resulted in the following least squares line: = 120 + 5x.This implies that if the height is increased by 1 inch,the weight is expected to:
A) increase by 1 pound.
B) decrease by 1 pound.
C) increase by 5 pounds.
D) decrease by 24 pounds.
A) increase by 1 pound.
B) decrease by 1 pound.
C) increase by 5 pounds.
D) decrease by 24 pounds.
Unlock Deck
Unlock for access to all 145 flashcards in this deck.
Unlock Deck
k this deck
8
Simple linear regression requires that the scales of measurement be expressed in either:
A) nominal or ordinal.
B) ordinal or ratio.
C) interval or ratio.
D) nominal or ratio.
E) nominal or interval.
A) nominal or ordinal.
B) ordinal or ratio.
C) interval or ratio.
D) nominal or ratio.
E) nominal or interval.
Unlock Deck
Unlock for access to all 145 flashcards in this deck.
Unlock Deck
k this deck
9
True or False The simple linear regression model assumes that the y values are statistically independent of each other but the residuals are statistically dependent of each other.
Unlock Deck
Unlock for access to all 145 flashcards in this deck.
Unlock Deck
k this deck
10
True or False The least-squares criterion requires that the sum of the squared deviations between the y values in the scatter diagram and the y values predicted by the equation be minimized.
Unlock Deck
Unlock for access to all 145 flashcards in this deck.
Unlock Deck
k this deck
11
In the sample regression line the term b0 is the y-intercept; this is the value of y where the line intersects the y-axis whenever x = 0.
Unlock Deck
Unlock for access to all 145 flashcards in this deck.
Unlock Deck
k this deck
12
True or False When the predicted values of y and the actual values of y are the same,the standard error of estimate will be 0.0.
Unlock Deck
Unlock for access to all 145 flashcards in this deck.
Unlock Deck
k this deck
13
True or False The simple linear regression model assumes that for any given value of x,the population of residuals will be normally distributed with a mean of zero and a standard deviation of 1.
Unlock Deck
Unlock for access to all 145 flashcards in this deck.
Unlock Deck
k this deck
14
True or False An ANOVA test based on SST and SSR is equivalent to t-test for the coefficient of correlation and the slope.
Unlock Deck
Unlock for access to all 145 flashcards in this deck.
Unlock Deck
k this deck
15
A regression analysis between sales (in $1000)and advertising (in $100)resulted in the following least squares line: = 75 +6x.This implies that if advertising is $800,then the predicted amount of sales (in dollars)is:
A) $4875.
B) $123,000.
C) $487,500.
D) $12,300.
A) $4875.
B) $123,000.
C) $487,500.
D) $12,300.
Unlock Deck
Unlock for access to all 145 flashcards in this deck.
Unlock Deck
k this deck
16
Which of the following statements is true regarding the simple linear regression model
A) is a value of the dependent variable (y) and xi is a value of the independent variable (x).
B) 0 is the y-intercept of the regression line.
C) 1 is the slope of the regression line.
D) 1 is a random error,or residual.
E) All of the above are true statements.
A) is a value of the dependent variable (y) and xi is a value of the independent variable (x).
B) 0 is the y-intercept of the regression line.
C) 1 is the slope of the regression line.
D) 1 is a random error,or residual.
E) All of the above are true statements.
Unlock Deck
Unlock for access to all 145 flashcards in this deck.
Unlock Deck
k this deck
17
Regardless of the value of x,the standard deviation of the distribution of y values about the regression line is the same.This assumption of equal standard deviations about the regression line is called:
A) random error.
B) heteroscedasticity.
C) homoscedasticity.
D) pooled variances.
E) residual analysis.
A) random error.
B) heteroscedasticity.
C) homoscedasticity.
D) pooled variances.
E) residual analysis.
Unlock Deck
Unlock for access to all 145 flashcards in this deck.
Unlock Deck
k this deck
18
A regression analysis between sales (in $1000)and advertising (in $)resulted in the following least squares line: = 80,000 + 5x.This implies that an:
A) increase of $1 in advertising is expected to result in an increase of $5 in sales.
B) increase $5 in advertising is expected to result in an increase of $5,000 in sales.
C) increase of $1 in advertising is expected to result in an increase of $80,005 in sales.
D) increase of $1 in advertising is expected to result in an increase of $5,000 in sales.
Unlock Deck
Unlock for access to all 145 flashcards in this deck.
Unlock Deck
k this deck
19
The residual is defined as the difference between the:
A) actual value of y and the estimated value of y.
B) actual value of x and the estimated value of x
C) actual value of y and the estimated value of x.
D) actual value of x and the estimated value of y.
A) actual value of y and the estimated value of y.
B) actual value of x and the estimated value of x
C) actual value of y and the estimated value of x.
D) actual value of x and the estimated value of y.
Unlock Deck
Unlock for access to all 145 flashcards in this deck.
Unlock Deck
k this deck
20
True or False The coefficient of determination can be described in terms of the total variation in y versus the unexplained variation in y.
Unlock Deck
Unlock for access to all 145 flashcards in this deck.
Unlock Deck
k this deck
21
If the standard error of estimate = 18 and n = 10, then the error sum of squares, SSE, is:
A) 2916.
B) 2592.
C) 1800.
D) 3240.
A) 2916.
B) 2592.
C) 1800.
D) 3240.
Unlock Deck
Unlock for access to all 145 flashcards in this deck.
Unlock Deck
k this deck
22
The following values are listed as coefficients of correlation (r).The one that indicates an inverse relationship between the two variables x and y is:
A) 0.0.
B) -0.8.
C) 0.9.
D) 1.3.
E) -1.4.
A) 0.0.
B) -0.8.
C) 0.9.
D) 1.3.
E) -1.4.
Unlock Deck
Unlock for access to all 145 flashcards in this deck.
Unlock Deck
k this deck
23
For a given value of x,the estimation interval for an individual y observation is called the:
A) confidence interval.
B) residual.
C) prediction interval.
D) least-squares interval.
E) standard error of estimate.
A) confidence interval.
B) residual.
C) prediction interval.
D) least-squares interval.
E) standard error of estimate.
Unlock Deck
Unlock for access to all 145 flashcards in this deck.
Unlock Deck
k this deck
24
Correlation analysis requires that the scales of measurement be expressed in either:
A) nominal or ordinal.
B) ordinal or ratio.
C) interval or ratio.
D) nominal or ratio.
E) nominal or interval.
A) nominal or ordinal.
B) ordinal or ratio.
C) interval or ratio.
D) nominal or ratio.
E) nominal or interval.
Unlock Deck
Unlock for access to all 145 flashcards in this deck.
Unlock Deck
k this deck
25
In simple linear regression,the coefficient of correlation r and the least squares estimate of the population slope :
A) must have the same numerical value.
B) must have opposite signs.
C) must have the same sign.
D) may have opposite signs or the same sign.
A) must have the same numerical value.
B) must have opposite signs.
C) must have the same sign.
D) may have opposite signs or the same sign.
Unlock Deck
Unlock for access to all 145 flashcards in this deck.
Unlock Deck
k this deck
26
Which of the following table values would be appropriate for a 95% confidence interval for the mean of y from a simple linear regression problem if the sample size is 7?
A) 1.895
B) 2.015
C) 2.365
D) 2.571
E) 1.960
A) 1.895
B) 2.015
C) 2.365
D) 2.571
E) 1.960
Unlock Deck
Unlock for access to all 145 flashcards in this deck.
Unlock Deck
k this deck
27
Given the least squares regression line = -2.88 + 1.77x,and a coefficient of determination of 0.81,the coefficient of correlation is:
A) -0.88.
B) +0.88.
C) +0.90.
D) -0.90.
A) -0.88.
B) +0.88.
C) +0.90.
D) -0.90.
Unlock Deck
Unlock for access to all 145 flashcards in this deck.
Unlock Deck
k this deck
28
The regression line = 3 + 2x has been fitted to the data points (4,8), (2,5), and (1,2). The residual sum of squares will be:
A) 10.
B) 15.
C) 13.
D) 22.
A) 10.
B) 15.
C) 13.
D) 22.
Unlock Deck
Unlock for access to all 145 flashcards in this deck.
Unlock Deck
k this deck
29
The number of degrees of freedom associated with the standard error of estimate is
A) n-1 since only the slope is estimated from sample data.
B) n-1 since only the intercept is estimated from sample data.
C) n-1 since only the predicted value of y is estimated from sample data.
D) n-2 since the slope and the intercept are estimated from sample data.
A) n-1 since only the slope is estimated from sample data.
B) n-1 since only the intercept is estimated from sample data.
C) n-1 since only the predicted value of y is estimated from sample data.
D) n-2 since the slope and the intercept are estimated from sample data.
Unlock Deck
Unlock for access to all 145 flashcards in this deck.
Unlock Deck
k this deck
30
For the values of the coefficient of determination listed below,which one implies the greatest value of SSR (regression sum of squares)given that SST = 500?
A) 0.95
B) -1.00
C) 0.28
D) 0.00
E) -0.88
A) 0.95
B) -1.00
C) 0.28
D) 0.00
E) -0.88
Unlock Deck
Unlock for access to all 145 flashcards in this deck.
Unlock Deck
k this deck
31
In order to estimate with 95% confidence the expected value of y in a simple linear regression problem,a random sample of 10 observations is taken.Which of the following t-table values listed below would be used?
A) 2.228
B) 2.306
C) 1.860
D) 1.812
A) 2.228
B) 2.306
C) 1.860
D) 1.812
Unlock Deck
Unlock for access to all 145 flashcards in this deck.
Unlock Deck
k this deck
32
In a regression problem the following pairs of (x,y)are given: (2,1),(2,-1),(2,0),(2,-2)and (2,2).That indicates that the:
A) coefficient of correlation is -1.
B) coefficient of correlation is 0.
C) coefficient of correlation is 1.
D) coefficient of determination is between -1 and 1.
A) coefficient of correlation is -1.
B) coefficient of correlation is 0.
C) coefficient of correlation is 1.
D) coefficient of determination is between -1 and 1.
Unlock Deck
Unlock for access to all 145 flashcards in this deck.
Unlock Deck
k this deck
33
In publishing the results of some research work,the following values of the coefficient of determination were listed.Which one would appear to be incorrect?
A) 0.91
B) 0.06
C) 0.47
D) -0.64
E) 0.00
A) 0.91
B) 0.06
C) 0.47
D) -0.64
E) 0.00
Unlock Deck
Unlock for access to all 145 flashcards in this deck.
Unlock Deck
k this deck
34
All of the values of an independent variable equal the same number.Regressing a dependent variable on this independent variable will result in a coefficient of determination (r 2 )of:
A) 0.0.
B) -1.0.
C) 2.3.
D) -2.3.
E) 1.0.
A) 0.0.
B) -1.0.
C) 2.3.
D) -2.3.
E) 1.0.
Unlock Deck
Unlock for access to all 145 flashcards in this deck.
Unlock Deck
k this deck
35
The vertical spread of the data points about the regression line is measured by the:
A) regression coefficient.
B) standard error of estimate.
C) y-intercept.
D) homoscedasticity coefficient.
E) t-ratio.
A) regression coefficient.
B) standard error of estimate.
C) y-intercept.
D) homoscedasticity coefficient.
E) t-ratio.
Unlock Deck
Unlock for access to all 145 flashcards in this deck.
Unlock Deck
k this deck
36
An indication of no linear relationship between two variables would be:
A) a coefficient of determination equal to 1.
B) a coefficient of determination equal to -1.
C) a coefficient of correlation of 0.
D) a coefficient of correlation equal to -1.
E) Both "A" and "B" are correct.
A) a coefficient of determination equal to 1.
B) a coefficient of determination equal to -1.
C) a coefficient of correlation of 0.
D) a coefficient of correlation equal to -1.
E) Both "A" and "B" are correct.
Unlock Deck
Unlock for access to all 145 flashcards in this deck.
Unlock Deck
k this deck
37
The value for SSE equals zero.This means that the coefficient of determination (r 2 )must equal:
A) 0.0.
B) -1.0.
C) 2.3.
D) -2.3.
E) 1.0.
A) 0.0.
B) -1.0.
C) 2.3.
D) -2.3.
E) 1.0.
Unlock Deck
Unlock for access to all 145 flashcards in this deck.
Unlock Deck
k this deck
38
If all the points in a scatter diagram lie on the least squares regression line,then the coefficient of correlation:
A) must be 1.0.
B) must be -1.0.
C) must be either 1.0 or -1.0.
D) must be 0.
A) must be 1.0.
B) must be -1.0.
C) must be either 1.0 or -1.0.
D) must be 0.
Unlock Deck
Unlock for access to all 145 flashcards in this deck.
Unlock Deck
k this deck
39
Correlation analysis is used to determine the:
A) strength of the relationship between x and y.
B) least squares estimates of the regression parameters.
C) predicted value of y for a given value of x.
D) coefficient of determination.
A) strength of the relationship between x and y.
B) least squares estimates of the regression parameters.
C) predicted value of y for a given value of x.
D) coefficient of determination.
Unlock Deck
Unlock for access to all 145 flashcards in this deck.
Unlock Deck
k this deck
40
In a regression problem,if the coefficient of determination is 0.90,this means that:
A) 90% of the y values are positive.
B) 90% of the variation in y can be explained by the regression line
C) 90% of the x values are equal.
D) 90% of the variation in x can be explained by regression line.
A) 90% of the y values are positive.
B) 90% of the variation in y can be explained by the regression line
C) 90% of the x values are equal.
D) 90% of the variation in x can be explained by regression line.
Unlock Deck
Unlock for access to all 145 flashcards in this deck.
Unlock Deck
k this deck
41
____________________ provides a "best-fit" mathematical equation for the values of two variables,x and y.
Unlock Deck
Unlock for access to all 145 flashcards in this deck.
Unlock Deck
k this deck
42
Briefly describe each of the following:
a)Homoscedasticity
b)Residual
a)Homoscedasticity
b)Residual
Unlock Deck
Unlock for access to all 145 flashcards in this deck.
Unlock Deck
k this deck
43
Briefly describe each of the following:
A)An inverse relationship between variables __________________________________
B)A direct relationship between variables __________________________________
C)A linear relationship between variables __________________________________
D)A curvilinear relationship between variables __________________________________
Unlock Deck
Unlock for access to all 145 flashcards in this deck.
Unlock Deck
k this deck
44
______________________________ measures the strength of the relationship between the dependent and independent variables.
Unlock Deck
Unlock for access to all 145 flashcards in this deck.
Unlock Deck
k this deck
45
If the coefficient of correlation is either ____________________ or ____________________,then the regression line will actually include all of the data points and the line will be a perfect fit.
Unlock Deck
Unlock for access to all 145 flashcards in this deck.
Unlock Deck
k this deck
46
The coefficient of determination can take on values between ____________________ and ____________________,inclusive.
Unlock Deck
Unlock for access to all 145 flashcards in this deck.
Unlock Deck
k this deck
47
If the sum of squares due to regression (SSR)is 60,which of the following must be true?
A) The coefficient of correlation is 0.9.
B) The total sum of squares (SST)is at least 60.
C) The y-intercept is positive.
D) The slope,b,is positive.
E) The coefficient of determination is 0.81.
A) The coefficient of correlation is 0.9.
B) The total sum of squares (SST)is at least 60.
C) The y-intercept is positive.
D) The slope,b,is positive.
E) The coefficient of determination is 0.81.
Unlock Deck
Unlock for access to all 145 flashcards in this deck.
Unlock Deck
k this deck
48
Correlation analysis provides us with two important measures of the strength: (1)the coefficient of ____________________ and (2)the coefficient of ____________________.
Unlock Deck
Unlock for access to all 145 flashcards in this deck.
Unlock Deck
k this deck
49
The ____________________ requires that the sum of the squared deviations between y values in the scatter diagram and y values predicted by the equation be minimized.
Unlock Deck
Unlock for access to all 145 flashcards in this deck.
Unlock Deck
k this deck
50
The symbol for the independent variable is ____________________ and the symbol for the dependent variable is ____________________.
Unlock Deck
Unlock for access to all 145 flashcards in this deck.
Unlock Deck
k this deck
51
The coefficient of correlation assumes values between ____________________ and ____________________,inclusive.
Unlock Deck
Unlock for access to all 145 flashcards in this deck.
Unlock Deck
k this deck
52
The assumption of equal standard deviations about the regression line is called _________________________.
Unlock Deck
Unlock for access to all 145 flashcards in this deck.
Unlock Deck
k this deck
53
A simple linear regression problem produced the following sum of squares: = 240, = 60, = 180
What percentage of the variation in y is explained by the regression line?
= 240, = 60, = 180What percentage of the variation in y is explained by the regression line?
Unlock Deck
Unlock for access to all 145 flashcards in this deck.
Unlock Deck
k this deck
54
If the coefficient of correlation is -0.90,what percentage of the variation in y is explained by the regression line?
Unlock Deck
Unlock for access to all 145 flashcards in this deck.
Unlock Deck
k this deck
55
Consider the following data values of variables x and y
Use Excel or Minitab to construct a scatter diagram of the data points
Use Excel or Minitab to construct a scatter diagram of the data points Unlock Deck
Unlock for access to all 145 flashcards in this deck.
Unlock Deck
k this deck
56
If the total variation in y values is 200,and the variation explained by regression line is 180,then the coefficient of determination is equal to ____________________.
Unlock Deck
Unlock for access to all 145 flashcards in this deck.
Unlock Deck
k this deck
57
In a simple linear model,testing whether the slope of the population regression line is zero is the same as testing whether or not the population ____________________ equals zero.
Unlock Deck
Unlock for access to all 145 flashcards in this deck.
Unlock Deck
k this deck
58
One way to examine whether two variables might be linearly related is to construct a ______________________________.
Unlock Deck
Unlock for access to all 145 flashcards in this deck.
Unlock Deck
k this deck
59
If the coefficient of correlation r is positive,then the dependent variable and the independent variable x are said to be ____________________ related.However,if r is negative,then x and y are said to be ____________________ related.
Unlock Deck
Unlock for access to all 145 flashcards in this deck.
Unlock Deck
k this deck
60
The variation explained by regression line is denoted by ____________________,while the variation not explained by regression line is denoted by ____________________.
Unlock Deck
Unlock for access to all 145 flashcards in this deck.
Unlock Deck
k this deck
61
NARRBEGIN: Used cars
The following table shows the selling prices and mileages for 7 used cars of a certain model.
Using the least-squares regression line,predict the selling price of a car with 55,000 miles.
The following table shows the selling prices and mileages for 7 used cars of a certain model.
Using the least-squares regression line,predict the selling price of a car with 55,000 miles.
Unlock Deck
Unlock for access to all 145 flashcards in this deck.
Unlock Deck
k this deck
62
NARRBEGIN: Used cars
The following table shows the selling prices and mileages for 7 used cars of a certain model.
Identify the dependent and independent variable.
The following table shows the selling prices and mileages for 7 used cars of a certain model.
Identify the dependent and independent variable.
Unlock Deck
Unlock for access to all 145 flashcards in this deck.
Unlock Deck
k this deck
63
NARRBEGIN: Used cars
The following table shows the selling prices and mileages for 7 used cars of a certain model.
Find the least-squares regression line.
The following table shows the selling prices and mileages for 7 used cars of a certain model.
Find the least-squares regression line.
Unlock Deck
Unlock for access to all 145 flashcards in this deck.
Unlock Deck
k this deck
64
NARRBEGIN: Teacher
A statistics teacher collected the following data to determine if the number of hours a student studied during the semester could be used to predict the final grade for the course.
In testing the hypotheses vs. ,what is the value of the test statistic?
A statistics teacher collected the following data to determine if the number of hours a student studied during the semester could be used to predict the final grade for the course.
In testing the hypotheses
vs. ,what is the value of the test statistic? Unlock Deck
Unlock for access to all 145 flashcards in this deck.
Unlock Deck
k this deck
65
NARRBEGIN: Teacher
A statistics teacher collected the following data to determine if the number of hours a student studied during the semester could be used to predict the final grade for the course.
In testing the hypotheses vs. ,what is the conclusion at the 0.05 significance level?
A statistics teacher collected the following data to determine if the number of hours a student studied during the semester could be used to predict the final grade for the course.
In testing the hypotheses
vs. ,what is the conclusion at the 0.05 significance level? Unlock Deck
Unlock for access to all 145 flashcards in this deck.
Unlock Deck
k this deck
66
NARRBEGIN: GPA
The following table shows the grade point average (GPA)for 5 students along with their entrance exam scores for MBA programs (GMAT).Develop a model that would predict the GPA of a student based on their GMAT score.
Determine the standard error of estimate.
The following table shows the grade point average (GPA)for 5 students along with their entrance exam scores for MBA programs (GMAT).Develop a model that would predict the GPA of a student based on their GMAT score.
Determine the standard error of estimate.
Unlock Deck
Unlock for access to all 145 flashcards in this deck.
Unlock Deck
k this deck
67
NARRBEGIN: Number of years
Data was collected to describe the relationship between salary and number of years of working experience at a particular organization and is shown below in the following table.
Identify the dependent and independent variables.
Data was collected to describe the relationship between salary and number of years of working experience at a particular organization and is shown below in the following table.
Identify the dependent and independent variables.
Unlock Deck
Unlock for access to all 145 flashcards in this deck.
Unlock Deck
k this deck
68
NARRBEGIN: GPA
The following table shows the grade point average (GPA)for 5 students along with their entrance exam scores for MBA programs (GMAT).Develop a model that would predict the GPA of a student based on their GMAT score.
Determine the least-squares regression line.
The following table shows the grade point average (GPA)for 5 students along with their entrance exam scores for MBA programs (GMAT).Develop a model that would predict the GPA of a student based on their GMAT score.
Determine the least-squares regression line.
Unlock Deck
Unlock for access to all 145 flashcards in this deck.
Unlock Deck
k this deck
69
NARRBEGIN: Teacher
A statistics teacher collected the following data to determine if the number of hours a student studied during the semester could be used to predict the final grade for the course.
In testing the hypotheses vs. ,what is the rejection region at the 0.05 significance level?
A statistics teacher collected the following data to determine if the number of hours a student studied during the semester could be used to predict the final grade for the course.
In testing the hypotheses
vs. ,what is the rejection region at the 0.05 significance level? Unlock Deck
Unlock for access to all 145 flashcards in this deck.
Unlock Deck
k this deck
70
NARRBEGIN: X and Y
Consider the following data values of variables x and y
Given that when a simple linear regression model applied to the data,it produced the following residuals:
0.062,-0.195,0.548,-0.682,0.089,-0.168,and 0.346.
Apply the Lilliefors test to the residuals at = 0.05.What is your conclusion?
Consider the following data values of variables x and y
Given that when a simple linear regression model applied to the data,it produced the following residuals:
0.062,-0.195,0.548,-0.682,0.089,-0.168,and 0.346.
Apply the Lilliefors test to the residuals at
= 0.05.What is your conclusion? Unlock Deck
Unlock for access to all 145 flashcards in this deck.
Unlock Deck
k this deck
71
NARRBEGIN: X and Y
Consider the following data values of variables x and y
Given that the simple linear regression equation is ,use Minitab to create a normal probability plot of the residuals.
Consider the following data values of variables x and y
Given that the simple linear regression equation is
,use Minitab to create a normal probability plot of the residuals. Unlock Deck
Unlock for access to all 145 flashcards in this deck.
Unlock Deck
k this deck
72
NARRBEGIN: Used cars
The following table shows the selling prices and mileages for 7 used cars of a certain model.
Consider the following data values of variables x and y
What does the scatter diagram tell you about the relationship between x and y?
The following table shows the selling prices and mileages for 7 used cars of a certain model.
Consider the following data values of variables x and y
What does the scatter diagram tell you about the relationship between x and y? Unlock Deck
Unlock for access to all 145 flashcards in this deck.
Unlock Deck
k this deck
73
What does the following scatter diagram tell you about the relationship between x and y?
Unlock Deck
Unlock for access to all 145 flashcards in this deck.
Unlock Deck
k this deck
74
Construct a 95% prediction interval for an individual y value when x = 6.5.
Unlock Deck
Unlock for access to all 145 flashcards in this deck.
Unlock Deck
k this deck
75
NARRBEGIN: Number of years
Data was collected to describe the relationship between salary and number of years of working experience at a particular organization and is shown below in the following table.
Find the least-squares regression line.
Data was collected to describe the relationship between salary and number of years of working experience at a particular organization and is shown below in the following table.
Find the least-squares regression line.
Unlock Deck
Unlock for access to all 145 flashcards in this deck.
Unlock Deck
k this deck
76
NARRBEGIN: Used cars
The following table shows the selling prices and mileages for 7 used cars of a certain model.
Consider the following data values of variables x and y
Use Minitab or Excel to construct a scatter diagram of the data points and plot the least squares regression line on it.
The following table shows the selling prices and mileages for 7 used cars of a certain model.
Consider the following data values of variables x and y
Use Minitab or Excel to construct a scatter diagram of the data points and plot the least squares regression line on it. Unlock Deck
Unlock for access to all 145 flashcards in this deck.
Unlock Deck
k this deck
77
NARRBEGIN: Number of years
Data was collected to describe the relationship between salary and number of years of working experience at a particular organization and is shown below in the following table.
The divisor of the standard error of estimate in simple linear regression is:
Data was collected to describe the relationship between salary and number of years of working experience at a particular organization and is shown below in the following table.
The divisor of the standard error of estimate in simple linear regression is:
Unlock Deck
Unlock for access to all 145 flashcards in this deck.
Unlock Deck
k this deck
78
NARRBEGIN: Number of years
Data was collected to describe the relationship between salary and number of years of working experience at a particular organization and is shown below in the following table.
Using the least-squares regression line,predict the salary of an employee with 11 years of experience.
Data was collected to describe the relationship between salary and number of years of working experience at a particular organization and is shown below in the following table.
Using the least-squares regression line,predict the salary of an employee with 11 years of experience.
Unlock Deck
Unlock for access to all 145 flashcards in this deck.
Unlock Deck
k this deck
79
Construct a 95% confidence interval for the mean GPA when GMAT = 6.5.
Unlock Deck
Unlock for access to all 145 flashcards in this deck.
Unlock Deck
k this deck
80
A simple linear regression problem produced the following sum of squares: = 240, = 60, = 180
What percentage of the variation in y is not explained by the regression line?
= 240, = 60, = 180What percentage of the variation in y is not explained by the regression line?
Unlock Deck
Unlock for access to all 145 flashcards in this deck.
Unlock Deck
k this deck
Unlock Deck
Unlock for access to all 145 flashcards in this deck.


