Deck 20: Total Quality Management
Full screen (f)
Question
Question
Question
Question
Question
Question
Question
Question
Question
Question
Question
Question
Question
Question
Question
Question
Question
Question
Question
Question
Question
Question
Question
Question
Question
Question
Question
Question
Question
Question
Question
Question
Question
Question
Question
Question
Question
Question
Question
Question
Question
Question
Question
Question
Question
Question
Question
Question
Question
Question
Question
Question
Question
Question
Question
Question
Question
Question
Question
Question
Question
NARRBEGIN: Bottles
A bottle filling machine fills bottles with 16 oz of soda.Each hour,3 bottles are weighed on a precision scale to determine if the process is under control.The following data has been collected from the last 4 hours.Each value in the table represents the weight of an individual bottle.

Assuming this data was collected when the process was operating satisfactorily,construct 3-sigma limits for the mean chart.
A bottle filling machine fills bottles with 16 oz of soda.Each hour,3 bottles are weighed on a precision scale to determine if the process is under control.The following data has been collected from the last 4 hours.Each value in the table represents the weight of an individual bottle.
Assuming this data was collected when the process was operating satisfactorily,construct 3-sigma limits for the mean chart.
Question
Question
NARRBEGIN: Bottles
A bottle filling machine fills bottles with 16 oz of soda.Each hour,3 bottles are weighed on a precision scale to determine if the process is under control.The following data has been collected from the last 4 hours.Each value in the table represents the weight of an individual bottle.
At 11:00 AM,the weights of the following three bottles were recorded: 16.0,16.7,15.2.According to this sample,is the process in control?
Question
Question
Question
NARRBEGIN: Bottles
A bottle filling machine fills bottles with 16 oz of soda.Each hour,3 bottles are weighed on a precision scale to determine if the process is under control.The following data has been collected from the last 4 hours.Each value in the table represents the weight of an individual bottle.
Assuming this data was collected when the process was operating satisfactorily,construct 3-sigma limits for the range chart.
Question
Question
Question
Question
Question
Question
Question
Question
Question
Question
Use the following data to prepare the upper and lower control limits for a mean chart.Each sample contains 3 values. 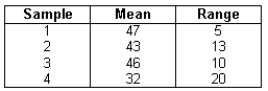 Compute the lower and upper control limits.
Lower value = ____________________
Upper value = ____________________
Compute the lower and upper control limits.Lower value = ____________________
Upper value = ____________________
Question
Question
Question
Question

Unlock Deck
Sign up to unlock the cards in this deck!
Unlock Deck
Unlock Deck
1/132
Play
Full screen (f)
Deck 20: Total Quality Management
1
True or False Six Sigma is a philosophy that focuses on small,ongoing improvements rather than relying on large-scale innovations,such as might come from advances in technology or equipment.
False
2
True or False Where traditional quality control tended to be results oriented,total quality management is process oriented.
True
3
True or False Control charts are available for individual observations,moving averages,and moving ranges.
True
4
True or False The process flow chart is used to tally frequency counts or record measurements and is a mechanism for entering and retaining data that may be subject to further analysis by another statistical tool.
Unlock Deck
Unlock for access to all 132 flashcards in this deck.
Unlock Deck
k this deck
5
True or False The Pareto diagram,also known as the Juran diagram,is a bar chart describing the relative frequencies with which various kinds of defects,or nonconformities,have occurred.
Unlock Deck
Unlock for access to all 132 flashcards in this deck.
Unlock Deck
k this deck
6
True or False When the purpose of sampling is to detect when a process becomes too variable,the chart of choice will be a c-chart.
Unlock Deck
Unlock for access to all 132 flashcards in this deck.
Unlock Deck
k this deck
7
True or False Assignable variation occurs due to identifiable causes that have changed the process.
Unlock Deck
Unlock for access to all 132 flashcards in this deck.
Unlock Deck
k this deck
8
True or False In general,as long as random variation is absent and assignable variation remains within acceptable limits,the process is deemed to be stable,or in statistical control.
Unlock Deck
Unlock for access to all 132 flashcards in this deck.
Unlock Deck
k this deck
9
True or False Control charts for variables are appropriate whenever we are interested in monitoring measurements,such as weights,diameters,or temperature.
Unlock Deck
Unlock for access to all 132 flashcards in this deck.
Unlock Deck
k this deck
10
True or False The cause-and-effect diagram visually depicts the operations (or subprocesses)involved in a process,showing the sequential relationships between them.
Unlock Deck
Unlock for access to all 132 flashcards in this deck.
Unlock Deck
k this deck
11
True or False If a point is more than 3 sigmas away from the centerline,or if two out of three consecutive points are on the same side of the centerline and more than 2 sigmas away from it,the process is deemed to be in control.
Unlock Deck
Unlock for access to all 132 flashcards in this deck.
Unlock Deck
k this deck
12
True or False If six points in a row are all headed either upward or downward,or if nine points in a row are on the same side of the centerline,the process is judged to be out of control.
Unlock Deck
Unlock for access to all 132 flashcards in this deck.
Unlock Deck
k this deck
13
True or False Acceptance sampling involves inspection of a sample of products after an entire production run or shipment lot has been produced.As such,it represents a defect-detection approach to quality management.
Unlock Deck
Unlock for access to all 132 flashcards in this deck.
Unlock Deck
k this deck
14
True or False Competitive benchmarking involves studying,and attempting to emulate,the strategies and practices of organizations already known to generate world-class products and services.
Unlock Deck
Unlock for access to all 132 flashcards in this deck.
Unlock Deck
k this deck
15
True or False The p-chart and the c-chart are examples of control charts for attributes
Unlock Deck
Unlock for access to all 132 flashcards in this deck.
Unlock Deck
k this deck
16
True or False Perceived quality refers to attributes that relate to the human senses,for example,how a product looks,feels,tastes,or smells.
Unlock Deck
Unlock for access to all 132 flashcards in this deck.
Unlock Deck
k this deck
17
True or False When the purpose of sampling is to detect when a process becomes too variable,the chart of choice will be an R chart.
Unlock Deck
Unlock for access to all 132 flashcards in this deck.
Unlock Deck
k this deck
18
True or False Although both statistical process control (SPC)and acceptance sampling make inferences on the basis of samples,SPC uses sampled products to make inferences about a larger population of the products,while acceptance sampling uses the sampled products to make inferences about the process from which they came.
Unlock Deck
Unlock for access to all 132 flashcards in this deck.
Unlock Deck
k this deck
19
True or False Random variation occurs due to identifiable causes that have changed the process.
Unlock Deck
Unlock for access to all 132 flashcards in this deck.
Unlock Deck
k this deck
20
True or False One of Dr.Deming's earliest contributions to total quality management was the Deming cycle,also known as the Deming wheel and the PDCA (Plan-Do-Check-Act)cycle.
Unlock Deck
Unlock for access to all 132 flashcards in this deck.
Unlock Deck
k this deck
21
Which of the following describes the purpose of acceptance sampling (defect-detection)?
A) Computer chips received by a computer maker are sampled before the shipment is accepted or rejected.
B) The manufacturer of pocket knifes samples its process at three stages before allowing the pocket knives to be assembled.
C) The manufacturer of gypsum wallboard subjects samples of its fireproof version to tests in controlled fire situations.
D) Each worker is responsible for the quality of his/her output and tests each item before sending them on to packaging.
E) A quality checksheet for each division is completed before the product is released to retailers.
Unlock Deck
Unlock for access to all 132 flashcards in this deck.
Unlock Deck
k this deck
22
When the only sources of variation in a production process are caused by chance,and random variation remains within acceptable limits,the process is said to be:
A) stable.
B) in statistical control.
C) out of control.
D) out of luck.
E) Both A and B since they are the same.
A) stable.
B) in statistical control.
C) out of control.
D) out of luck.
E) Both A and B since they are the same.
Unlock Deck
Unlock for access to all 132 flashcards in this deck.
Unlock Deck
k this deck
23
Individual units can have higher quality than others,even while meeting traditional specifications.Deviations from the target lead to lower and lower quality of the unit.This concept is associated with a:
A) cause and effect diagram.
B) process flow chart.
C) check sheet.
D) Taguchi method.
E) Pareto diagram.
A) cause and effect diagram.
B) process flow chart.
C) check sheet.
D) Taguchi method.
E) Pareto diagram.
Unlock Deck
Unlock for access to all 132 flashcards in this deck.
Unlock Deck
k this deck
24
A random sample of 100 rods from a process with a mean of 20 feet produced a sample mean of 20.01 feet and a standard deviation of 0.015.This difference between the process mean and the sample mean is likely to be:
A) assignable variation.
B) special-cause variation.
C) random variation.
D) homoscedasticity.
E) costs of attrition.
A) assignable variation.
B) special-cause variation.
C) random variation.
D) homoscedasticity.
E) costs of attrition.
Unlock Deck
Unlock for access to all 132 flashcards in this deck.
Unlock Deck
k this deck
25
Variations in process output that can usually be identified and eliminated without changing the process are:
A) assignable variations.
B) chance variations.
C) out of control variations.
D) random variations.
E) All of these.
A) assignable variations.
B) chance variations.
C) out of control variations.
D) random variations.
E) All of these.
Unlock Deck
Unlock for access to all 132 flashcards in this deck.
Unlock Deck
k this deck
26
Variations in process output that are caused by specific events or factors that are frequently temporary such as machine malfunction are:
A) assignable variations.
B) chance variations.
C) out of control variations.
D) random variations.
E) All of these.
A) assignable variations.
B) chance variations.
C) out of control variations.
D) random variations.
E) All of these.
Unlock Deck
Unlock for access to all 132 flashcards in this deck.
Unlock Deck
k this deck
27
Which of the following describes the purpose of statistical process control (defect-prevention)?
A) A consumer buys a TV and plugs it in.It doesn't work and she returns it.
B) A soft drink company samples its product at 25 retail establishments to determine if the canner's mixture meets the soft drink company's standard.
C) The Army purchases hammers and tests 10 of them before accepting the entire shipment.
D) Computer chips received by a computer maker are sampled before the shipment is accepted or rejected.
E) The manufacturer of pocket knifes samples its process at three stages before allowing the pocket knives to be assembled.
Unlock Deck
Unlock for access to all 132 flashcards in this deck.
Unlock Deck
k this deck
28
Which of the following relates to costs of non-conformance?
A) Coordination with suppliers.
B) Defective products that reduce goodwill.
C) Periodic customer surveys.
D) Worker involvement.
E) Revisions to product design.
A) Coordination with suppliers.
B) Defective products that reduce goodwill.
C) Periodic customer surveys.
D) Worker involvement.
E) Revisions to product design.
Unlock Deck
Unlock for access to all 132 flashcards in this deck.
Unlock Deck
k this deck
29
In statistical process control (SPC),a Type I error occurs if we conclude that the process is:
A) in control when in fact it is not.
B) out of control when in fact it is not.
C) in control when this is really true.
D) out of control when this is really true.
E) None of these.
A) in control when in fact it is not.
B) out of control when in fact it is not.
C) in control when this is really true.
D) out of control when this is really true.
E) None of these.
Unlock Deck
Unlock for access to all 132 flashcards in this deck.
Unlock Deck
k this deck
30
True or False The TQM philosophy of defect prevention has quality integrated throughout the organizational structure and central to corporate thinking in all matters.
Unlock Deck
Unlock for access to all 132 flashcards in this deck.
Unlock Deck
k this deck
31
Variations in process output that are caused by events that in general cannot be eliminated without changing the process are:
A) assignable variations.
B) random variations.
C) out of control variations.
D) None of these.
E) All of these.
A) assignable variations.
B) random variations.
C) out of control variations.
D) None of these.
E) All of these.
Unlock Deck
Unlock for access to all 132 flashcards in this deck.
Unlock Deck
k this deck
32
An electronics part manufacturer reprimanded an employee.The number of defective parts produced by the employee increased.The increase in the number of defective parts is probably an example of:
A) assignable variation.
B) common-cause variation.
C) random variation.
D) homoscedasticity.
E) costs of attrition.
A) assignable variation.
B) common-cause variation.
C) random variation.
D) homoscedasticity.
E) costs of attrition.
Unlock Deck
Unlock for access to all 132 flashcards in this deck.
Unlock Deck
k this deck
33
Which of the following statements is correct with regard to random variation?
A) It occurs as the result of chance
B) It is inherent in practically any process
C) It leads to random variation in the product
D) It can often be reduced by using more expensive machines or materials
E) All of these statements are correct
A) It occurs as the result of chance
B) It is inherent in practically any process
C) It leads to random variation in the product
D) It can often be reduced by using more expensive machines or materials
E) All of these statements are correct
Unlock Deck
Unlock for access to all 132 flashcards in this deck.
Unlock Deck
k this deck
34
When no point lies outside the control limits of a chart,we conclude that:
A) variation in the process is caused by assignable causes and there is enough evidence to infer that the process is in statistical control.
B) variation in the process is caused by chance and there is enough evidence to infer that the process is out of control.
C) variation in the process is caused by chance and there is not enough evidence to infer that the process is out of control.
D) variation in the process is caused by assignable causes and there is not enough evidence to infer that the process is out of control.
E) None of these.
Unlock Deck
Unlock for access to all 132 flashcards in this deck.
Unlock Deck
k this deck
35
Which of the following relates to costs of conformance?
A) Defective products that reduce goodwill.
B) Poor quality requiring product recalls.
C) Periodic worker training.
D) Poor quality requiring warranty expenses.
E) Product liability lawsuits.
A) Defective products that reduce goodwill.
B) Poor quality requiring product recalls.
C) Periodic worker training.
D) Poor quality requiring warranty expenses.
E) Product liability lawsuits.
Unlock Deck
Unlock for access to all 132 flashcards in this deck.
Unlock Deck
k this deck
36
Although both statistical process control and acceptance sampling make inferences on the basis of samples,
A) acceptance sampling involves inspection of a sample of products during the production run.
B) SPC uses sampled products to make inferences about the process from which they came.
C) acceptance sampling uses sampled products to make inferences about a larger population of the products.
D) Both B and C
E) All of the above statements are true.
Unlock Deck
Unlock for access to all 132 flashcards in this deck.
Unlock Deck
k this deck
37
True or False Much of the emphasis in TQM is on understanding and reducing variation within the process through which the product is produced,and samples of output are used in reaching inferences about the stability of the process.
Unlock Deck
Unlock for access to all 132 flashcards in this deck.
Unlock Deck
k this deck
38
A company maintains a minimum of inventory of parts to keep its production process going.If there is any interruption in the delivery of quality parts,production stops until quality is restored.This company is using:
A) competitive benchmarking.
B) acceptance sampling.
C) just-in-time manufacturing.
D) random variation.
E) a quality circle.
A) competitive benchmarking.
B) acceptance sampling.
C) just-in-time manufacturing.
D) random variation.
E) a quality circle.
Unlock Deck
Unlock for access to all 132 flashcards in this deck.
Unlock Deck
k this deck
39
Perry Company,a variety store,sends a team of five executives to Wal-Mart headquarters in Bentonville,Arkansas,to observe the distribution and logistics practices so that Perry Company can improve in these areas.This firm is engaging in:
A) worker training.
B) statistical process control.
C) a quality circle.
D) competitive benchmarking.
E) acceptance sampling.
A) worker training.
B) statistical process control.
C) a quality circle.
D) competitive benchmarking.
E) acceptance sampling.
Unlock Deck
Unlock for access to all 132 flashcards in this deck.
Unlock Deck
k this deck
40
True or False A popular and important tool for applying TQM is statistical process control,where sampled products are used in making inferences about the process from which they came.
Unlock Deck
Unlock for access to all 132 flashcards in this deck.
Unlock Deck
k this deck
41
Forty samples of size 1,000 were drawn from a manufacturing process and the number of defectives in each sample was counted.The mean sample proportion was 0.05.The centerline for the p chart is:
A) 0.05.
B) 50.0.
C) 2.00.
D) 25.0.
A) 0.05.
B) 50.0.
C) 2.00.
D) 25.0.
Unlock Deck
Unlock for access to all 132 flashcards in this deck.
Unlock Deck
k this deck
42
____________________ is a graphical procedure to make inferences about the process from which a sample was taken.
Unlock Deck
Unlock for access to all 132 flashcards in this deck.
Unlock Deck
k this deck
43
For control chart,the lower and upper control limits are usually set at:
A) five standard deviations from the centerline.
B) four standard deviations from the centerline.
C) three standard deviations from the centerline.
D) two standard deviations from the centerline.
E) one standard deviation from the centerline.
A) five standard deviations from the centerline.
B) four standard deviations from the centerline.
C) three standard deviations from the centerline.
D) two standard deviations from the centerline.
E) one standard deviation from the centerline.
Unlock Deck
Unlock for access to all 132 flashcards in this deck.
Unlock Deck
k this deck
44
Thirty samples of size 1200 were drawn from a manufacturing process and the number of defectives in each sample was counted.The mean sample proportion was 0.04.The upper control limit for the 3-sigma p chart is:
A) 0.0170.
B) 0.0570.
C) 0.1518.
D) 0.0230.
A) 0.0170.
B) 0.0570.
C) 0.1518.
D) 0.0230.
Unlock Deck
Unlock for access to all 132 flashcards in this deck.
Unlock Deck
k this deck
45
The four letters in W.Edwards Deming's PDCA cycle stand for ____________________.
Unlock Deck
Unlock for access to all 132 flashcards in this deck.
Unlock Deck
k this deck
46
Which of the following are among the statistical tools discussed in your text and used in applying TQM?
A) The process flow chart
B) The cause-and-effect diagram
C) The Pareto diagram
D) The Taguchi view of quality loss
E) All of these
A) The process flow chart
B) The cause-and-effect diagram
C) The Pareto diagram
D) The Taguchi view of quality loss
E) All of these
Unlock Deck
Unlock for access to all 132 flashcards in this deck.
Unlock Deck
k this deck
47
A 3-sigma mean chart for a normally distributed random variable shows that one mean lies out of the control limits.What is the probability that this observation is a result of random chance?
Unlock Deck
Unlock for access to all 132 flashcards in this deck.
Unlock Deck
k this deck
48
Ground coffee empties into a chute containing a roll of plastic,which forms a sealed bag of coffee.The weight on the coffee bag states the weight is 6 ounces.From every ten bags filled,four are randomly sampled and weighed to see if the mean is correct (the process in control).The standard deviation of the filling process is 0.05 ounces.Compute the 3-sigma lower control limit for the mean chart.
Unlock Deck
Unlock for access to all 132 flashcards in this deck.
Unlock Deck
k this deck
49
____________________ involves inspection of a sample of products after an entire production run or shipment lot has been produced.
Unlock Deck
Unlock for access to all 132 flashcards in this deck.
Unlock Deck
k this deck
50
Control charts that are used to monitor a process whose results are categorized as either defective or non-defective are called:
A) control charts for attributes.
B) control charts for variables.
C) control charts for normality.
D) control charts for out of luck.
E) None of these.
A) control charts for attributes.
B) control charts for variables.
C) control charts for normality.
D) control charts for out of luck.
E) None of these.
Unlock Deck
Unlock for access to all 132 flashcards in this deck.
Unlock Deck
k this deck
51
Ground coffee empties into a chute containing a roll of plastic,which forms a sealed bag of coffee.From every ten bags filled,four are randomly sampled and weighed to see if the mean is correct (the process in control).The average mean for twenty samples of four equals 6.01 ounces.The average range of the twenty samples is 0.08 ounces.What will be the 3-sigma lower control limit for the mean chart?
Unlock Deck
Unlock for access to all 132 flashcards in this deck.
Unlock Deck
k this deck
52
Costs that occur as the result of poor quality are also known as ____________________.
Unlock Deck
Unlock for access to all 132 flashcards in this deck.
Unlock Deck
k this deck
53
Fifty samples of size 600 were drawn from a manufacturing process and the number of defectives in each sample was counted.The mean sample proportion was 0.025.The lower control limit for the 3-sigma p chart is:
A) 0.1561.
B) 0.0059.
C) 0.0064.
D) 0.0191.
A) 0.1561.
B) 0.0059.
C) 0.0064.
D) 0.0191.
Unlock Deck
Unlock for access to all 132 flashcards in this deck.
Unlock Deck
k this deck
54
When a process that is governed by a Six Sigma approach to quality improvement is found to be in statistical control,the expected number of defects per million products or opportunities is
A) 1.2.
B) 1.5.
C) 2.0.
D) 3.4.
E) 6.0.
A) 1.2.
B) 1.5.
C) 2.0.
D) 3.4.
E) 6.0.
Unlock Deck
Unlock for access to all 132 flashcards in this deck.
Unlock Deck
k this deck
55
Costs of preventing poor quality are also known as ____________________.
Unlock Deck
Unlock for access to all 132 flashcards in this deck.
Unlock Deck
k this deck
56
When a given process is operating properly,the percentage of defectives is 10%.For a 3-sigma p-chart in which the upper and lower control limits are 4 percentage points apart,how large will each sample have to be?
Unlock Deck
Unlock for access to all 132 flashcards in this deck.
Unlock Deck
k this deck
57
A chart for a normally distributed random variable shows that one sample mean is outside the control chart limits.The probability that this happened by chance is:
A) 0.9554.
B) 0.5000.
C) 0.9974.
D) 0.0300
E) 0.0026
A) 0.9554.
B) 0.5000.
C) 0.9974.
D) 0.0300
E) 0.0026
Unlock Deck
Unlock for access to all 132 flashcards in this deck.
Unlock Deck
k this deck
58
The visual display of effects and their possible causes as a method of problem solving is associated with a:
A) cause and effect diagram.
B) process flow chart.
C) check sheet.
D) Taguchi method.
E) Pareto diagram.
A) cause and effect diagram.
B) process flow chart.
C) check sheet.
D) Taguchi method.
E) Pareto diagram.
Unlock Deck
Unlock for access to all 132 flashcards in this deck.
Unlock Deck
k this deck
59
Which of the following statements are not true?
A) Both Minitab and Excel (with the Data Analysis Plus add-in)provide a complete battery of tests regarding the state of control of the process.
B) Minitab automatically does all available diagnostic tests regarding the state of control of the process,but with Excel we must select "Test" option and specify "Select all tests".
C) Self-diagnosis regarding the state of control of the process with both Excel and Minitab takes the form of looking for and reporting any of 8 conditions and patterns.
D) All of these statements are true.
E) All of these statements are not true.
Unlock Deck
Unlock for access to all 132 flashcards in this deck.
Unlock Deck
k this deck
60
The "fraction-defective" control chart is an alternative term for the:
A) c-chart.
B) chart.
C) p-chart.
D) R-chart.
A) c-chart.
B) chart.
C) p-chart.
D) R-chart.
Unlock Deck
Unlock for access to all 132 flashcards in this deck.
Unlock Deck
k this deck
61
NARRBEGIN: Bottles
A bottle filling machine fills bottles with 16 oz of soda.Each hour,3 bottles are weighed on a precision scale to determine if the process is under control.The following data has been collected from the last 4 hours.Each value in the table represents the weight of an individual bottle.
Assuming this data was collected when the process was operating satisfactorily,construct 3-sigma limits for the mean chart.
Unlock Deck
Unlock for access to all 132 flashcards in this deck.
Unlock Deck
k this deck
62
An approach to quality improvement that involves studying,and attempting to emulate,the strategies and practices of organizations already known to generate world-class products and service is known as ____________________.
Unlock Deck
Unlock for access to all 132 flashcards in this deck.
Unlock Deck
k this deck
63
NARRBEGIN: Bottles
A bottle filling machine fills bottles with 16 oz of soda.Each hour,3 bottles are weighed on a precision scale to determine if the process is under control.The following data has been collected from the last 4 hours.Each value in the table represents the weight of an individual bottle.
At 11:00 AM,the weights of the following three bottles were recorded: 16.0,16.7,15.2.According to this sample,is the process in control?
Unlock Deck
Unlock for access to all 132 flashcards in this deck.
Unlock Deck
k this deck
64
The Cattleman's Bar and Grille would like to use statistical process control to monitor the time that elapses between a customer's arrival and when the food is served.The manager has determined that the average time between customer arrival and service is 19.5 minutes with a standard deviation of 2.5 minutes.Each evening,the manager plans on selecting 4 tables at random and will measure the elapsed time.What would the 3-sigma control limits be for the X-bar chart?
Unlock Deck
Unlock for access to all 132 flashcards in this deck.
Unlock Deck
k this deck
65
A dispenser of yogurt fills cups with an average of 4 ounces with a standard deviation of 0.25 ounces.Determine the centerline,lower and upper control limits for a 3-sigma mean chart when sample size is 9 cups.
Centerline = ____________________
Lower value = ____________________
Upper value = ____________________
Centerline = ____________________
Lower value = ____________________
Upper value = ____________________
Unlock Deck
Unlock for access to all 132 flashcards in this deck.
Unlock Deck
k this deck
66
NARRBEGIN: Bottles
A bottle filling machine fills bottles with 16 oz of soda.Each hour,3 bottles are weighed on a precision scale to determine if the process is under control.The following data has been collected from the last 4 hours.Each value in the table represents the weight of an individual bottle.
Assuming this data was collected when the process was operating satisfactorily,construct 3-sigma limits for the range chart.
Unlock Deck
Unlock for access to all 132 flashcards in this deck.
Unlock Deck
k this deck
67
Based on an earlier model called the Shewhart cycle,the Plan-Do-Check-Act (PDCA)cycle was popularized in the 1950's by ____________________.
Unlock Deck
Unlock for access to all 132 flashcards in this deck.
Unlock Deck
k this deck
68
A bar chart describing the relative frequencies with which various kinds of defects or nonconformities have occurred is called ____________________.
Unlock Deck
Unlock for access to all 132 flashcards in this deck.
Unlock Deck
k this deck
69
Control charts may be constructed for either ____________________ (measurements)or ____________________ (counts).
Unlock Deck
Unlock for access to all 132 flashcards in this deck.
Unlock Deck
k this deck
70
Industry often refers to assignable variation as ____________________ variation.
Unlock Deck
Unlock for access to all 132 flashcards in this deck.
Unlock Deck
k this deck
71
The Statistical Process Control (SPC)Chart was developed by ___________________________________ during the 1920s.This is a graphical procedure for determining whether a production process is operating properly.
Unlock Deck
Unlock for access to all 132 flashcards in this deck.
Unlock Deck
k this deck
72
Applicable to attributes,the ____________________-chart shows the proportion of defects in successive samples,while the ____________________-chart reflects a count of the number of defects found in units of the output.
Unlock Deck
Unlock for access to all 132 flashcards in this deck.
Unlock Deck
k this deck
73
Each sample involves a 9 square foot piece of carpet.The number of flaws found in a piece would be entered on a(n)____________________ chart.
Unlock Deck
Unlock for access to all 132 flashcards in this deck.
Unlock Deck
k this deck
74
The idea of total quality management in a word from the Japanese is "Kaizen" or improvement.In his 1986 book,Kaizen,author ____________________ describes the concept that Kaizen represents.
Unlock Deck
Unlock for access to all 132 flashcards in this deck.
Unlock Deck
k this deck
75
Organizations seeking to improve the quality of their goods and services are increasingly adopting the principles and practices of ________________________________________.
Unlock Deck
Unlock for access to all 132 flashcards in this deck.
Unlock Deck
k this deck
76
Use the following data to prepare the upper and lower control limits for a mean chart.Each sample contains 3 values. Compute the lower and upper control limits.
Lower value = ____________________
Upper value = ____________________
Compute the lower and upper control limits.Lower value = ____________________
Upper value = ____________________
Unlock Deck
Unlock for access to all 132 flashcards in this deck.
Unlock Deck
k this deck
77
The quality improvement program that,if properly implemented,is expected to experience only 3.4 defects per million products or opportunities is known as ____________________.
Unlock Deck
Unlock for access to all 132 flashcards in this deck.
Unlock Deck
k this deck
78
The two sources of process variation are ____________________ (common-course)variation and ____________________ (special-cause)variation.
Unlock Deck
Unlock for access to all 132 flashcards in this deck.
Unlock Deck
k this deck
79
The practices of TQM are closely related to the ____________________ philosophy of continuing improvement and include guidelines such as Deming's 14 points,quality audits,competitive benchmarking,just-in-time manufacturing,and worker empowerment.
Unlock Deck
Unlock for access to all 132 flashcards in this deck.
Unlock Deck
k this deck
80
The cause-and-effect diagram,developed by Kaoru Ishikawa,assists problem solving by visually depicting effects and their possible causes.Because of its appearance,it is sometimes called a ____________________.
Unlock Deck
Unlock for access to all 132 flashcards in this deck.
Unlock Deck
k this deck
Unlock Deck
Unlock for access to all 132 flashcards in this deck.


