Exam 20: Total Quality Management
Exam 1: A Preview of Business Statistics55 Questions
Exam 2: Visual Description of Data67 Questions
Exam 3: Statistical Description of Data146 Questions
Exam 4: Data Collection and Sampling Methods104 Questions
Exam 5: Probability: Review of Basic Concepts188 Questions
Exam 6: Discrete Probability Distributions140 Questions
Exam 7: Continuous Probability Distributions160 Questions
Exam 8: Sampling Distributions108 Questions
Exam 9: Estimation From Sample Data150 Questions
Exam 10: Hypothesis Tests Involving a Sample Mean or Proportion170 Questions
Exam 11: Hypothesis Tests Involving Two Sample Means149 Questions
Exam 12: Analysis of Variance Tests173 Questions
Exam 13: Chi-Square Applications134 Questions
Exam 14: Nonparametric Methods139 Questions
Exam 15: Simple Linear Regression and Correlation145 Questions
Exam 16: Multiple Regression and Correlation98 Questions
Exam 17: Model Building83 Questions
Exam 18: Models for Time Series and Forecasting127 Questions
Exam 19: Decision Theory82 Questions
Exam 20: Total Quality Management132 Questions
Select questions type
Variations in process output that are caused by events that in general cannot be eliminated without changing the process are:
Free
(Multiple Choice)
4.8/5  (38)
(38)
Correct Answer: Verified
B
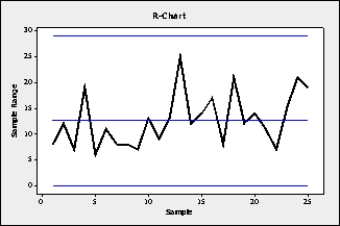
Twenty-five samples of size 4 were drawn from a production process. For each sample, the mean and range were computed as shown below.
Sample 1 2 3 4 5 6 7 8 9 10 11 12 13 21 24 20 18 20 21 23 25 15 20 25 21 4 8 12 7 19 6 11 8 8 7 13 9 13 25 Sample 14 15 16 17 18 19 20 21 22 23 24 25 28 14 22 24 26 19 14 28 17 26 29 15 12 14 17 8 21 12 14 11 7 15 21 19
-Draw the R chart on a control chart
Free
(Essay)
4.8/5 (43)
Correct Answer:Verified
Based on an earlier model called the Shewhart cycle,the Plan-Do-Check-Act (PDCA)cycle was popularized in the 1950's by ____________________.
Free
(Short Answer)
4.7/5 (32)
Correct Answer:Verified
W.Edwards Deming
For control chart,the lower and upper control limits are usually set at:
(Multiple Choice)
4.8/5 (32)
According to Greg Brue,author of Six Sigma for Managers,Six Sigma has a strong profitability and project/problem orientation,and involves five phases.List these phases.
(Essay)
4.9/5 (40)
Forty samples of size 1,000 were drawn from a manufacturing process and the number of defectives in each sample was counted.The mean sample proportion was 0.05.The centerline for the p chart is:
(Multiple Choice)
5.0/5 (33)
Which of the following are among the statistical tools discussed in your text and used in applying TQM?
(Multiple Choice)
4.8/5 (41)
Differentiate between statistical process control and acceptance sampling.
(Essay)
4.7/5 (32)
The two sources of process variation are ____________________ (common-course)variation and ____________________ (special-cause)variation.
(Short Answer)
4.8/5 (30)
What is the difference between total quality management and the traditional approach to quality management?
(Essay)
4.8/5 (42)
When the purpose of sampling is to detect when a process becomes too variable,the chart of choice will be a c-chart.
(True/False)
4.8/5 (29)
What is a "cause-and-effect diagram",and what role can it play in total quality management?
(Essay)
4.9/5 (41)
What assumptions are made in the mean chart about the distribution of individual measurements for the process that is being monitored?
(Essay)
4.9/5 (35)
Statistical process control and acceptance sampling both rely on a sampling of products to make inferences.In what important way do the two types of inferences differ?
(Essay)
4.8/5 (38)
Each sample involves a 9 square foot piece of carpet.The number of flaws found in a piece would be entered on a(n)____________________ chart.
(Short Answer)
4.9/5 (30)
In a 3-sigma mean control chart for a process that is in control,what is the probability that a given sample mean will fall outside the control limits as the result of random variation alone?
(Essay)
4.9/5 (30)
Random variation occurs due to identifiable causes that have changed the process.
(True/False)
4.8/5 (29)
The practices of TQM are closely related to the ____________________ philosophy of continuing improvement and include guidelines such as Deming's 14 points,quality audits,competitive benchmarking,just-in-time manufacturing,and worker empowerment.
(Short Answer)
5.0/5 (30)
What is the Deming PDCA cycle and how is it applicable to total quality management?
(Essay)
4.9/5 (40)
Which of the following relates to costs of non-conformance?
(Multiple Choice)
4.8/5 (37)
Filters
- Essay(0)
- Multiple Choice(0)
- Short Answer(0)
- True False(0)
- Matching(0)