Deck 6: Elasticity: Demand and Supply
Full screen (f)
Question
Figure 5.3. The figure shows the wage rate and the quantity of labor supplied in an unskilled labor market. 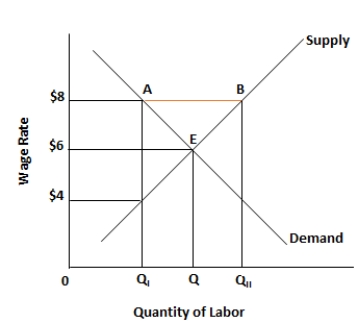
If a product has an elastic demand, it means that:
A)consumers are relatively sensitive to a change in the price of the product.
B)consumers are relatively insensitive to a change in the quantity demanded of the product.
C)consumers are relatively insensitive to a change in the price of the product.
D)producers are relatively insensitive to a change in the price of the product.
E)producers are relatively sensitive to a change in the quantity demanded of the product.
Question
Figure 5.3. The figure shows the wage rate and the quantity of labor supplied in an unskilled labor market.
If the percentage change in the quantity demanded of a good is greater than the percentage change in the price of the good, then the demand for the good is _____.
A)inelastic
B)relatively elastic
C)unit-elastic
D)perfectly inelastic
E)income elastic
If the percentage change in the quantity demanded of a good is greater than the percentage change in the price of the good, then the demand for the good is _____.
A)inelastic
B)relatively elastic
C)unit-elastic
D)perfectly inelastic
E)income elastic
Question
Figure 5.3. The figure shows the wage rate and the quantity of labor supplied in an unskilled labor market.
What would be the consequence of a 10 percent decrease in the price of a good for which price elasticity of demand is 5?
A)A 50 percent decrease in the quantity demanded
B)A 5 percent increase in the quantity demanded
C)A 50 percent increase in the quantity demanded
D)A decrease in the quantity demanded by 0.2 units
E)An increase in the quantity demanded by 0.2 units
Question
Figure 5.3. The figure shows the wage rate and the quantity of labor supplied in an unskilled labor market.
If a 50 percent increase in the price of pizza results in a 25 percent decrease in the quantity demanded of pizza, then the price elasticity of demand for pizza:
A)is equal to 0.5 and demand for pizza is inelastic.
B)is equal to 0.5 and demand for pizza is elastic.
C)is equal to 2 and demand for pizza is elastic.
D)is equal to 2 and demand for pizza is inelastic.
E)cannot be determined from the information provided.
Question
The figure given below shows the demand curves for five products: A, B, C, D, and E.Figure 6.1
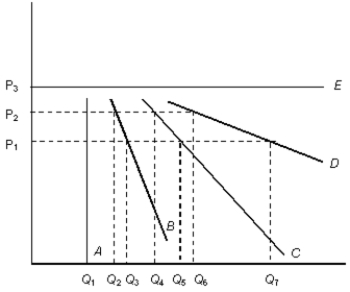
Refer to Figure 6.1. Which of the following is true of the demand curve for A?
A)Consumers purchase any quantity of A regardless of the price.
B)There is no change in the quantity demanded of A as the price changes.
C)A small price change will cause consumers to change their consumption by a much larger quantity.
D)The smallest price increase will cause consumers to switch to the producer with a lower price.
E)The price elasticity of demand for A is equal to 1.
Question
The figure given below shows the demand curves for five products: A, B, C, D, and E.Figure 6.1
Refer to Figure 6.1. The value of the coefficient of price elasticity of demand for E is:
A)equal to infinity.
B)equal to 1.
C)equal to zero.
D)less than 1.
E)greater than zero but less than one.
Refer to Figure 6.1. The value of the coefficient of price elasticity of demand for E is:
A)equal to infinity.
B)equal to 1.
C)equal to zero.
D)less than 1.
E)greater than zero but less than one.
Question
The figure given below shows the demand curves for five products: A, B, C, D, and E.Figure 6.1
Refer to Figure 6.1. The demand curve B is:
A)more elastic compared to demand curve E.
B)less elastic compared to demand curve C.
C)perfectly elastic.
D)more elastic compared to demand curve D.
E)an example of a unit-elastic demand curve.
Refer to Figure 6.1. The demand curve B is:
A)more elastic compared to demand curve E.
B)less elastic compared to demand curve C.
C)perfectly elastic.
D)more elastic compared to demand curve D.
E)an example of a unit-elastic demand curve.
Question
Figure 5.3. The figure shows the wage rate and the quantity of labor supplied in an unskilled labor market.
When the manager of a local movie theater raises the price of movie tickets from $7.50 to $8.50, his total revenue falls. This means that:
A)the demand for movie tickets is highly elastic.
B)the supply of movie tickets is perfectly elastic.
C)the supply of movie tickets is unit-elastic.
D)the demand for movie tickets is inelastic.
E)the supply of movie tickets is inelastic.
Question
Figure 5.3. The figure shows the wage rate and the quantity of labor supplied in an unskilled labor market.
When the elasticity of demand for a particular good is between zero and -1, _____.
A)demand is elastic
B)demand is inelastic
C)demand is unit-elastic
D)the good is an inferior good
E)the good is a normal good
When the elasticity of demand for a particular good is between zero and -1, _____.
A)demand is elastic
B)demand is inelastic
C)demand is unit-elastic
D)the good is an inferior good
E)the good is a normal good
Question
Figure 5.3. The figure shows the wage rate and the quantity of labor supplied in an unskilled labor market.
If the price elasticity of demand for a product is equal to 4, a 1 percent increase in price of the product will cause the quantity demanded to _____ by _____ percent.
A)increase; 0.25
B)decrease; 0.25
C)increase; 4
D)decrease; 25
E)decrease; 4
If the price elasticity of demand for a product is equal to 4, a 1 percent increase in price of the product will cause the quantity demanded to _____ by _____ percent.
A)increase; 0.25
B)decrease; 0.25
C)increase; 4
D)decrease; 25
E)decrease; 4
Question
The figure given below shows the demand curves for five products: A, B, C, D, and E.Figure 6.1
Refer to Figure 6.1. Which of the following is true when prices increase from P1 to P2?
A)The change in quantity demanded is larger for C than D, thus the demand for D is relatively less elastic than it is for C.
B)The change in the quantity demanded following the price increase is the largest for C.
C)The change in the quantity demanded following the price increase is the least for D.
D)The demand for E is perfectly inelastic.
E)The change in quantity demanded is larger for C than A, thus the demand for C is more elastic than it is for A.
Question
Figure 5.3. The figure shows the wage rate and the quantity of labor supplied in an unskilled labor market.
The price elasticity of demand for a product is a measure of the:
A)extent of competition in the market for the product.
B)change in the quantity purchased of the product relative to a change in a consumer's income.
C)change in the quantity demanded of the product due to changes in factors other than price.
D)degree of consumer responsiveness to changes in the price of the product.
E)percentage change in the prices of two related products.
Question
Figure 5.3. The figure shows the wage rate and the quantity of labor supplied in an unskilled labor market.
The less responsive consumers are to a change in the price of a product, _____.
A)the more price-elastic is the supply curve
B)the more income-inelastic is the demand curve
C)the more price-inelastic is the demand curve
D)the more income-elastic is the supply curve
E)the more price-elastic is the demand curve
Question
Figure 5.3. The figure shows the wage rate and the quantity of labor supplied in an unskilled labor market.
Assume that the price elasticity of demand for a commodity is 0.20. A 10 percent increase in the price of the commodity will be followed by a:
A)20 percent increase in the quantity demanded.
B)2 percent decrease in the quantity demanded.
C)20 percent decrease in the quantity demanded.
D)0.2 percent decrease in the quantity demanded.
E)2 percent increase in the quantity demanded.
Question
Figure 5.3. The figure shows the wage rate and the quantity of labor supplied in an unskilled labor market.
Which of the following is true of the price elasticity of demand of a product?
A)It measures the responsiveness of quantity demanded or quantity supplied to a change in one of the determinants of demand and/or supply.
B)It is calculated as the percentage change in the quantity demanded of the product divided by the percentage change in the price of the product.
C)It is calculated as the percentage change in the demand for the product divided by the percentage change in income of a consumer, everything else held constant.
D)It measures the responsiveness of demand to a change in the quantity supplied.
E)It is calculated as the percentage change in the quantity demanded of the product divided by the percentage change in the price of a related product, everything else held constant.
Question
Figure 5.3. The figure shows the wage rate and the quantity of labor supplied in an unskilled labor market.
If a 10 percent increase in the price of gasoline results in a 2 percent decrease in the quantity demanded of gasoline, then the elasticity of demand for gasoline is:
A)equal to 0.2 and demand is inelastic.
B)equal to 0.2 and demand is elastic.
C)equal to 0.02 and demand is elastic.
D)equal to 0.5 and demand is inelastic.
E)equal to 0.5 and the demand is elastic.
Question
Figure 5.3. The figure shows the wage rate and the quantity of labor supplied in an unskilled labor market.
Suppose 50 loaves of bread are demanded at a particular price. If that price rises by 2 percent, the quantity demanded decreases to 49.5 loaves of bread. This implies that the:
A)demand is elastic.
B)demand is unit-elastic.
C)price elasticity of demand is equal to 2.
D)demand is inelastic.
E)income elasticity of demand is equal to 0.5.
Question
Figure 5.3. The figure shows the wage rate and the quantity of labor supplied in an unskilled labor market.
If the demand for a product is unit-elastic, a 25 percent increase in its price will result in:
A)a 25 percent change in total revenue.
B)no change in quantity demanded.
C)a 1 percent increase in quantity demanded.
D)a 25 percent decrease in quantity demanded.
E)a 100 percent change in quantity demanded.
Question
Figure 5.3. The figure shows the wage rate and the quantity of labor supplied in an unskilled labor market.
Which of the following is explained by the price elasticity of demand for a product?
A)The effect of changes in price on the supply of the product
B)The effect of changes in quantity on the supply of the product
C)The effect of changes in quantity on the price of the product
D)The effect of changes in price on the quantity demanded of the product
E)The effect of changes in price on the quantity supplied of the product
Question
Figure 5.3. The figure shows the wage rate and the quantity of labor supplied in an unskilled labor market.
If a 1 percent change in the price of a good causes a 1 percent change in the quantity demanded of that good, then the demand is said to be:
A)perfectly elastic.
B)income elastic.
C)unit-elastic.
D)inelastic.
E)perfectly inelastic.
If a 1 percent change in the price of a good causes a 1 percent change in the quantity demanded of that good, then the demand is said to be:
A)perfectly elastic.
B)income elastic.
C)unit-elastic.
D)inelastic.
E)perfectly inelastic.
Question
The figure given below shows the demand curves for five products: A, B, C, D, and E.Figure 6.1
If the demand for corn is elastic, then:
A)there are not many substitutes for the consumption of corn.
B)the price elasticity of demand for corn is less than -1.
C)a decrease in price will reduce total revenue for corn producers.
D)an increase in price will increase total revenue for corn producers.
E)consumers will continue buying the same quantity even if price increases.
Question
The figure given below shows the demand curves for five products: A, B, C, D, and E.Figure 6.1
Which of the following is a determinant of price elasticity of demand?
A)Availability of substitute goods
B)Excess capacity
C)Scale of production
D)Inventories
E)Cost of production
Which of the following is a determinant of price elasticity of demand?
A)Availability of substitute goods
B)Excess capacity
C)Scale of production
D)Inventories
E)Cost of production
Question
The figure given below shows the demand curves for five products: A, B, C, D, and E.Figure 6.1
Demand for a good becomes more elastic as:
A)the number of substitutes available declines.
B)the time period under consideration becomes shorter.
C)a good makes up a larger percentage of a consumer's budget.
D)a good makes up a smaller percentage of a consumer's budget.
E)the producer has more time to respond to price changes.
Question
The figure given below shows the demand curves for five products: A, B, C, D, and E.Figure 6.1
A 0.5% increase in the price of a particular product causes the quantity demanded of the product to drop to zero. This means that the price elasticity of demand for the product is:
A)perfectly elastic.
B)unit-elastic.
C)perfectly inelastic.
D)moderately elastic.
E)moderately inelastic.
A 0.5% increase in the price of a particular product causes the quantity demanded of the product to drop to zero. This means that the price elasticity of demand for the product is:
A)perfectly elastic.
B)unit-elastic.
C)perfectly inelastic.
D)moderately elastic.
E)moderately inelastic.
Question
The figure given below shows the demand curves for five products: A, B, C, D, and E.Figure 6.1
Refer to Figure 6.1. The demand curve E is most likely to represent the demand for:
A)alcohol by an alcoholic.
B)a life-saving drug.
C)holiday travel packages.
D)a particular brand of breakfast cereal.
E)air conditioning during a hot summer.
Refer to Figure 6.1. The demand curve E is most likely to represent the demand for:
A)alcohol by an alcoholic.
B)a life-saving drug.
C)holiday travel packages.
D)a particular brand of breakfast cereal.
E)air conditioning during a hot summer.
Question
The figure given below shows the demand curves for five products: A, B, C, D, and E.Figure 6.1
Which of the following is true with respect to the price elasticity of demand?
A)The coefficient of price elasticity of demand will change with changes in the units of measurement (for instance, going from pounds to ounces).
B)Elasticity of demand is equal to the slope of the demand curve.
C)Elasticity measures the sensitivity of total expenditure to a change in price of a good.
D)Elasticity will tend to be greater for a relatively expensive product than for a cheaper one.
E)A coefficient of 1 means that the percentage change in total expenditure is equivalent to the percentage change in price.
Question
The figure given below shows the demand curves for five products: A, B, C, D, and E.Figure 6.1
Suppose the value of price elasticity of demand for goods manufactured by firms A, B, C, and D are 0, -0.8, -1, and -1.5 respectively. The demand for the good will be elastic for:
A)firms A, B, C, and D.
B)firms B, C, and D.
C)only firm A.
D)firms C and D only.
E)only firm D.
Suppose the value of price elasticity of demand for goods manufactured by firms A, B, C, and D are 0, -0.8, -1, and -1.5 respectively. The demand for the good will be elastic for:
A)firms A, B, C, and D.
B)firms B, C, and D.
C)only firm A.
D)firms C and D only.
E)only firm D.
Question
The figure given below shows the demand curves for five products: A, B, C, D, and E.Figure 6.1
If the demand for a good is perfectly inelastic, then:
A)the value of price elasticity of demand of the good is equal to 1.
B)the value of price elasticity of demand of the good is equal to -1.
C)the demand curve of the good is nonexistent.
D)consumers are very responsive to a change in the price of the good.
E)quantity demanded does not change when price of the good changes.
Question
The figure given below shows the demand curves for five products: A, B, C, D, and E.Figure 6.1
If a price increase from $20 to $40 causes quantity demanded to decrease from 100 units to 50 units, one can conclude that demand for the product is _____.
A)inelastic
B)elastic
C)perfectly inelastic
D)perfectly elastic
E)unit-elastic
If a price increase from $20 to $40 causes quantity demanded to decrease from 100 units to 50 units, one can conclude that demand for the product is _____.
A)inelastic
B)elastic
C)perfectly inelastic
D)perfectly elastic
E)unit-elastic
Question
The figure given below shows the demand curves for five products: A, B, C, D, and E.Figure 6.1
If = -1.50 for a good, and price of the good decreases by 20 percent, then:
A)quantity demanded will decrease by 30 percent.
B)quantity demanded will increase by 30 percent.
C)total revenue will remain unchanged.
D)total revenue will decrease.
E)quantity demanded will increase by 3 percent.
If = -1.50 for a good, and price of the good decreases by 20 percent, then:
A)quantity demanded will decrease by 30 percent.
B)quantity demanded will increase by 30 percent.
C)total revenue will remain unchanged.
D)total revenue will decrease.
E)quantity demanded will increase by 3 percent.
Question
The figure given below shows the demand curves for five products: A, B, C, D, and E.Figure 6.1
If a 15 percent reduction in the price of electricity per kilowatt hour has no impact on the total electricity consumption, we can infer that in the short run, the demand for electricity is _____.
A)perfectly inelastic
B)perfectly elastic
C)unit-elastic
D)relatively inelastic
E)relatively elastic
If a 15 percent reduction in the price of electricity per kilowatt hour has no impact on the total electricity consumption, we can infer that in the short run, the demand for electricity is _____.
A)perfectly inelastic
B)perfectly elastic
C)unit-elastic
D)relatively inelastic
E)relatively elastic
Question
The figure given below shows the demand curves for five products: A, B, C, D, and E.Figure 6.1
Consider a medical breakthrough that led to the discovery of a simple microchip, which when inserted inside the human ear could prevent certain chronic diseases. The price elasticity of demand for that microchip would most likely be _____.
A)highly elastic
B)highly inelastic
C)undefined
D)negative only for high prices
E)positive only for high prices
Question
The figure given below shows the demand curves for five products: A, B, C, D, and E.Figure 6.1
Assume that the demand curve for a certain good is a vertical line. This vertical demand curve illustrates the idea that:
A)consumers are unwilling to pay more than a certain price for the good.
B)the good is a complement to another good.
C)consumers are unwilling to pay less than a certain price for the good.
D)there are many substitutes for this good.
E)people will not change the quantity demanded of the good when its price is changed.
Question
The figure given below shows the demand curves for five products: A, B, C, D, and E.Figure 6.1
If the demand for cream cheese produced by a dairy is perfectly elastic, then:
A)the demand curve will be vertical.
B)the demand curve will be horizontal.
C)the demand curve will be upward sloping.
D)the demand curve will be downward sloping.
E)the demand curve will initially slope upward and then slope upward.
Question
The figure given below shows the demand curves for five products: A, B, C, D, and E.Figure 6.1
Which of the following would most likely be highly price-elastic?
A)The demand for milk by a household
B)The demand for insulin by a diabetes patient
C)The demand for water
D)The demand for new houses
E)The demand for coal over a period of one month
Which of the following would most likely be highly price-elastic?
A)The demand for milk by a household
B)The demand for insulin by a diabetes patient
C)The demand for water
D)The demand for new houses
E)The demand for coal over a period of one month
Question
The figure given below shows the demand curves for five products: A, B, C, D, and E.Figure 6.1
In the opinion of many consumers, there are few, if any, substitutes for the popular search engine Google. If Google were to charge consumers for its services, it would face:
A)a relatively inelastic demand curve.
B)a relatively elastic demand curve.
C)a negative income elasticity of demand.
D)a positive cross elasticity of demand.
E)a perfectly elastic demand curve.
Question
The figure given below shows the demand curves for five products: A, B, C, D, and E.Figure 6.1
An economic survey observed that a 20 percent cut in the price of a certain line of women's clothing, almost doubled the quantity demanded of the clothing. This led economists to conclude that the demand for this line of clothing is _____.
A)highly elastic
B)highly inelastic
C)unit-elastic
D)perfectly elastic
E)perfectly inelastic
Question
The figure given below shows the demand curves for five products: A, B, C, D, and E.Figure 6.1
A horizontal demand curve shows that demand for a good is _____.
A)perfectly inelastic
B)moderately inelastic
C)unit-elastic
D)moderately elastic
E)perfectly elastic
A horizontal demand curve shows that demand for a good is _____.
A)perfectly inelastic
B)moderately inelastic
C)unit-elastic
D)moderately elastic
E)perfectly elastic
Question
The figure given below shows the demand curves for five products: A, B, C, D, and E.Figure 6.1
Which of the following is an example of inelastic demand?
A)A 10 percent increase in the price of milk leads to a 20 percent decrease in the quantity demanded of milk.
B)A 10 percent increase in the price of milk leads to a 10 percent decrease in the quantity demanded of milk.
C)A 10 percent increase in the price of milk leads to a 5 percent decrease in the quantity demanded of milk.
D)A 10 percent increase in the price of milk leads to a 10 percent increase in the quantity demanded of milk.
E)A 10 percent increase in the price of milk leads to a 5 percent increase in the quantity demanded of milk.
Question
The figure given below shows the demand curves for five products: A, B, C, D, and E.Figure 6.1
In Figure 6.1, which demand curve is most likely to represent the demand for insulin by diabetics?
A)A
B)B
C)C
D)D
E)E
In Figure 6.1, which demand curve is most likely to represent the demand for insulin by diabetics?
A)A
B)B
C)C
D)D
E)E
Question
The figure given below shows the demand curves for five products: A, B, C, D, and E.Figure 6.1
Last year, Alice bought 40 CDs when her income was $20,000. This year, her income increased to $25,000, and she purchased 48 CDs. We can conclude that:
A)Alice's price elasticity of demand for CDs is equal to 1.
B)Alice's demand for CDs is price-inelastic.
C)Alice's demand for CDs is price-elastic.
D)the income elasticity of demand for CDs is negative.
E)CDs are a normal good.
Question
The figure given below shows the demand curves for five products: A, B, C, D, and E.Figure 6.1
Suppose the manager of a store wants to know whether the product of the store across the street is a substitute for her product. In other words, she would need to know if the _____ for the products is positive.
A)cross-price elasticity of demand
B)price elasticity of demand
C)income elasticity of demand
D)price elasticity of supply
E)cross-price elasticity of supply
Question
The figure given below shows the demand curves for five products: A, B, C, D, and E.Figure 6.1
Ceteris paribus, a 10 percent increase in income results in a 50 percent decline in the quantity of potatoes purchased. This implies potatoes can be categorized as _____.
A)complements
B)substitutes
C)inferior goods
D)normal goods
E)luxury goods
Ceteris paribus, a 10 percent increase in income results in a 50 percent decline in the quantity of potatoes purchased. This implies potatoes can be categorized as _____.
A)complements
B)substitutes
C)inferior goods
D)normal goods
E)luxury goods
Question
The figure given below shows the demand curves for five products: A, B, C, D, and E.Figure 6.1
When the cross-price elasticity of demand for two goods is a positive number, one can correctly conclude that:
A)the goods are normal goods.
B)the goods are inferior goods.
C)the goods are substitutes.
D)the goods are complements.
E)total revenue will increase when the price increases.
When the cross-price elasticity of demand for two goods is a positive number, one can correctly conclude that:
A)the goods are normal goods.
B)the goods are inferior goods.
C)the goods are substitutes.
D)the goods are complements.
E)total revenue will increase when the price increases.
Question
The figure given below shows the demand curves for five products: A, B, C, D, and E.Figure 6.1
When the price of hot dogs at the supermarket increases, the quantity demanded of hot dog buns declines. This situation describes:
A)the income elasticity of demand for hot dogs.
B)the income elasticity of demand for hot dog buns.
C)the price elasticity of supply for hot dogs.
D)the negative cross-price elasticity of demand for hot dogs and hot dog buns.
E)the positive cross-price elasticity of supply for hot dogs and hot dog buns.
Question
The figure given below shows the demand curves for five products: A, B, C, D, and E.Figure 6.1
The value of price elasticity of demand is more likely to be above 1 if:
A)consumers have a long time to adjust to a price change.
B)the product is a necessity.
C)demand is inelastic.
D)there are few close substitutes for the product.
E)total revenue declines in response to a price reduction.
The value of price elasticity of demand is more likely to be above 1 if:
A)consumers have a long time to adjust to a price change.
B)the product is a necessity.
C)demand is inelastic.
D)there are few close substitutes for the product.
E)total revenue declines in response to a price reduction.
Question
The figure given below shows the demand curves for five products: A, B, C, D, and E.Figure 6.1
Goods whose income elasticity of demand is greater than zero are _____.
A)inferior goods
B)normal goods
C)substitute goods
D)superior goods
E)public goods
Goods whose income elasticity of demand is greater than zero are _____.
A)inferior goods
B)normal goods
C)substitute goods
D)superior goods
E)public goods
Question
The figure given below shows the demand curves for five products: A, B, C, D, and E.Figure 6.1
If a product has an inelastic demand, then:
A)there is probably a long time period under consideration.
B)as price increases, total revenue to producers decreases.
C)an increase in the price will decrease total consumer expenditures.
D)there are probably many complements for the good.
E)there are probably few substitutes for the good.
Question
The figure given below shows the demand curves for five products: A, B, C, D, and E.Figure 6.1
As income levels rose moderately last year in the San Jose area, it was observed by local realtors that housing sales increased substantially. It is clear from this information that, everything else held constant, the income elasticity of demand for houses is _____.
A)negative and relatively low
B)negative and relatively high
C)positive and relatively low
D)positive and relatively high
E)neither positive nor negative
Question
The figure given below shows the demand curves for five products: A, B, C, D, and E.Figure 6.1
Since an expensive sports car constitutes a greater portion of a consumer's budget than does laundry soap, the price elasticity of demand for an expensive sports car is _____.
A)relatively less elastic
B)unit-elastic
C)perfectly inelastic
D)relatively more elastic
E)perfectly elastic
Since an expensive sports car constitutes a greater portion of a consumer's budget than does laundry soap, the price elasticity of demand for an expensive sports car is _____.
A)relatively less elastic
B)unit-elastic
C)perfectly inelastic
D)relatively more elastic
E)perfectly elastic
Question
The figure given below shows the demand curves for five products: A, B, C, D, and E.Figure 6.1
_____ measures the percentage change in quantity demanded of a good caused by a given percentage change in the price of a related good.
A)Income elasticity of demand
B)Cross-price elasticity of demand
C)Advertising elasticity of demand
D)Price elasticity of demand
E)Point elasticity
_____ measures the percentage change in quantity demanded of a good caused by a given percentage change in the price of a related good.
A)Income elasticity of demand
B)Cross-price elasticity of demand
C)Advertising elasticity of demand
D)Price elasticity of demand
E)Point elasticity
Question
The figure given below shows the demand curves for five products: A, B, C, D, and E.Figure 6.1
An inferior good or service is any good or service for which:
A)an increase in price causes an increase in the quantity demanded.
B)a decrease in price causes an increase in demand.
C)an increase in price causes a decrease in the quantity demanded.
D)an increase in the amount consumed causes a decrease in marginal utility.
E)an increase in income causes a decrease in demand.
Question
The figure given below shows the demand curves for five products: A, B, C, D, and E.Figure 6.1
Assume that due to unfavorable conditions in a prime honey-producing area, the price of honey increases by 50 percent. The quantity consumed of herbal tea declines immediately by 25 percent. Everything else held constant, the:
A)cross-price elasticity of demand for herbal tea and honey is negative, and therefore the two goods are substitutes.
B)cross-price elasticity of demand for herbal tea and honey is negative, and therefore the two goods are complements.
C)cross-price elasticity of demand for herbal tea and honey is positive, and therefore the two goods are substitutes.
D)cross-price elasticity of demand for herbal tea and honey is positive, and therefore the two goods are complements.
E)cross-price elasticity of demand cannot be determined from the information provided.
Question
The figure given below shows the demand curves for five products: A, B, C, D, and E.Figure 6.1
Income elasticity of demand is expected to be _____.
A)relatively high for necessities
B)positive for most products
C)relatively low for luxuries
D)negative for most products
E)zero for most products
Income elasticity of demand is expected to be _____.
A)relatively high for necessities
B)positive for most products
C)relatively low for luxuries
D)negative for most products
E)zero for most products
Question
The figure given below shows the demand curves for five products: A, B, C, D, and E.Figure 6.1
A fall in the average income of a consumer, say during a recession, is represented by:
A)an upward movement along the demand curve for a good consumed by the consumer.
B)a downward movement along the demand curve for a good consumed by the consumer.
C)a shift of the demand curve for a good consumed by the consumer.
D)a rotation of the demand curve for a good consumed by the consumer.
E)an inward shift of the demand curve for an inferior good consumed by the consumer.
Question
The figure given below shows the demand curves for five products: A, B, C, D, and E.Figure 6.1
Peanut butter and jelly are:
A)substitutes and have a positive cross-price elasticity of Demand.
B)complements and have a positive cross-price elasticity of demand.
C)substitutes and have a positive cross-price elasticity of demand.
D)complements and have a negative cross-price elasticity of demand.
E)inferior goods when the income elasticity of demand is positive.
Question
The figure given below shows the demand curves for five products: A, B, C, D, and E.Figure 6.1
If the demand for product R increases as the price of product S increases, then _____.
A)consumer preferences for S have increased
B)R and S are not related goods
C)R and S are substitutes
D)R and S are complements
E)R is an inferior good
If the demand for product R increases as the price of product S increases, then _____.
A)consumer preferences for S have increased
B)R and S are not related goods
C)R and S are substitutes
D)R and S are complements
E)R is an inferior good
Question
The figure given below shows the demand curves for five products: A, B, C, D, and E.Figure 6.1
When product A is a substitute for product B, the cross-price elasticity of demand for products A and B will be _____.
A)unity
B)negative
C)positive
D)decreasing
E)increasing
When product A is a substitute for product B, the cross-price elasticity of demand for products A and B will be _____.
A)unity
B)negative
C)positive
D)decreasing
E)increasing
Question
The figure given below shows the demand curves for five products: A, B, C, D, and E.Figure 6.1
As the price of movie tickets increases, which of the following is most likely to happen?
A)The demand for DVDs will increase.
B)The quantity of books demanded will decrease.
C)The number of Broadway tickets purchased will decrease.
D)The prices of popcorn and soda will increase.
E)The number of movies being produced will decrease.
Question
The figure given below shows the demand curves for five products: A, B, C, D, and E.Figure 6.1
Which of the following goods is likely to have an income elasticity of demand that is less than zero?
A)A luxury yacht
B)A beach house
C)A state-of-the-art cellular phone
D)A box of generic macaroni and cheese dinner
E)A dinner at a French restaurant
Which of the following goods is likely to have an income elasticity of demand that is less than zero?
A)A luxury yacht
B)A beach house
C)A state-of-the-art cellular phone
D)A box of generic macaroni and cheese dinner
E)A dinner at a French restaurant
Question
Question
Question
The table below shows the quantities of automobiles, margarine, and coffee purchased by Ted at different levels of income.Table 6.2
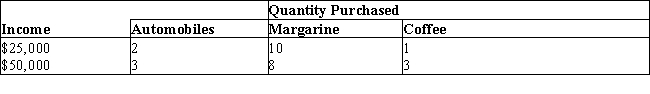
Based on the information given in Table 6.2, margarine is:
A)an inferior good.
B)a necessity.
C)a normal good.
D)a complementary good.
E)a luxury good.
Based on the information given in Table 6.2, margarine is:
A)an inferior good.
B)a necessity.
C)a normal good.
D)a complementary good.
E)a luxury good.
Question
The table given below reports the price and quantity demanded of a commodity.Table 6.1

According to Table 6.1, when the price increases from $5 to $6, the price elasticity of demand is _____.
A)0.25
B)1.0
C)1.3
D)1.8
E)1.67
According to Table 6.1, when the price increases from $5 to $6, the price elasticity of demand is _____.
A)0.25
B)1.0
C)1.3
D)1.8
E)1.67
Question
Question
The table below shows the quantities of automobiles, margarine, and coffee purchased by Ted at different levels of income.Table 6.2
Arc elasticity is calculated as _____.
A)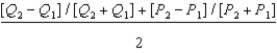
B)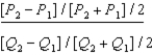
C)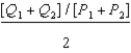
D)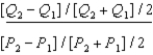
E)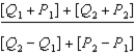
Arc elasticity is calculated as _____.
A)
B)
C)
D)
E)
Question
The table below shows the quantities of automobiles, margarine, and coffee purchased by Ted at different levels of income.Table 6.2
If 12 candy bars are demanded at $0.30 each and 4 candy bars are demanded at $0.50 each, what is the elasticity of demand over the price range from $0.30 to $0.50?
A)2
B)1.67
C)0.5
D)7.5
E)0.4
If 12 candy bars are demanded at $0.30 each and 4 candy bars are demanded at $0.50 each, what is the elasticity of demand over the price range from $0.30 to $0.50?
A)2
B)1.67
C)0.5
D)7.5
E)0.4
Question
The figure given below shows the demand curves for five products: A, B, C, D, and E.Figure 6.1
If the demand for beans tends to decline as incomes rise, everything else held constant, beans are _____.
A)luxury goods
B)normal goods
C)price sensitive
D)not price sensitive
E)inferior goods
If the demand for beans tends to decline as incomes rise, everything else held constant, beans are _____.
A)luxury goods
B)normal goods
C)price sensitive
D)not price sensitive
E)inferior goods
Question
The figure given below shows the demand curves for five products: A, B, C, D, and E.Figure 6.1
For a given product, income elasticity of demand relates the percentage change in:
A)quantity demanded to the percentage change in income.
B)quantity demanded to the absolute change in income.
C)income to the percentage change in price.
D)price to the absolute change in quantity demanded.
E)income to the percentage change in quantity available for sale.
Question
Question
The table below shows the quantities of automobiles, margarine, and coffee purchased by Ted at different levels of income.Table 6.2
Refer to Table 6.2. What is the income elasticity of demand for automobiles?
A)0.5
B)0.35
C)2
D)0.2
E)Zero
Refer to Table 6.2. What is the income elasticity of demand for automobiles?
A)0.5
B)0.35
C)2
D)0.2
E)Zero
Question
Question
The figure given below shows the demand curves for five products: A, B, C, D, and E.Figure 6.1
Price elasticity of demand measured over a range of prices and quantities along the demand curve is _____.
A)point elasticity
B)arc elasticity
C)income elasticity
D)cross elasticity
E)price elasticity
Price elasticity of demand measured over a range of prices and quantities along the demand curve is _____.
A)point elasticity
B)arc elasticity
C)income elasticity
D)cross elasticity
E)price elasticity
Question
The table below shows the quantities of automobiles, margarine, and coffee purchased by Ted at different levels of income.Table 6.2
Suppose the price of a product is reduced from $10 to $6 and the quantity demanded increases from 40 to 60 units. From this we can conclude that the price elasticity of demand over this price range is equal to _____.
A)1.2
B)1.25
C)0.80
D)0.20
E)0.5
Suppose the price of a product is reduced from $10 to $6 and the quantity demanded increases from 40 to 60 units. From this we can conclude that the price elasticity of demand over this price range is equal to _____.
A)1.2
B)1.25
C)0.80
D)0.20
E)0.5
Question
The figure given below shows the demand curves for five products: A, B, C, D, and E.Figure 6.1
Which of the following items is likely to have the highest positive income elasticity of demand?
A)Bread
B)Jewelry
C)Soap
D)A plumber's service
E)Table salt
Which of the following items is likely to have the highest positive income elasticity of demand?
A)Bread
B)Jewelry
C)Soap
D)A plumber's service
E)Table salt
Question
The figure given below shows the demand curves for five products: A, B, C, D, and E.Figure 6.1
When the income elasticity of demand for a good is negative, one can correctly conclude that:
A)the good is a normal good.
B)the good is an inferior good.
C)the good is a substitute.
D)the good is a complement.
E)total revenue will decrease when the price increases.
When the income elasticity of demand for a good is negative, one can correctly conclude that:
A)the good is a normal good.
B)the good is an inferior good.
C)the good is a substitute.
D)the good is a complement.
E)total revenue will decrease when the price increases.
Question
The figure given below shows the demand curves for five products: A, B, C, D, and E.Figure 6.1
The income elasticity of demand _____.
A)must be negative because of the law of diminishing marginal utility
B)could be positive, negative or zero, depending on the nature of the good
C)must be positive for all goods because consumers tend to buy more at higher incomes
D)is usually zero because "you can only have so much"
E)can never be zero
Question
Question
Question
The table below shows the quantities of automobiles, margarine, and coffee purchased by Ted at different levels of income.Table 6.2
Based on the information given in Table 6.2, coffee would be considered:
A)an inferior good.
B)a necessity.
C)a substitute good.
D)a complement good.
E)a luxury good.
Based on the information given in Table 6.2, coffee would be considered:
A)an inferior good.
B)a necessity.
C)a substitute good.
D)a complement good.
E)a luxury good.

Unlock Deck
Sign up to unlock the cards in this deck!
Unlock Deck
Unlock Deck
1/133
Play
Full screen (f)
Deck 6: Elasticity: Demand and Supply
1
Figure 5.3. The figure shows the wage rate and the quantity of labor supplied in an unskilled labor market.
If a product has an elastic demand, it means that:
A)consumers are relatively sensitive to a change in the price of the product.
B)consumers are relatively insensitive to a change in the quantity demanded of the product.
C)consumers are relatively insensitive to a change in the price of the product.
D)producers are relatively insensitive to a change in the price of the product.
E)producers are relatively sensitive to a change in the quantity demanded of the product.
consumers are relatively sensitive to a change in the price of the product.
2
Figure 5.3. The figure shows the wage rate and the quantity of labor supplied in an unskilled labor market.
If the percentage change in the quantity demanded of a good is greater than the percentage change in the price of the good, then the demand for the good is _____.
A)inelastic
B)relatively elastic
C)unit-elastic
D)perfectly inelastic
E)income elastic
If the percentage change in the quantity demanded of a good is greater than the percentage change in the price of the good, then the demand for the good is _____.
A)inelastic
B)relatively elastic
C)unit-elastic
D)perfectly inelastic
E)income elastic
relatively elastic
3
Figure 5.3. The figure shows the wage rate and the quantity of labor supplied in an unskilled labor market.
What would be the consequence of a 10 percent decrease in the price of a good for which price elasticity of demand is 5?
A)A 50 percent decrease in the quantity demanded
B)A 5 percent increase in the quantity demanded
C)A 50 percent increase in the quantity demanded
D)A decrease in the quantity demanded by 0.2 units
E)An increase in the quantity demanded by 0.2 units
A 50 percent increase in the quantity demanded
4
Figure 5.3. The figure shows the wage rate and the quantity of labor supplied in an unskilled labor market.
If a 50 percent increase in the price of pizza results in a 25 percent decrease in the quantity demanded of pizza, then the price elasticity of demand for pizza:
A)is equal to 0.5 and demand for pizza is inelastic.
B)is equal to 0.5 and demand for pizza is elastic.
C)is equal to 2 and demand for pizza is elastic.
D)is equal to 2 and demand for pizza is inelastic.
E)cannot be determined from the information provided.
Unlock Deck
Unlock for access to all 133 flashcards in this deck.
Unlock Deck
k this deck
5
The figure given below shows the demand curves for five products: A, B, C, D, and E.Figure 6.1
Refer to Figure 6.1. Which of the following is true of the demand curve for A?
A)Consumers purchase any quantity of A regardless of the price.
B)There is no change in the quantity demanded of A as the price changes.
C)A small price change will cause consumers to change their consumption by a much larger quantity.
D)The smallest price increase will cause consumers to switch to the producer with a lower price.
E)The price elasticity of demand for A is equal to 1.
Unlock Deck
Unlock for access to all 133 flashcards in this deck.
Unlock Deck
k this deck
6
The figure given below shows the demand curves for five products: A, B, C, D, and E.Figure 6.1
Refer to Figure 6.1. The value of the coefficient of price elasticity of demand for E is:
A)equal to infinity.
B)equal to 1.
C)equal to zero.
D)less than 1.
E)greater than zero but less than one.
Refer to Figure 6.1. The value of the coefficient of price elasticity of demand for E is:
A)equal to infinity.
B)equal to 1.
C)equal to zero.
D)less than 1.
E)greater than zero but less than one.
Unlock Deck
Unlock for access to all 133 flashcards in this deck.
Unlock Deck
k this deck
7
The figure given below shows the demand curves for five products: A, B, C, D, and E.Figure 6.1
Refer to Figure 6.1. The demand curve B is:
A)more elastic compared to demand curve E.
B)less elastic compared to demand curve C.
C)perfectly elastic.
D)more elastic compared to demand curve D.
E)an example of a unit-elastic demand curve.
Refer to Figure 6.1. The demand curve B is:
A)more elastic compared to demand curve E.
B)less elastic compared to demand curve C.
C)perfectly elastic.
D)more elastic compared to demand curve D.
E)an example of a unit-elastic demand curve.
Unlock Deck
Unlock for access to all 133 flashcards in this deck.
Unlock Deck
k this deck
8
Figure 5.3. The figure shows the wage rate and the quantity of labor supplied in an unskilled labor market.
When the manager of a local movie theater raises the price of movie tickets from $7.50 to $8.50, his total revenue falls. This means that:
A)the demand for movie tickets is highly elastic.
B)the supply of movie tickets is perfectly elastic.
C)the supply of movie tickets is unit-elastic.
D)the demand for movie tickets is inelastic.
E)the supply of movie tickets is inelastic.
Unlock Deck
Unlock for access to all 133 flashcards in this deck.
Unlock Deck
k this deck
9
Figure 5.3. The figure shows the wage rate and the quantity of labor supplied in an unskilled labor market.
When the elasticity of demand for a particular good is between zero and -1, _____.
A)demand is elastic
B)demand is inelastic
C)demand is unit-elastic
D)the good is an inferior good
E)the good is a normal good
When the elasticity of demand for a particular good is between zero and -1, _____.
A)demand is elastic
B)demand is inelastic
C)demand is unit-elastic
D)the good is an inferior good
E)the good is a normal good
Unlock Deck
Unlock for access to all 133 flashcards in this deck.
Unlock Deck
k this deck
10
Figure 5.3. The figure shows the wage rate and the quantity of labor supplied in an unskilled labor market.
If the price elasticity of demand for a product is equal to 4, a 1 percent increase in price of the product will cause the quantity demanded to _____ by _____ percent.
A)increase; 0.25
B)decrease; 0.25
C)increase; 4
D)decrease; 25
E)decrease; 4
If the price elasticity of demand for a product is equal to 4, a 1 percent increase in price of the product will cause the quantity demanded to _____ by _____ percent.
A)increase; 0.25
B)decrease; 0.25
C)increase; 4
D)decrease; 25
E)decrease; 4
Unlock Deck
Unlock for access to all 133 flashcards in this deck.
Unlock Deck
k this deck
11
The figure given below shows the demand curves for five products: A, B, C, D, and E.Figure 6.1
Refer to Figure 6.1. Which of the following is true when prices increase from P1 to P2?
A)The change in quantity demanded is larger for C than D, thus the demand for D is relatively less elastic than it is for C.
B)The change in the quantity demanded following the price increase is the largest for C.
C)The change in the quantity demanded following the price increase is the least for D.
D)The demand for E is perfectly inelastic.
E)The change in quantity demanded is larger for C than A, thus the demand for C is more elastic than it is for A.
Unlock Deck
Unlock for access to all 133 flashcards in this deck.
Unlock Deck
k this deck
12
Figure 5.3. The figure shows the wage rate and the quantity of labor supplied in an unskilled labor market.
The price elasticity of demand for a product is a measure of the:
A)extent of competition in the market for the product.
B)change in the quantity purchased of the product relative to a change in a consumer's income.
C)change in the quantity demanded of the product due to changes in factors other than price.
D)degree of consumer responsiveness to changes in the price of the product.
E)percentage change in the prices of two related products.
Unlock Deck
Unlock for access to all 133 flashcards in this deck.
Unlock Deck
k this deck
13
Figure 5.3. The figure shows the wage rate and the quantity of labor supplied in an unskilled labor market.
The less responsive consumers are to a change in the price of a product, _____.
A)the more price-elastic is the supply curve
B)the more income-inelastic is the demand curve
C)the more price-inelastic is the demand curve
D)the more income-elastic is the supply curve
E)the more price-elastic is the demand curve
Unlock Deck
Unlock for access to all 133 flashcards in this deck.
Unlock Deck
k this deck
14
Figure 5.3. The figure shows the wage rate and the quantity of labor supplied in an unskilled labor market.
Assume that the price elasticity of demand for a commodity is 0.20. A 10 percent increase in the price of the commodity will be followed by a:
A)20 percent increase in the quantity demanded.
B)2 percent decrease in the quantity demanded.
C)20 percent decrease in the quantity demanded.
D)0.2 percent decrease in the quantity demanded.
E)2 percent increase in the quantity demanded.
Unlock Deck
Unlock for access to all 133 flashcards in this deck.
Unlock Deck
k this deck
15
Figure 5.3. The figure shows the wage rate and the quantity of labor supplied in an unskilled labor market.
Which of the following is true of the price elasticity of demand of a product?
A)It measures the responsiveness of quantity demanded or quantity supplied to a change in one of the determinants of demand and/or supply.
B)It is calculated as the percentage change in the quantity demanded of the product divided by the percentage change in the price of the product.
C)It is calculated as the percentage change in the demand for the product divided by the percentage change in income of a consumer, everything else held constant.
D)It measures the responsiveness of demand to a change in the quantity supplied.
E)It is calculated as the percentage change in the quantity demanded of the product divided by the percentage change in the price of a related product, everything else held constant.
Unlock Deck
Unlock for access to all 133 flashcards in this deck.
Unlock Deck
k this deck
16
Figure 5.3. The figure shows the wage rate and the quantity of labor supplied in an unskilled labor market.
If a 10 percent increase in the price of gasoline results in a 2 percent decrease in the quantity demanded of gasoline, then the elasticity of demand for gasoline is:
A)equal to 0.2 and demand is inelastic.
B)equal to 0.2 and demand is elastic.
C)equal to 0.02 and demand is elastic.
D)equal to 0.5 and demand is inelastic.
E)equal to 0.5 and the demand is elastic.
Unlock Deck
Unlock for access to all 133 flashcards in this deck.
Unlock Deck
k this deck
17
Figure 5.3. The figure shows the wage rate and the quantity of labor supplied in an unskilled labor market.
Suppose 50 loaves of bread are demanded at a particular price. If that price rises by 2 percent, the quantity demanded decreases to 49.5 loaves of bread. This implies that the:
A)demand is elastic.
B)demand is unit-elastic.
C)price elasticity of demand is equal to 2.
D)demand is inelastic.
E)income elasticity of demand is equal to 0.5.
Unlock Deck
Unlock for access to all 133 flashcards in this deck.
Unlock Deck
k this deck
18
Figure 5.3. The figure shows the wage rate and the quantity of labor supplied in an unskilled labor market.
If the demand for a product is unit-elastic, a 25 percent increase in its price will result in:
A)a 25 percent change in total revenue.
B)no change in quantity demanded.
C)a 1 percent increase in quantity demanded.
D)a 25 percent decrease in quantity demanded.
E)a 100 percent change in quantity demanded.
Unlock Deck
Unlock for access to all 133 flashcards in this deck.
Unlock Deck
k this deck
19
Figure 5.3. The figure shows the wage rate and the quantity of labor supplied in an unskilled labor market.
Which of the following is explained by the price elasticity of demand for a product?
A)The effect of changes in price on the supply of the product
B)The effect of changes in quantity on the supply of the product
C)The effect of changes in quantity on the price of the product
D)The effect of changes in price on the quantity demanded of the product
E)The effect of changes in price on the quantity supplied of the product
Unlock Deck
Unlock for access to all 133 flashcards in this deck.
Unlock Deck
k this deck
20
Figure 5.3. The figure shows the wage rate and the quantity of labor supplied in an unskilled labor market.
If a 1 percent change in the price of a good causes a 1 percent change in the quantity demanded of that good, then the demand is said to be:
A)perfectly elastic.
B)income elastic.
C)unit-elastic.
D)inelastic.
E)perfectly inelastic.
If a 1 percent change in the price of a good causes a 1 percent change in the quantity demanded of that good, then the demand is said to be:
A)perfectly elastic.
B)income elastic.
C)unit-elastic.
D)inelastic.
E)perfectly inelastic.
Unlock Deck
Unlock for access to all 133 flashcards in this deck.
Unlock Deck
k this deck
21
The figure given below shows the demand curves for five products: A, B, C, D, and E.Figure 6.1
If the demand for corn is elastic, then:
A)there are not many substitutes for the consumption of corn.
B)the price elasticity of demand for corn is less than -1.
C)a decrease in price will reduce total revenue for corn producers.
D)an increase in price will increase total revenue for corn producers.
E)consumers will continue buying the same quantity even if price increases.
Unlock Deck
Unlock for access to all 133 flashcards in this deck.
Unlock Deck
k this deck
22
The figure given below shows the demand curves for five products: A, B, C, D, and E.Figure 6.1
Which of the following is a determinant of price elasticity of demand?
A)Availability of substitute goods
B)Excess capacity
C)Scale of production
D)Inventories
E)Cost of production
Which of the following is a determinant of price elasticity of demand?
A)Availability of substitute goods
B)Excess capacity
C)Scale of production
D)Inventories
E)Cost of production
Unlock Deck
Unlock for access to all 133 flashcards in this deck.
Unlock Deck
k this deck
23
The figure given below shows the demand curves for five products: A, B, C, D, and E.Figure 6.1
Demand for a good becomes more elastic as:
A)the number of substitutes available declines.
B)the time period under consideration becomes shorter.
C)a good makes up a larger percentage of a consumer's budget.
D)a good makes up a smaller percentage of a consumer's budget.
E)the producer has more time to respond to price changes.
Unlock Deck
Unlock for access to all 133 flashcards in this deck.
Unlock Deck
k this deck
24
The figure given below shows the demand curves for five products: A, B, C, D, and E.Figure 6.1
A 0.5% increase in the price of a particular product causes the quantity demanded of the product to drop to zero. This means that the price elasticity of demand for the product is:
A)perfectly elastic.
B)unit-elastic.
C)perfectly inelastic.
D)moderately elastic.
E)moderately inelastic.
A 0.5% increase in the price of a particular product causes the quantity demanded of the product to drop to zero. This means that the price elasticity of demand for the product is:
A)perfectly elastic.
B)unit-elastic.
C)perfectly inelastic.
D)moderately elastic.
E)moderately inelastic.
Unlock Deck
Unlock for access to all 133 flashcards in this deck.
Unlock Deck
k this deck
25
The figure given below shows the demand curves for five products: A, B, C, D, and E.Figure 6.1
Refer to Figure 6.1. The demand curve E is most likely to represent the demand for:
A)alcohol by an alcoholic.
B)a life-saving drug.
C)holiday travel packages.
D)a particular brand of breakfast cereal.
E)air conditioning during a hot summer.
Refer to Figure 6.1. The demand curve E is most likely to represent the demand for:
A)alcohol by an alcoholic.
B)a life-saving drug.
C)holiday travel packages.
D)a particular brand of breakfast cereal.
E)air conditioning during a hot summer.
Unlock Deck
Unlock for access to all 133 flashcards in this deck.
Unlock Deck
k this deck
26
The figure given below shows the demand curves for five products: A, B, C, D, and E.Figure 6.1
Which of the following is true with respect to the price elasticity of demand?
A)The coefficient of price elasticity of demand will change with changes in the units of measurement (for instance, going from pounds to ounces).
B)Elasticity of demand is equal to the slope of the demand curve.
C)Elasticity measures the sensitivity of total expenditure to a change in price of a good.
D)Elasticity will tend to be greater for a relatively expensive product than for a cheaper one.
E)A coefficient of 1 means that the percentage change in total expenditure is equivalent to the percentage change in price.
Unlock Deck
Unlock for access to all 133 flashcards in this deck.
Unlock Deck
k this deck
27
The figure given below shows the demand curves for five products: A, B, C, D, and E.Figure 6.1
Suppose the value of price elasticity of demand for goods manufactured by firms A, B, C, and D are 0, -0.8, -1, and -1.5 respectively. The demand for the good will be elastic for:
A)firms A, B, C, and D.
B)firms B, C, and D.
C)only firm A.
D)firms C and D only.
E)only firm D.
Suppose the value of price elasticity of demand for goods manufactured by firms A, B, C, and D are 0, -0.8, -1, and -1.5 respectively. The demand for the good will be elastic for:
A)firms A, B, C, and D.
B)firms B, C, and D.
C)only firm A.
D)firms C and D only.
E)only firm D.
Unlock Deck
Unlock for access to all 133 flashcards in this deck.
Unlock Deck
k this deck
28
The figure given below shows the demand curves for five products: A, B, C, D, and E.Figure 6.1
If the demand for a good is perfectly inelastic, then:
A)the value of price elasticity of demand of the good is equal to 1.
B)the value of price elasticity of demand of the good is equal to -1.
C)the demand curve of the good is nonexistent.
D)consumers are very responsive to a change in the price of the good.
E)quantity demanded does not change when price of the good changes.
Unlock Deck
Unlock for access to all 133 flashcards in this deck.
Unlock Deck
k this deck
29
The figure given below shows the demand curves for five products: A, B, C, D, and E.Figure 6.1
If a price increase from $20 to $40 causes quantity demanded to decrease from 100 units to 50 units, one can conclude that demand for the product is _____.
A)inelastic
B)elastic
C)perfectly inelastic
D)perfectly elastic
E)unit-elastic
If a price increase from $20 to $40 causes quantity demanded to decrease from 100 units to 50 units, one can conclude that demand for the product is _____.
A)inelastic
B)elastic
C)perfectly inelastic
D)perfectly elastic
E)unit-elastic
Unlock Deck
Unlock for access to all 133 flashcards in this deck.
Unlock Deck
k this deck
30
The figure given below shows the demand curves for five products: A, B, C, D, and E.Figure 6.1
If = -1.50 for a good, and price of the good decreases by 20 percent, then:
A)quantity demanded will decrease by 30 percent.
B)quantity demanded will increase by 30 percent.
C)total revenue will remain unchanged.
D)total revenue will decrease.
E)quantity demanded will increase by 3 percent.
If = -1.50 for a good, and price of the good decreases by 20 percent, then:
A)quantity demanded will decrease by 30 percent.
B)quantity demanded will increase by 30 percent.
C)total revenue will remain unchanged.
D)total revenue will decrease.
E)quantity demanded will increase by 3 percent.
Unlock Deck
Unlock for access to all 133 flashcards in this deck.
Unlock Deck
k this deck
31
The figure given below shows the demand curves for five products: A, B, C, D, and E.Figure 6.1
If a 15 percent reduction in the price of electricity per kilowatt hour has no impact on the total electricity consumption, we can infer that in the short run, the demand for electricity is _____.
A)perfectly inelastic
B)perfectly elastic
C)unit-elastic
D)relatively inelastic
E)relatively elastic
If a 15 percent reduction in the price of electricity per kilowatt hour has no impact on the total electricity consumption, we can infer that in the short run, the demand for electricity is _____.
A)perfectly inelastic
B)perfectly elastic
C)unit-elastic
D)relatively inelastic
E)relatively elastic
Unlock Deck
Unlock for access to all 133 flashcards in this deck.
Unlock Deck
k this deck
32
The figure given below shows the demand curves for five products: A, B, C, D, and E.Figure 6.1
Consider a medical breakthrough that led to the discovery of a simple microchip, which when inserted inside the human ear could prevent certain chronic diseases. The price elasticity of demand for that microchip would most likely be _____.
A)highly elastic
B)highly inelastic
C)undefined
D)negative only for high prices
E)positive only for high prices
Unlock Deck
Unlock for access to all 133 flashcards in this deck.
Unlock Deck
k this deck
33
The figure given below shows the demand curves for five products: A, B, C, D, and E.Figure 6.1
Assume that the demand curve for a certain good is a vertical line. This vertical demand curve illustrates the idea that:
A)consumers are unwilling to pay more than a certain price for the good.
B)the good is a complement to another good.
C)consumers are unwilling to pay less than a certain price for the good.
D)there are many substitutes for this good.
E)people will not change the quantity demanded of the good when its price is changed.
Unlock Deck
Unlock for access to all 133 flashcards in this deck.
Unlock Deck
k this deck
34
The figure given below shows the demand curves for five products: A, B, C, D, and E.Figure 6.1
If the demand for cream cheese produced by a dairy is perfectly elastic, then:
A)the demand curve will be vertical.
B)the demand curve will be horizontal.
C)the demand curve will be upward sloping.
D)the demand curve will be downward sloping.
E)the demand curve will initially slope upward and then slope upward.
Unlock Deck
Unlock for access to all 133 flashcards in this deck.
Unlock Deck
k this deck
35
The figure given below shows the demand curves for five products: A, B, C, D, and E.Figure 6.1
Which of the following would most likely be highly price-elastic?
A)The demand for milk by a household
B)The demand for insulin by a diabetes patient
C)The demand for water
D)The demand for new houses
E)The demand for coal over a period of one month
Which of the following would most likely be highly price-elastic?
A)The demand for milk by a household
B)The demand for insulin by a diabetes patient
C)The demand for water
D)The demand for new houses
E)The demand for coal over a period of one month
Unlock Deck
Unlock for access to all 133 flashcards in this deck.
Unlock Deck
k this deck
36
The figure given below shows the demand curves for five products: A, B, C, D, and E.Figure 6.1
In the opinion of many consumers, there are few, if any, substitutes for the popular search engine Google. If Google were to charge consumers for its services, it would face:
A)a relatively inelastic demand curve.
B)a relatively elastic demand curve.
C)a negative income elasticity of demand.
D)a positive cross elasticity of demand.
E)a perfectly elastic demand curve.
Unlock Deck
Unlock for access to all 133 flashcards in this deck.
Unlock Deck
k this deck
37
The figure given below shows the demand curves for five products: A, B, C, D, and E.Figure 6.1
An economic survey observed that a 20 percent cut in the price of a certain line of women's clothing, almost doubled the quantity demanded of the clothing. This led economists to conclude that the demand for this line of clothing is _____.
A)highly elastic
B)highly inelastic
C)unit-elastic
D)perfectly elastic
E)perfectly inelastic
Unlock Deck
Unlock for access to all 133 flashcards in this deck.
Unlock Deck
k this deck
38
The figure given below shows the demand curves for five products: A, B, C, D, and E.Figure 6.1
A horizontal demand curve shows that demand for a good is _____.
A)perfectly inelastic
B)moderately inelastic
C)unit-elastic
D)moderately elastic
E)perfectly elastic
A horizontal demand curve shows that demand for a good is _____.
A)perfectly inelastic
B)moderately inelastic
C)unit-elastic
D)moderately elastic
E)perfectly elastic
Unlock Deck
Unlock for access to all 133 flashcards in this deck.
Unlock Deck
k this deck
39
The figure given below shows the demand curves for five products: A, B, C, D, and E.Figure 6.1
Which of the following is an example of inelastic demand?
A)A 10 percent increase in the price of milk leads to a 20 percent decrease in the quantity demanded of milk.
B)A 10 percent increase in the price of milk leads to a 10 percent decrease in the quantity demanded of milk.
C)A 10 percent increase in the price of milk leads to a 5 percent decrease in the quantity demanded of milk.
D)A 10 percent increase in the price of milk leads to a 10 percent increase in the quantity demanded of milk.
E)A 10 percent increase in the price of milk leads to a 5 percent increase in the quantity demanded of milk.
Unlock Deck
Unlock for access to all 133 flashcards in this deck.
Unlock Deck
k this deck
40
The figure given below shows the demand curves for five products: A, B, C, D, and E.Figure 6.1
In Figure 6.1, which demand curve is most likely to represent the demand for insulin by diabetics?
A)A
B)B
C)C
D)D
E)E
In Figure 6.1, which demand curve is most likely to represent the demand for insulin by diabetics?
A)A
B)B
C)C
D)D
E)E
Unlock Deck
Unlock for access to all 133 flashcards in this deck.
Unlock Deck
k this deck
41
The figure given below shows the demand curves for five products: A, B, C, D, and E.Figure 6.1
Last year, Alice bought 40 CDs when her income was $20,000. This year, her income increased to $25,000, and she purchased 48 CDs. We can conclude that:
A)Alice's price elasticity of demand for CDs is equal to 1.
B)Alice's demand for CDs is price-inelastic.
C)Alice's demand for CDs is price-elastic.
D)the income elasticity of demand for CDs is negative.
E)CDs are a normal good.
Unlock Deck
Unlock for access to all 133 flashcards in this deck.
Unlock Deck
k this deck
42
The figure given below shows the demand curves for five products: A, B, C, D, and E.Figure 6.1
Suppose the manager of a store wants to know whether the product of the store across the street is a substitute for her product. In other words, she would need to know if the _____ for the products is positive.
A)cross-price elasticity of demand
B)price elasticity of demand
C)income elasticity of demand
D)price elasticity of supply
E)cross-price elasticity of supply
Unlock Deck
Unlock for access to all 133 flashcards in this deck.
Unlock Deck
k this deck
43
The figure given below shows the demand curves for five products: A, B, C, D, and E.Figure 6.1
Ceteris paribus, a 10 percent increase in income results in a 50 percent decline in the quantity of potatoes purchased. This implies potatoes can be categorized as _____.
A)complements
B)substitutes
C)inferior goods
D)normal goods
E)luxury goods
Ceteris paribus, a 10 percent increase in income results in a 50 percent decline in the quantity of potatoes purchased. This implies potatoes can be categorized as _____.
A)complements
B)substitutes
C)inferior goods
D)normal goods
E)luxury goods
Unlock Deck
Unlock for access to all 133 flashcards in this deck.
Unlock Deck
k this deck
44
The figure given below shows the demand curves for five products: A, B, C, D, and E.Figure 6.1
When the cross-price elasticity of demand for two goods is a positive number, one can correctly conclude that:
A)the goods are normal goods.
B)the goods are inferior goods.
C)the goods are substitutes.
D)the goods are complements.
E)total revenue will increase when the price increases.
When the cross-price elasticity of demand for two goods is a positive number, one can correctly conclude that:
A)the goods are normal goods.
B)the goods are inferior goods.
C)the goods are substitutes.
D)the goods are complements.
E)total revenue will increase when the price increases.
Unlock Deck
Unlock for access to all 133 flashcards in this deck.
Unlock Deck
k this deck
45
The figure given below shows the demand curves for five products: A, B, C, D, and E.Figure 6.1
When the price of hot dogs at the supermarket increases, the quantity demanded of hot dog buns declines. This situation describes:
A)the income elasticity of demand for hot dogs.
B)the income elasticity of demand for hot dog buns.
C)the price elasticity of supply for hot dogs.
D)the negative cross-price elasticity of demand for hot dogs and hot dog buns.
E)the positive cross-price elasticity of supply for hot dogs and hot dog buns.
Unlock Deck
Unlock for access to all 133 flashcards in this deck.
Unlock Deck
k this deck
46
The figure given below shows the demand curves for five products: A, B, C, D, and E.Figure 6.1
The value of price elasticity of demand is more likely to be above 1 if:
A)consumers have a long time to adjust to a price change.
B)the product is a necessity.
C)demand is inelastic.
D)there are few close substitutes for the product.
E)total revenue declines in response to a price reduction.
The value of price elasticity of demand is more likely to be above 1 if:
A)consumers have a long time to adjust to a price change.
B)the product is a necessity.
C)demand is inelastic.
D)there are few close substitutes for the product.
E)total revenue declines in response to a price reduction.
Unlock Deck
Unlock for access to all 133 flashcards in this deck.
Unlock Deck
k this deck
47
The figure given below shows the demand curves for five products: A, B, C, D, and E.Figure 6.1
Goods whose income elasticity of demand is greater than zero are _____.
A)inferior goods
B)normal goods
C)substitute goods
D)superior goods
E)public goods
Goods whose income elasticity of demand is greater than zero are _____.
A)inferior goods
B)normal goods
C)substitute goods
D)superior goods
E)public goods
Unlock Deck
Unlock for access to all 133 flashcards in this deck.
Unlock Deck
k this deck
48
The figure given below shows the demand curves for five products: A, B, C, D, and E.Figure 6.1
If a product has an inelastic demand, then:
A)there is probably a long time period under consideration.
B)as price increases, total revenue to producers decreases.
C)an increase in the price will decrease total consumer expenditures.
D)there are probably many complements for the good.
E)there are probably few substitutes for the good.
Unlock Deck
Unlock for access to all 133 flashcards in this deck.
Unlock Deck
k this deck
49
The figure given below shows the demand curves for five products: A, B, C, D, and E.Figure 6.1
As income levels rose moderately last year in the San Jose area, it was observed by local realtors that housing sales increased substantially. It is clear from this information that, everything else held constant, the income elasticity of demand for houses is _____.
A)negative and relatively low
B)negative and relatively high
C)positive and relatively low
D)positive and relatively high
E)neither positive nor negative
Unlock Deck
Unlock for access to all 133 flashcards in this deck.
Unlock Deck
k this deck
50
The figure given below shows the demand curves for five products: A, B, C, D, and E.Figure 6.1
Since an expensive sports car constitutes a greater portion of a consumer's budget than does laundry soap, the price elasticity of demand for an expensive sports car is _____.
A)relatively less elastic
B)unit-elastic
C)perfectly inelastic
D)relatively more elastic
E)perfectly elastic
Since an expensive sports car constitutes a greater portion of a consumer's budget than does laundry soap, the price elasticity of demand for an expensive sports car is _____.
A)relatively less elastic
B)unit-elastic
C)perfectly inelastic
D)relatively more elastic
E)perfectly elastic
Unlock Deck
Unlock for access to all 133 flashcards in this deck.
Unlock Deck
k this deck
51
The figure given below shows the demand curves for five products: A, B, C, D, and E.Figure 6.1
_____ measures the percentage change in quantity demanded of a good caused by a given percentage change in the price of a related good.
A)Income elasticity of demand
B)Cross-price elasticity of demand
C)Advertising elasticity of demand
D)Price elasticity of demand
E)Point elasticity
_____ measures the percentage change in quantity demanded of a good caused by a given percentage change in the price of a related good.
A)Income elasticity of demand
B)Cross-price elasticity of demand
C)Advertising elasticity of demand
D)Price elasticity of demand
E)Point elasticity
Unlock Deck
Unlock for access to all 133 flashcards in this deck.
Unlock Deck
k this deck
52
The figure given below shows the demand curves for five products: A, B, C, D, and E.Figure 6.1
An inferior good or service is any good or service for which:
A)an increase in price causes an increase in the quantity demanded.
B)a decrease in price causes an increase in demand.
C)an increase in price causes a decrease in the quantity demanded.
D)an increase in the amount consumed causes a decrease in marginal utility.
E)an increase in income causes a decrease in demand.
Unlock Deck
Unlock for access to all 133 flashcards in this deck.
Unlock Deck
k this deck
53
The figure given below shows the demand curves for five products: A, B, C, D, and E.Figure 6.1
Assume that due to unfavorable conditions in a prime honey-producing area, the price of honey increases by 50 percent. The quantity consumed of herbal tea declines immediately by 25 percent. Everything else held constant, the:
A)cross-price elasticity of demand for herbal tea and honey is negative, and therefore the two goods are substitutes.
B)cross-price elasticity of demand for herbal tea and honey is negative, and therefore the two goods are complements.
C)cross-price elasticity of demand for herbal tea and honey is positive, and therefore the two goods are substitutes.
D)cross-price elasticity of demand for herbal tea and honey is positive, and therefore the two goods are complements.
E)cross-price elasticity of demand cannot be determined from the information provided.
Unlock Deck
Unlock for access to all 133 flashcards in this deck.
Unlock Deck
k this deck
54
The figure given below shows the demand curves for five products: A, B, C, D, and E.Figure 6.1
Income elasticity of demand is expected to be _____.
A)relatively high for necessities
B)positive for most products
C)relatively low for luxuries
D)negative for most products
E)zero for most products
Income elasticity of demand is expected to be _____.
A)relatively high for necessities
B)positive for most products
C)relatively low for luxuries
D)negative for most products
E)zero for most products
Unlock Deck
Unlock for access to all 133 flashcards in this deck.
Unlock Deck
k this deck
55
The figure given below shows the demand curves for five products: A, B, C, D, and E.Figure 6.1
A fall in the average income of a consumer, say during a recession, is represented by:
A)an upward movement along the demand curve for a good consumed by the consumer.
B)a downward movement along the demand curve for a good consumed by the consumer.
C)a shift of the demand curve for a good consumed by the consumer.
D)a rotation of the demand curve for a good consumed by the consumer.
E)an inward shift of the demand curve for an inferior good consumed by the consumer.
Unlock Deck
Unlock for access to all 133 flashcards in this deck.
Unlock Deck
k this deck
56
The figure given below shows the demand curves for five products: A, B, C, D, and E.Figure 6.1
Peanut butter and jelly are:
A)substitutes and have a positive cross-price elasticity of Demand.
B)complements and have a positive cross-price elasticity of demand.
C)substitutes and have a positive cross-price elasticity of demand.
D)complements and have a negative cross-price elasticity of demand.
E)inferior goods when the income elasticity of demand is positive.
Unlock Deck
Unlock for access to all 133 flashcards in this deck.
Unlock Deck
k this deck
57
The figure given below shows the demand curves for five products: A, B, C, D, and E.Figure 6.1
If the demand for product R increases as the price of product S increases, then _____.
A)consumer preferences for S have increased
B)R and S are not related goods
C)R and S are substitutes
D)R and S are complements
E)R is an inferior good
If the demand for product R increases as the price of product S increases, then _____.
A)consumer preferences for S have increased
B)R and S are not related goods
C)R and S are substitutes
D)R and S are complements
E)R is an inferior good
Unlock Deck
Unlock for access to all 133 flashcards in this deck.
Unlock Deck
k this deck
58
The figure given below shows the demand curves for five products: A, B, C, D, and E.Figure 6.1
When product A is a substitute for product B, the cross-price elasticity of demand for products A and B will be _____.
A)unity
B)negative
C)positive
D)decreasing
E)increasing
When product A is a substitute for product B, the cross-price elasticity of demand for products A and B will be _____.
A)unity
B)negative
C)positive
D)decreasing
E)increasing
Unlock Deck
Unlock for access to all 133 flashcards in this deck.
Unlock Deck
k this deck
59
The figure given below shows the demand curves for five products: A, B, C, D, and E.Figure 6.1
As the price of movie tickets increases, which of the following is most likely to happen?
A)The demand for DVDs will increase.
B)The quantity of books demanded will decrease.
C)The number of Broadway tickets purchased will decrease.
D)The prices of popcorn and soda will increase.
E)The number of movies being produced will decrease.
Unlock Deck
Unlock for access to all 133 flashcards in this deck.
Unlock Deck
k this deck
60
The figure given below shows the demand curves for five products: A, B, C, D, and E.Figure 6.1
Which of the following goods is likely to have an income elasticity of demand that is less than zero?
A)A luxury yacht
B)A beach house
C)A state-of-the-art cellular phone
D)A box of generic macaroni and cheese dinner
E)A dinner at a French restaurant
Which of the following goods is likely to have an income elasticity of demand that is less than zero?
A)A luxury yacht
B)A beach house
C)A state-of-the-art cellular phone
D)A box of generic macaroni and cheese dinner
E)A dinner at a French restaurant
Unlock Deck
Unlock for access to all 133 flashcards in this deck.
Unlock Deck
k this deck
61
Scenario 5.1
The demand for noodles is given by the following equation: Q = 20 - 4P + 0.2I - 2Px. Assume that P = $8, I = 200, and Px = $10.
Given the above equation, the quantity of noodles demanded at a price of $8 is _____.
A)8
B)10
C)12
D)4
E)20
The demand for noodles is given by the following equation: Q = 20 - 4P + 0.2I - 2Px. Assume that P = $8, I = 200, and Px = $10.
Given the above equation, the quantity of noodles demanded at a price of $8 is _____.
A)8
B)10
C)12
D)4
E)20
Unlock Deck
Unlock for access to all 133 flashcards in this deck.
Unlock Deck
k this deck
62
Scenario 5.1
The demand for noodles is given by the following equation: Q = 20 - 4P + 0.2I - 2Px. Assume that P = $8, I = 200, and Px = $10.
Which of the following statements correctly describe the elasticities of demand for gasoline and automobiles?
A)The income elasticity of demand for gasoline and automobiles is negative.
B)The price elasticity of demand for gasoline is elastic and the cross-price elasticity between gasoline and SUVs is positive.
C)The price elasticity of demand for gasoline is inelastic and the cross-price elasticity between gasoline and SUVs is negative.
D)The price elasticity of demand for gasoline is inelastic and the income elasticity between gasoline and SUVs is positive.
E)The price elasticity of demand for gasoline is elastic and the income elasticity between gasoline and SUVs is negative.
Unlock Deck
Unlock for access to all 133 flashcards in this deck.
Unlock Deck
k this deck
63
The table below shows the quantities of automobiles, margarine, and coffee purchased by Ted at different levels of income.Table 6.2
Based on the information given in Table 6.2, margarine is:
A)an inferior good.
B)a necessity.
C)a normal good.
D)a complementary good.
E)a luxury good.
Based on the information given in Table 6.2, margarine is:
A)an inferior good.
B)a necessity.
C)a normal good.
D)a complementary good.
E)a luxury good.
Unlock Deck
Unlock for access to all 133 flashcards in this deck.
Unlock Deck
k this deck
64
The table given below reports the price and quantity demanded of a commodity.Table 6.1
According to Table 6.1, when the price increases from $5 to $6, the price elasticity of demand is _____.
A)0.25
B)1.0
C)1.3
D)1.8
E)1.67
According to Table 6.1, when the price increases from $5 to $6, the price elasticity of demand is _____.
A)0.25
B)1.0
C)1.3
D)1.8
E)1.67
Unlock Deck
Unlock for access to all 133 flashcards in this deck.
Unlock Deck
k this deck
65
Scenario 5.1
The demand for noodles is given by the following equation: Q = 20 - 4P + 0.2I - 2Px. Assume that P = $8, I = 200, and Px = $10.
A measure of the responsiveness of quantity supplied to changes in price is known as _____.
A)cross-price elasticity
B)price elasticity of demand
C)price elasticity of supply
D)income elasticity
E)point elasticity
Unlock Deck
Unlock for access to all 133 flashcards in this deck.
Unlock Deck
k this deck
66
The table below shows the quantities of automobiles, margarine, and coffee purchased by Ted at different levels of income.Table 6.2
Arc elasticity is calculated as _____.
A)
B)
C)
D)
E)
Arc elasticity is calculated as _____.
A)
B)
C)
D)
E)
Unlock Deck
Unlock for access to all 133 flashcards in this deck.
Unlock Deck
k this deck
67
The table below shows the quantities of automobiles, margarine, and coffee purchased by Ted at different levels of income.Table 6.2
If 12 candy bars are demanded at $0.30 each and 4 candy bars are demanded at $0.50 each, what is the elasticity of demand over the price range from $0.30 to $0.50?
A)2
B)1.67
C)0.5
D)7.5
E)0.4
If 12 candy bars are demanded at $0.30 each and 4 candy bars are demanded at $0.50 each, what is the elasticity of demand over the price range from $0.30 to $0.50?
A)2
B)1.67
C)0.5
D)7.5
E)0.4
Unlock Deck
Unlock for access to all 133 flashcards in this deck.
Unlock Deck
k this deck
68
The figure given below shows the demand curves for five products: A, B, C, D, and E.Figure 6.1
If the demand for beans tends to decline as incomes rise, everything else held constant, beans are _____.
A)luxury goods
B)normal goods
C)price sensitive
D)not price sensitive
E)inferior goods
If the demand for beans tends to decline as incomes rise, everything else held constant, beans are _____.
A)luxury goods
B)normal goods
C)price sensitive
D)not price sensitive
E)inferior goods
Unlock Deck
Unlock for access to all 133 flashcards in this deck.
Unlock Deck
k this deck
69
The figure given below shows the demand curves for five products: A, B, C, D, and E.Figure 6.1
For a given product, income elasticity of demand relates the percentage change in:
A)quantity demanded to the percentage change in income.
B)quantity demanded to the absolute change in income.
C)income to the percentage change in price.
D)price to the absolute change in quantity demanded.
E)income to the percentage change in quantity available for sale.
Unlock Deck
Unlock for access to all 133 flashcards in this deck.
Unlock Deck
k this deck
70
Scenario 5.1
The demand for noodles is given by the following equation: Q = 20 - 4P + 0.2I - 2Px. Assume that P = $8, I = 200, and Px = $10.
When the supply elasticity of a product is 2.5, a 10 percent decrease in price will _____ the quantity supplied of the product by _____ percent.
A)increase; 25
B)decrease; 25
C)increase; 2.5
D)decrease; 2.5
E)decrease; 4
Unlock Deck
Unlock for access to all 133 flashcards in this deck.
Unlock Deck
k this deck
71
The table below shows the quantities of automobiles, margarine, and coffee purchased by Ted at different levels of income.Table 6.2
Refer to Table 6.2. What is the income elasticity of demand for automobiles?
A)0.5
B)0.35
C)2
D)0.2
E)Zero
Refer to Table 6.2. What is the income elasticity of demand for automobiles?
A)0.5
B)0.35
C)2
D)0.2
E)Zero
Unlock Deck
Unlock for access to all 133 flashcards in this deck.
Unlock Deck
k this deck
72
Scenario 5.1
The demand for noodles is given by the following equation: Q = 20 - 4P + 0.2I - 2Px. Assume that P = $8, I = 200, and Px = $10.
Given the above equation, the price elasticity of demand for noodles is _____.
A)4
B)0.5
C)2
D)2.5
E)1.6
The demand for noodles is given by the following equation: Q = 20 - 4P + 0.2I - 2Px. Assume that P = $8, I = 200, and Px = $10.
Given the above equation, the price elasticity of demand for noodles is _____.
A)4
B)0.5
C)2
D)2.5
E)1.6
Unlock Deck
Unlock for access to all 133 flashcards in this deck.
Unlock Deck
k this deck
73
The figure given below shows the demand curves for five products: A, B, C, D, and E.Figure 6.1
Price elasticity of demand measured over a range of prices and quantities along the demand curve is _____.
A)point elasticity
B)arc elasticity
C)income elasticity
D)cross elasticity
E)price elasticity
Price elasticity of demand measured over a range of prices and quantities along the demand curve is _____.
A)point elasticity
B)arc elasticity
C)income elasticity
D)cross elasticity
E)price elasticity
Unlock Deck
Unlock for access to all 133 flashcards in this deck.
Unlock Deck
k this deck
74
The table below shows the quantities of automobiles, margarine, and coffee purchased by Ted at different levels of income.Table 6.2
Suppose the price of a product is reduced from $10 to $6 and the quantity demanded increases from 40 to 60 units. From this we can conclude that the price elasticity of demand over this price range is equal to _____.
A)1.2
B)1.25
C)0.80
D)0.20
E)0.5
Suppose the price of a product is reduced from $10 to $6 and the quantity demanded increases from 40 to 60 units. From this we can conclude that the price elasticity of demand over this price range is equal to _____.
A)1.2
B)1.25
C)0.80
D)0.20
E)0.5
Unlock Deck
Unlock for access to all 133 flashcards in this deck.
Unlock Deck
k this deck
75
The figure given below shows the demand curves for five products: A, B, C, D, and E.Figure 6.1
Which of the following items is likely to have the highest positive income elasticity of demand?
A)Bread
B)Jewelry
C)Soap
D)A plumber's service
E)Table salt
Which of the following items is likely to have the highest positive income elasticity of demand?
A)Bread
B)Jewelry
C)Soap
D)A plumber's service
E)Table salt
Unlock Deck
Unlock for access to all 133 flashcards in this deck.
Unlock Deck
k this deck
76
The figure given below shows the demand curves for five products: A, B, C, D, and E.Figure 6.1
When the income elasticity of demand for a good is negative, one can correctly conclude that:
A)the good is a normal good.
B)the good is an inferior good.
C)the good is a substitute.
D)the good is a complement.
E)total revenue will decrease when the price increases.
When the income elasticity of demand for a good is negative, one can correctly conclude that:
A)the good is a normal good.
B)the good is an inferior good.
C)the good is a substitute.
D)the good is a complement.
E)total revenue will decrease when the price increases.
Unlock Deck
Unlock for access to all 133 flashcards in this deck.
Unlock Deck
k this deck
77
The figure given below shows the demand curves for five products: A, B, C, D, and E.Figure 6.1
The income elasticity of demand _____.
A)must be negative because of the law of diminishing marginal utility
B)could be positive, negative or zero, depending on the nature of the good
C)must be positive for all goods because consumers tend to buy more at higher incomes
D)is usually zero because "you can only have so much"
E)can never be zero
Unlock Deck
Unlock for access to all 133 flashcards in this deck.
Unlock Deck
k this deck
78
Scenario 5.1
The demand for noodles is given by the following equation: Q = 20 - 4P + 0.2I - 2Px. Assume that P = $8, I = 200, and Px = $10.
Given the above equation, the income elasticity of demand for noodles is _____.
A)5
B)0.5
C)2
D)2.5
E)1.6
The demand for noodles is given by the following equation: Q = 20 - 4P + 0.2I - 2Px. Assume that P = $8, I = 200, and Px = $10.
Given the above equation, the income elasticity of demand for noodles is _____.
A)5
B)0.5
C)2
D)2.5
E)1.6
Unlock Deck
Unlock for access to all 133 flashcards in this deck.
Unlock Deck
k this deck
79
Scenario 5.1
The demand for noodles is given by the following equation: Q = 20 - 4P + 0.2I - 2Px. Assume that P = $8, I = 200, and Px = $10.
Acme Tools manufactures anvils, a forging tool. When the price of anvils was increased from $7 to $13, Acme Tools was willing and able to increase production from 1 to 4 units per day. Using the midpoint formula, what is Acme's price elasticity of supply for anvils?
A)2
B)1
C)0.5
D)4
E)3.5
Unlock Deck
Unlock for access to all 133 flashcards in this deck.
Unlock Deck
k this deck
80
The table below shows the quantities of automobiles, margarine, and coffee purchased by Ted at different levels of income.Table 6.2
Based on the information given in Table 6.2, coffee would be considered:
A)an inferior good.
B)a necessity.
C)a substitute good.
D)a complement good.
E)a luxury good.
Based on the information given in Table 6.2, coffee would be considered:
A)an inferior good.
B)a necessity.
C)a substitute good.
D)a complement good.
E)a luxury good.
Unlock Deck
Unlock for access to all 133 flashcards in this deck.
Unlock Deck
k this deck
Unlock Deck
Unlock for access to all 133 flashcards in this deck.


