Exam 6: Elasticity: Demand and Supply
Exam 1: The Wealth of Nations: Ownership and Economic Freedom87 Questions
Exam 2: Scarcity and Opportunity Costs87 Questions
Exam 3: Markets and the Price System96 Questions
Exam 4: The Aggregate Economy61 Questions
Exam 5: Using Economics to Understand the World Around You68 Questions
Exam 6: Elasticity: Demand and Supply133 Questions
Exam 7: Demand: Consumer Choice142 Questions
Exam 8: Supply: the Costs of Doing Business105 Questions
Exam 9: Profit Maximization121 Questions
Exam 10: Perfect Competition135 Questions
Exam 11: Monopoly118 Questions
Exam 12: Monopolistic Competition and Oligopoly114 Questions
Exam 13: Markets and Government113 Questions
Exam 14: Antitrust and Regulation88 Questions
Exam 15: Resource Markets110 Questions
Exam 16: The Labor Market116 Questions
Exam 17: The Capital Market110 Questions
Exam 18: The Land Market and Natural Resources55 Questions
Exam 19: Current Issues: Income, Income Distribution, Poverty, and Government Policy85 Questions
Exam 20: World Trade Equilibrium112 Questions
Exam 21: International Trade Restrictions109 Questions
Exam 22: Exchange Rates and Financial Links Between Countries130 Questions
Select questions type
Scenario 5.1
The demand for noodles is given by the following equation: Q = 20 - 4P + 0.2I - 2Px. Assume that P = $8, I = 200, and Px = $10.
-If a consumer is spending a small portion of his or her income on a good, then the demand for the good is likely to be inelastic.
Free
(True/False)
4.7/5  (30)
(30)
Correct Answer: Verified
True
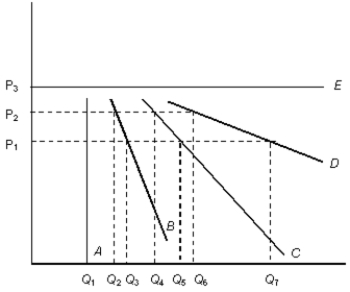
The figure given below shows the demand curves for five products: A, B, C, D, and E.Figure 6.1
 -Last year, Alice bought 40 CDs when her income was $20,000. This year, her income increased to $25,000, and she purchased 48 CDs. We can conclude that:
Free
(Multiple Choice)
4.9/5 (36)
Correct Answer:Verified
E
The figure given below shows the demand curves for five products: A, B, C, D, and E.Figure 6.1
-Price elasticity of demand measured over a range of prices and quantities along the demand curve is _____.
Free
(Multiple Choice)
4.9/5 (27)
Correct Answer:Verified
B
The figure given below shows the demand curves for five products: A, B, C, D, and E.Figure 6.1
-The income elasticity of demand _____.
(Multiple Choice)
4.9/5 (38)
Scenario 5.1
The demand for noodles is given by the following equation: Q = 20 - 4P + 0.2I - 2Px. Assume that P = $8, I = 200, and Px = $10.
-Price elasticity of demand is the sole determinant of profit for a firm.
(True/False)
4.9/5 (39)
Scenario 5.1
The demand for noodles is given by the following equation: Q = 20 - 4P + 0.2I - 2Px. Assume that P = $8, I = 200, and Px = $10.
-If firms have to change their production techniques in order to change the quantities they supply, their response to a price change will be less in a period of a year as compared to what they can do in a month.
(True/False)
4.8/5 (36)
Scenario 5.1
The demand for noodles is given by the following equation: Q = 20 - 4P + 0.2I - 2Px. Assume that P = $8, I = 200, and Px = $10.
-Tax incidence explains how taxes are shared between producers and consumers.
(True/False)
4.8/5 (34)
The figure given below shows the demand curves for five products: A, B, C, D, and E.Figure 6.1
-Goods whose income elasticity of demand is greater than zero are _____.
(Multiple Choice)
4.9/5 (35)
Scenario 5.1
The demand for noodles is given by the following equation: Q = 20 - 4P + 0.2I - 2Px. Assume that P = $8, I = 200, and Px = $10.
-An inferior good or service is any good or service for which an increase in income causes a decrease in demand.
(True/False)
4.8/5 (37)
Scenario 5.1
The demand for noodles is given by the following equation: Q = 20 - 4P + 0.2I - 2Px. Assume that P = $8, I = 200, and Px = $10.
-If butter has an income elasticity equal to 0.75, then butter is an inferior good.
(True/False)
4.8/5 (34)
Figure 5.3. The figure shows the wage rate and the quantity of labor supplied in an unskilled labor market. 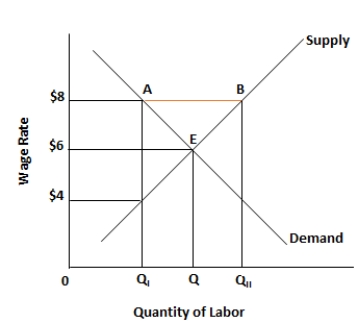 -If a 1 percent change in the price of a good causes a 1 percent change in the quantity demanded of that good, then the demand is said to be:
(Multiple Choice)
4.8/5 (36)
Scenario 5.1
The demand for noodles is given by the following equation: Q = 20 - 4P + 0.2I - 2Px. Assume that P = $8, I = 200, and Px = $10.
-In order to avoid problems involved with calculating percentage changes over a wide range, economists use the base or midpoint formula to calculate percentage changes when measuring the price elasticity of demand.
(True/False)
4.9/5 (28)
Scenario 5.1
The demand for noodles is given by the following equation: Q = 20 - 4P + 0.2I - 2Px. Assume that P = $8, I = 200, and Px = $10.
-Since the slope of a downward-sloping demand curve is constant, the price elasticity of demand does not change when moving along this line.
(True/False)
4.7/5 (34)
Scenario 5.1
The demand for noodles is given by the following equation: Q = 20 - 4P + 0.2I - 2Px. Assume that P = $8, I = 200, and Px = $10.
-If demand is unit-elastic, then a $5 decrease in price will lead to an increase in quantity demanded by 5 units.
(True/False)
4.7/5 (26)
Scenario 5.1
The demand for noodles is given by the following equation: Q = 20 - 4P + 0.2I - 2Px. Assume that P = $8, I = 200, and Px = $10.
-If the price elasticity of supply is zero, the supply curve is a horizontal line parallel to the quantity axis.
(True/False)
4.9/5 (36)
Scenario 5.1
The demand for noodles is given by the following equation: Q = 20 - 4P + 0.2I - 2Px. Assume that P = $8, I = 200, and Px = $10.
-The cross-price elasticity between movie tickets and video rentals is positive.
(True/False)
4.9/5 (25)
The figure given below shows the demand curves for five products: A, B, C, D, and E.Figure 6.1
-Assume that due to unfavorable conditions in a prime honey-producing area, the price of honey increases by 50 percent. The quantity consumed of herbal tea declines immediately by 25 percent. Everything else held constant, the:
(Multiple Choice)
4.8/5 (43)
The figure given below shows the demand curves for five products: A, B, C, D, and E.Figure 6.1
-Refer to Figure 6.1. Which of the following is true when prices increase from P1 to P2?
(Multiple Choice)
4.9/5 (37)
The figure given below shows the demand curves for five products: A, B, C, D, and E.Figure 6.1
-Assume that the demand curve for a certain good is a vertical line. This vertical demand curve illustrates the idea that:
(Multiple Choice)
4.9/5 (34)
Scenario 5.1
The demand for noodles is given by the following equation: Q = 20 - 4P + 0.2I - 2Px. Assume that P = $8, I = 200, and Px = $10.
-The social security tax, like any other tax, is shared by employers and employees based on the elasticities of demand and supply. If the wage elasticity of demand for labor is zero and the wage elasticity of supply for labor is positive:
(Multiple Choice)
4.7/5 (38)
Filters
- Essay(0)
- Multiple Choice(0)
- Short Answer(0)
- True False(0)
- Matching(0)