Deck 18: Statistical Quality Control
Full screen (f)
Question
Question
Question
Question
Question
Question
Question
Question
Question
Question
Question
Question
Question
Question
Question
Question
Question
Question
Question
Question
Question
Question
Question
Question
Question
Question
A plot of the sample ranges over regular time intervals is called a (n)___.
A) chart
chart
B)R chart
C)p chart
D)c chart
E)S chart
A)
chartB)R chart
C)p chart
D)c chart
E)S chart
Question
Question
Question
Question
According to the following Pareto chart,the most common defect was ___. 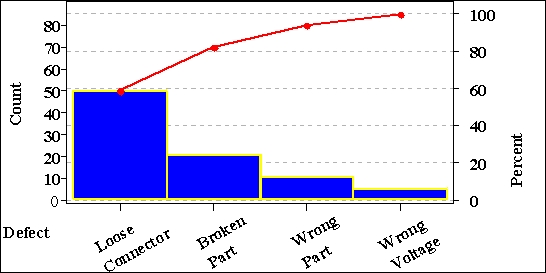
A)loose connector
B)broken part
C)wrong part
D)wrong voltage
E)all of the above
A)loose connector
B)broken part
C)wrong part
D)wrong voltage
E)all of the above
Question
Which of the following is not a quality control diagnostic technique?
A)point-and-figure chart
B)Pareto analysis
C)Fishbone diagram
D) control chart
E)p control chart
A)point-and-figure chart
B)Pareto analysis
C)Fishbone diagram
D)
control chartE)p control chart
Question
Question
Question
Question
Question
Question
Question
Question
A graph which displays computed means for a series of small random samples over a period of time is called a (n)___.
A) chart
chart
B)R chart
C)p chart
D)c chart
E)S chart
A)
chartB)R chart
C)p chart
D)c chart
E)S chart
Question
Question
Question
Question
Question
A graph which plots the number of nonconformances per item for multiple samples is called a (n)___.
A)chart
B)R chart
C)p chart
D)c chart
E)Pareto chart
A)chart
B)R chart
C)p chart
D)c chart
E)Pareto chart
Question
Question
Question
Question
Question
Question
Question
Question
Question
A graph which plots the proportions of items in noncompliance for multiple samples is called a (n)___.
A) chart
chart
B)R chart
C)p chart
D)c chart
E)Pareto chart
A)
chartB)R chart
C)p chart
D)c chart
E)Pareto chart
Question
Question
Question
Question
Question
Question
Question
Question
Question
Question
Question
Question
Question
Question
Question

Unlock Deck
Sign up to unlock the cards in this deck!
Unlock Deck
Unlock Deck
1/68
Play
Full screen (f)
Deck 18: Statistical Quality Control
1
A schematic representation of all the activities and interactions that occur in a process is called a Pareto chart.
False
2
A scatter diagram is a graphical mechanism for examining the relationship between two variables.
True
3
Pareto chart is a diagnostic tool that displays possible causes of a quality problem and the interrelationships among the causes.
False
4
Two general types of control charts are (1)control charts for manufactured items and (2)control charts for services.
Unlock Deck
Unlock for access to all 68 flashcards in this deck.
Unlock Deck
k this deck
5
Quality control can be undertaken in two distinct ways: after-process control and before-process control.
Unlock Deck
Unlock for access to all 68 flashcards in this deck.
Unlock Deck
k this deck
6
Quality control is essentially final inspection of the products to ensure that no defectives are shipped out.
Unlock Deck
Unlock for access to all 68 flashcards in this deck.
Unlock Deck
k this deck
7
Two general types of control charts are (1)control charts for measurements and (2)control charts for compliance items.
Unlock Deck
Unlock for access to all 68 flashcards in this deck.
Unlock Deck
k this deck
8
A p chart used for statistical quality control is a chart that shows the probability distribution of defectives in the process output.
Unlock Deck
Unlock for access to all 68 flashcards in this deck.
Unlock Deck
k this deck
9
If no variations occurred between manufactured items,the resulting control charts would be excellent.
Unlock Deck
Unlock for access to all 68 flashcards in this deck.
Unlock Deck
k this deck
10
Inspecting the attributes of a finished product to determine whether the product is acceptable,is in need of rework,or is to be rejected is called after-process quality control.
Unlock Deck
Unlock for access to all 68 flashcards in this deck.
Unlock Deck
k this deck
11
Compare various tools that identify,categorize,and solve problems in the quality improvement process,including flowcharts,Pareto analysis,cause-and-effect diagrams,control charts,check sheets,histograms,and scatter charts.
Unlock Deck
Unlock for access to all 68 flashcards in this deck.
Unlock Deck
k this deck
12
A control chart is used to control the flow of materials into a process.
Unlock Deck
Unlock for access to all 68 flashcards in this deck.
Unlock Deck
k this deck
13
A quality circle is a round-table of top-level quality managers.
Unlock Deck
Unlock for access to all 68 flashcards in this deck.
Unlock Deck
k this deck
14
Control charts are used to examine the output of a process for disturbing patterns or for data points that indicate that the process is out-of-control.
Unlock Deck
Unlock for access to all 68 flashcards in this deck.
Unlock Deck
k this deck
15
Measuring product attributes at regular intervals throughout the manufacturing process in an effort to pinpoint problem areas is called in-process quality control.
Unlock Deck
Unlock for access to all 68 flashcards in this deck.
Unlock Deck
k this deck
16
One definition that captures the spirit of most quality efforts in the business world is that quality results when a product delivers what is stipulated for it in its specifications.
Unlock Deck
Unlock for access to all 68 flashcards in this deck.
Unlock Deck
k this deck
17
Inspecting the attributes of a finished product to determine whether the product is acceptable,is in need of rework,or is to be rejected is called in-process quality control.
Unlock Deck
Unlock for access to all 68 flashcards in this deck.
Unlock Deck
k this deck
18
The Six Sigma approach essentially calls for the process to approach defect-free status.
Unlock Deck
Unlock for access to all 68 flashcards in this deck.
Unlock Deck
k this deck
19
Measure variation among manufactured items using various control charts,including x charts,R charts,p charts,and c charts.
Unlock Deck
Unlock for access to all 68 flashcards in this deck.
Unlock Deck
k this deck
20
Explain the meaning of quality in business,compare the approaches to quality improvement by various quality gurus and movements,and compare different approaches to controlling the quality of a product,including benchmarking,just-in-time inventory systems,Six Sigma,lean manufacturing,reengineering,failure mode and effects analysis,poka-yoke,and quality circles.
Unlock Deck
Unlock for access to all 68 flashcards in this deck.
Unlock Deck
k this deck
21
Sarah Soliz,Director of Quality Programs,is designing and R charts for the rod shearing process at Stockton Steel.She has 26 samples of rod length,and each sample included measurements of 5 rods.The mean of the 26 sample means is 112 centimetres,and mean of the 26 ranges is 0.15 centimetres.The upper control limit for her chart is ___.
A)112.09
B)5.087
C)26.087
D)115.90
E)110.09
A)112.09
B)5.087
C)26.087
D)115.90
E)110.09
Unlock Deck
Unlock for access to all 68 flashcards in this deck.
Unlock Deck
k this deck
22
Reengineering is ___.
A)a fine-tuning of the present process
B)downsizing of a company
C)another name for Deming's 14 points
D)the complete redesign of core business processes
E)incremental improvement of a core process
A)a fine-tuning of the present process
B)downsizing of a company
C)another name for Deming's 14 points
D)the complete redesign of core business processes
E)incremental improvement of a core process
Unlock Deck
Unlock for access to all 68 flashcards in this deck.
Unlock Deck
k this deck
23
According to Garvin,product quality is ___.
A)value perceived by the customer
B)an innate excellence of the product
C)not measurable in the product
D)fitness for the consumer's intended use
E)measurable in the product
A)value perceived by the customer
B)an innate excellence of the product
C)not measurable in the product
D)fitness for the consumer's intended use
E)measurable in the product
Unlock Deck
Unlock for access to all 68 flashcards in this deck.
Unlock Deck
k this deck
24
Higher output wattage means higher quality to some consumers of audio amplifiers.Among Garvin's five quality types,this is an example of ___.
A)user quality
B)transcendent quality
C)product quality
D)manufacturing-based quality
E)value quality
A)user quality
B)transcendent quality
C)product quality
D)manufacturing-based quality
E)value quality
Unlock Deck
Unlock for access to all 68 flashcards in this deck.
Unlock Deck
k this deck
25
A quality circle studying the problem of incorrect prices on purchase orders identified several potential causes: incorrect information from requesting department,out-of-date catalogues from suppliers,defective computer software,and worker practices in the purchasing department.These potential cause-and-effect relationships are best illustrated by a ___.
A)check list
B)Pareto chart
C)control chart
D)point-and-figure chart
E)Fishbone diagram
A)check list
B)Pareto chart
C)control chart
D)point-and-figure chart
E)Fishbone diagram
Unlock Deck
Unlock for access to all 68 flashcards in this deck.
Unlock Deck
k this deck
26
A plot of the sample ranges over regular time intervals is called a (n)___.
A) chart
B)R chart
C)p chart
D)c chart
E)S chart
A)
chartB)R chart
C)p chart
D)c chart
E)S chart
Unlock Deck
Unlock for access to all 68 flashcards in this deck.
Unlock Deck
k this deck
27
Upper and lower control limits are usually based upon ___.
A)± 3 standard deviations
B)± 2 standard deviations
C)± 1 standard deviation
D)± 4 standard deviations
E)± 6 standard deviations
A)± 3 standard deviations
B)± 2 standard deviations
C)± 1 standard deviation
D)± 4 standard deviations
E)± 6 standard deviations
Unlock Deck
Unlock for access to all 68 flashcards in this deck.
Unlock Deck
k this deck
28
If a process is in control,less than 0.3% of all the points that represent the process output such as the average measurement or the proportion defective should be beyond the upper and lower control limits.
Unlock Deck
Unlock for access to all 68 flashcards in this deck.
Unlock Deck
k this deck
29
According to Garvin,transcendent quality implies that a product ___.
A)conforms to design and engineering specifications
B)has an innate excellence
C)has no measurable attributes
D)is fit for the consumer's intended use
E)has measurable attributes
A)conforms to design and engineering specifications
B)has an innate excellence
C)has no measurable attributes
D)is fit for the consumer's intended use
E)has measurable attributes
Unlock Deck
Unlock for access to all 68 flashcards in this deck.
Unlock Deck
k this deck
30
According to the following Pareto chart,the most common defect was ___.
A)loose connector
B)broken part
C)wrong part
D)wrong voltage
E)all of the above
A)loose connector
B)broken part
C)wrong part
D)wrong voltage
E)all of the above
Unlock Deck
Unlock for access to all 68 flashcards in this deck.
Unlock Deck
k this deck
31
Which of the following is not a quality control diagnostic technique?
A)point-and-figure chart
B)Pareto analysis
C)Fishbone diagram
D) control chart
E)p control chart
A)point-and-figure chart
B)Pareto analysis
C)Fishbone diagram
D)
control chartE)p control chart
Unlock Deck
Unlock for access to all 68 flashcards in this deck.
Unlock Deck
k this deck
32
An advantage of a just-in-time inventory system is ___.
A)fewer managerial controls on inventory
B)lower inventory holding costs
C)larger shipment and production lots
D)fewer orders per operational year
E)more inspection and handling of materials
A)fewer managerial controls on inventory
B)lower inventory holding costs
C)larger shipment and production lots
D)fewer orders per operational year
E)more inspection and handling of materials
Unlock Deck
Unlock for access to all 68 flashcards in this deck.
Unlock Deck
k this deck
33
An chart is being developed using 25 samples of size 8 each.The average of 25 sample means is 6.20.The average of the 25 ranges is 0.30.The lower control limit is ___.
A)5.827
B)5.900
C)5.960
D)6.088
E)4.423
A)5.827
B)5.900
C)5.960
D)6.088
E)4.423
Unlock Deck
Unlock for access to all 68 flashcards in this deck.
Unlock Deck
k this deck
34
A company that uses benchmarking as a quality improvement practice will ___.
A)emulate the best practices and techniques used in their industry
B)institutionalize the not-invented-here philosophy
C)not analyze the competition's product
D)rely exclusively on government research for product improvements
E)be in the furniture business
A)emulate the best practices and techniques used in their industry
B)institutionalize the not-invented-here philosophy
C)not analyze the competition's product
D)rely exclusively on government research for product improvements
E)be in the furniture business
Unlock Deck
Unlock for access to all 68 flashcards in this deck.
Unlock Deck
k this deck
35
An chart is being developed using 25 samples of size 8 each.The average of 25 sample means is 6.20.The average of the 25 ranges is 0.30.The upper control limit is ___.
A)6.573
B)6.382
C)6.500
D)6.280
E)6.312
A)6.573
B)6.382
C)6.500
D)6.280
E)6.312
Unlock Deck
Unlock for access to all 68 flashcards in this deck.
Unlock Deck
k this deck
36
A collection of strategies,techniques,and actions taken by an organization to assure themselves that it is producing a quality product or service is called ___.
A)quality control
B)Pareto analysis
C)Fishbone techniques
D)just-in-time analysis
E)100% inspection
A)quality control
B)Pareto analysis
C)Fishbone techniques
D)just-in-time analysis
E)100% inspection
Unlock Deck
Unlock for access to all 68 flashcards in this deck.
Unlock Deck
k this deck
37
A manufacturer of automobile tires promotes a tread life of at least 80,000 kilometres for its Poly-Radial tires.Among Garvin's five quality types,this is an example of ___.
A)user quality
B)transcendent quality
C)product quality
D)manufacturing-based quality
E)value quality
A)user quality
B)transcendent quality
C)product quality
D)manufacturing-based quality
E)value quality
Unlock Deck
Unlock for access to all 68 flashcards in this deck.
Unlock Deck
k this deck
38
Sarah Soliz,Director of Quality Programs,is designing and R charts for the rod shearing process at Stockton Steel.She has 26 samples of rod length,and each sample included measurements of 5 rods.The mean of the 26 sample means is 112 centimetres,and mean of the 26 ranges is 0.15 centimetres.The centerline for her chart is ___.
A)5
B)26
C)0.15
D)11.2
E)112
A)5
B)26
C)0.15
D)11.2
E)112
Unlock Deck
Unlock for access to all 68 flashcards in this deck.
Unlock Deck
k this deck
39
A graph which displays computed means for a series of small random samples over a period of time is called a (n)___.
A) chart
B)R chart
C)p chart
D)c chart
E)S chart
A)
chartB)R chart
C)p chart
D)c chart
E)S chart
Unlock Deck
Unlock for access to all 68 flashcards in this deck.
Unlock Deck
k this deck
40
A lower fat content in meat means higher quality to many consumers.Among Garvin's five quality types,this is an example of ___.
A)user quality
B)transcendent quality
C)product quality
D)manufacturing-based quality
E)value quality
A)user quality
B)transcendent quality
C)product quality
D)manufacturing-based quality
E)value quality
Unlock Deck
Unlock for access to all 68 flashcards in this deck.
Unlock Deck
k this deck
41
Ophelia O'Brien,VP of Consumer Credit of Credit First Banks (CFB),is designing a p chart to monitor the default rate on personal loans at the CFB member banks.Her data includes the proportion in default for 30 samples of personal loans.Each sample contained 50 loans,and the average of the 30 proportions is 0.05.The centerline for Ophelia's p chart is ___.
A)30
B)0.50
C)50
D)1.5
E)0.05
A)30
B)0.50
C)50
D)1.5
E)0.05
Unlock Deck
Unlock for access to all 68 flashcards in this deck.
Unlock Deck
k this deck
42
Nels Neugent,Purchasing Manager at Pacific Medical Center,is designing a c chart to monitor the number of nonconformances per purchase order issued at Pacific.The total number of nonconformances for 30 purchase orders is 45.The centerline for Nels' c chart is ___.
A)75
B)0.67
C)15
D)1.5
E)30
A)75
B)0.67
C)15
D)1.5
E)30
Unlock Deck
Unlock for access to all 68 flashcards in this deck.
Unlock Deck
k this deck
43
Ophelia O'Brien,VP of Consumer Credit of Credit First Banks (CFB),is designing a p chart to monitor the default rate on personal loans at the CFB member banks.Her data includes the proportion in default for 30 samples of personal loans.Each sample contained 50 loans,and the average of the 30 proportions is 0.05.The lower control limit for Ophelia's p chart is ___.
A)0.0000
B)0.0204
C)0.0308
D)0.0149
E)-1.0000
A)0.0000
B)0.0204
C)0.0308
D)0.0149
E)-1.0000
Unlock Deck
Unlock for access to all 68 flashcards in this deck.
Unlock Deck
k this deck
44
A graph which plots the number of nonconformances per item for multiple samples is called a (n)___.
A)chart
B)R chart
C)p chart
D)c chart
E)Pareto chart
A)chart
B)R chart
C)p chart
D)c chart
E)Pareto chart
Unlock Deck
Unlock for access to all 68 flashcards in this deck.
Unlock Deck
k this deck
45
Sarah Soliz,Director of Quality Programs,is designing and R charts for the rod shearing process at Stockton Steel.She has 26 samples of rod length,and each sample included measurements of 5 rods.The mean of the 26 sample means is 112 centimetres,and mean of the 26 ranges is 0.15 centimetres.The centerline for her R chart is ___.
A)0.15
B)26
C)5
D)112
E)15
A)0.15
B)26
C)5
D)112
E)15
Unlock Deck
Unlock for access to all 68 flashcards in this deck.
Unlock Deck
k this deck
46
Sarah Soliz,Director of Quality Programs,is designing and R charts for the rod shearing process at Stockton Steel.She has 26 samples of rod length,and each sample included measurements of 5 rods.The mean of the 26 sample means is 112 centimetres,and mean of the 26 ranges is 0.15 centimetres.The lower control limit for her chart is ___.
A)25.913
B)4.913
C)111.91
D)108.10
E)112.84
A)25.913
B)4.913
C)111.91
D)108.10
E)112.84
Unlock Deck
Unlock for access to all 68 flashcards in this deck.
Unlock Deck
k this deck
47
An R Chart is to be developed for use in quality control.The average of the ranges is calculated to be 0.30.The samples sizes were 6 each.What would the lower control limit be?
A)1.000
B)0.300
C)2.004
D)-0.300
E)0.000
A)1.000
B)0.300
C)2.004
D)-0.300
E)0.000
Unlock Deck
Unlock for access to all 68 flashcards in this deck.
Unlock Deck
k this deck
48
Nels Neugent,Purchasing Manager at Pacific Medical Center,is designing a p chart to monitor the proportion of defective purchase orders issued at Pacific.He has the proportions defective for 22 samples of purchase orders.Each sample contained 150 purchase orders,and the average proportion defective is 0.08.The centerline for Nels's p chart is ___.
A)0.08
B)75
C)22
D)1.76
E)0.008
A)0.08
B)75
C)22
D)1.76
E)0.008
Unlock Deck
Unlock for access to all 68 flashcards in this deck.
Unlock Deck
k this deck
49
An R Chart is to be developed for use in quality control.The average of the ranges is calculated to be 0.30.The sample sizes were 6 each.What would the upper control limit be?
A)2.0040
B)2.3040
C)0.6012
D)0.0500
E)1.0982
A)2.0040
B)2.3040
C)0.6012
D)0.0500
E)1.0982
Unlock Deck
Unlock for access to all 68 flashcards in this deck.
Unlock Deck
k this deck
50
Ophelia O'Brien,VP of Consumer Credit of Credit First Banks (CFB),is designing a p chart to monitor the default rate on personal loans at the CFB member banks.Her data includes the proportion in default for 30 samples of personal loans.Each sample contained 50 loans,and the average of the 30 proportions is 0.05.The upper control limit for Ophelia's p chart is ___.
A)0.0925
B)0.0500
C)0.0308
D)0.1825
E)0.1425
A)0.0925
B)0.0500
C)0.0308
D)0.1825
E)0.1425
Unlock Deck
Unlock for access to all 68 flashcards in this deck.
Unlock Deck
k this deck
51
An R Chart is to be developed for use in quality control.The average of the ranges is calculated to be 0.60.This was based on several samples of size 7 each.What would the lower control limit be?
A)0.046
B)0.000
C)1.154
D)4.200
E)0.004
A)0.046
B)0.000
C)1.154
D)4.200
E)0.004
Unlock Deck
Unlock for access to all 68 flashcards in this deck.
Unlock Deck
k this deck
52
A p chart is to be developed for use in quality control.The value of p is calculated to be 0.04.The sample size is 100.What would the lower control limit be?
A)0.000
B)0.059
C)0.019
D)0.031
E)-0.019
A)0.000
B)0.059
C)0.019
D)0.031
E)-0.019
Unlock Deck
Unlock for access to all 68 flashcards in this deck.
Unlock Deck
k this deck
53
A graph which plots the proportions of items in noncompliance for multiple samples is called a (n)___.
A) chart
B)R chart
C)p chart
D)c chart
E)Pareto chart
A)
chartB)R chart
C)p chart
D)c chart
E)Pareto chart
Unlock Deck
Unlock for access to all 68 flashcards in this deck.
Unlock Deck
k this deck
54
Sarah Soliz,Director of Quality Programs,is designing and R charts for the rod shearing process at Stockton Steel.She has 26 samples of rod length,and each sample included measurements of 5 rods.The mean of the 26 sample means is 112 centimetres,and mean of the 26 ranges is 0.15 centimetres.The upper control limit for her R chart is ___.
A)0.150
B)10.57
C)0.317
D)2.114
E)0.713
A)0.150
B)10.57
C)0.317
D)2.114
E)0.713
Unlock Deck
Unlock for access to all 68 flashcards in this deck.
Unlock Deck
k this deck
55
Nels Neugent,Purchasing Manager at Pacific Medical Center,is designing a p chart to monitor the proportion of defective purchase orders issued at Pacific.He has the proportions defective for 22 samples of purchase orders.Each sample contained 150 purchase orders,and the average proportion defective is 0.08.The lower control limit for Nels's p chart is ___.
A)0.0447
B)0.0283
C)0.0135
D)0.0000
E)0.5090
A)0.0447
B)0.0283
C)0.0135
D)0.0000
E)0.5090
Unlock Deck
Unlock for access to all 68 flashcards in this deck.
Unlock Deck
k this deck
56
An R Chart is to be developed for use in quality control.The average of the ranges is calculated to be 0.60.This was based on several samples of size 7 each.What would the upper control limit be?
A)1.514
B)1.924
C)4.200
D)0.600
E)1.154
A)1.514
B)1.924
C)4.200
D)0.600
E)1.154
Unlock Deck
Unlock for access to all 68 flashcards in this deck.
Unlock Deck
k this deck
57
Sarah Soliz,Director of Quality Programs,is designing and R charts for the rod shearing process at Stockton Steel.She has 26 samples of rod length,and each sample included measurements of 5 rods.The mean of the 26 sample means is 112 centimetres,and mean of the 26 ranges is 0.15 centimetres.The lower control limit for her R chart is ___.
A)0.150
B)0.000
C)0.317
D)2.114
E)1.000
A)0.150
B)0.000
C)0.317
D)2.114
E)1.000
Unlock Deck
Unlock for access to all 68 flashcards in this deck.
Unlock Deck
k this deck
58
Nels Neugent,Purchasing Manager at Pacific Medical Center,is designing a p chart to monitor the proportion of defective purchase orders issued at Pacific.He has the proportions defective for 22 samples of purchase orders.Each sample contained 150 purchase orders,and the average proportion defective is 0.08.The upper control limit for Nels's p chart is ___.
A)0.1736
B)0.1465
C)0.1312
D)0.0940
E)0.1845
A)0.1736
B)0.1465
C)0.1312
D)0.0940
E)0.1845
Unlock Deck
Unlock for access to all 68 flashcards in this deck.
Unlock Deck
k this deck
59
A p chart is to be developed for use in quality control.The value of p is calculated to be 0.04.The sample size is 100.What would the upper control limit be?
A)0.059
B)0.099
C)0.109
D)0.040
E)1.090
A)0.059
B)0.099
C)0.109
D)0.040
E)1.090
Unlock Deck
Unlock for access to all 68 flashcards in this deck.
Unlock Deck
k this deck
60
A p chart is to be developed for use in quality control.The value of p is calculated to be 0.05.The sample size is 50.What would the upper control limit be?
A)0.142
B)-0.042
C)0.408
D)0.092
E)0.642
A)0.142
B)-0.042
C)0.408
D)0.092
E)0.642
Unlock Deck
Unlock for access to all 68 flashcards in this deck.
Unlock Deck
k this deck
61
Which of the following quality control chart conditions is an indicator that the process is,potentially,out-of-control?
A)several consecutive data points between the UCL and the LCL
B)a data point above the LCL
C)a data point below the UCL
D)an upward trend of nine data points
E)a data point in the outer 1/3 region
A)several consecutive data points between the UCL and the LCL
B)a data point above the LCL
C)a data point below the UCL
D)an upward trend of nine data points
E)a data point in the outer 1/3 region
Unlock Deck
Unlock for access to all 68 flashcards in this deck.
Unlock Deck
k this deck
62
Jack Joyner,Director of Quality Control at Covington Castings (CC),is designing a c chart to monitor the number of nonconformances per aluminum casting produced at CC.The total number of nonconformances for 26 castings is 91.The lower control limit for Jack's c chart is ___.
A)1.37
B)-2.11
C)3.50
D)-1.00
E)0.00
A)1.37
B)-2.11
C)3.50
D)-1.00
E)0.00
Unlock Deck
Unlock for access to all 68 flashcards in this deck.
Unlock Deck
k this deck
63
Which of the following quality control chart conditions is an indicator that the process is potentially out-of-control?
A)several consecutive data points between the UCL and the LCL
B)a data point above the LCL
C)a data point above the UCL
D)a data point in the outer 1/3 region
E)a data point on the center line
A)several consecutive data points between the UCL and the LCL
B)a data point above the LCL
C)a data point above the UCL
D)a data point in the outer 1/3 region
E)a data point on the center line
Unlock Deck
Unlock for access to all 68 flashcards in this deck.
Unlock Deck
k this deck
64
Which of the following quality control chart conditions is an indicator that the process is potentially out-of-control?
A)several consecutive data points between the UCL and the LCL
B)a data point below the LCL
C)a data point below the UCL
D)a data point in the outer 1/3 region
E)a data point on the center line
A)several consecutive data points between the UCL and the LCL
B)a data point below the LCL
C)a data point below the UCL
D)a data point in the outer 1/3 region
E)a data point on the center line
Unlock Deck
Unlock for access to all 68 flashcards in this deck.
Unlock Deck
k this deck
65
Nels Neugent,Purchasing Manager at Pacific Medical Center,is designing a c chart to monitor the number of nonconformances per purchase order issued at Pacific.The total number of nonconformances for 30 purchase orders is 45.The lower control limit for Nels's c chart is ___.
A)0.00
B)-2.17
C)1.03
D)0.94
E)1.00
A)0.00
B)-2.17
C)1.03
D)0.94
E)1.00
Unlock Deck
Unlock for access to all 68 flashcards in this deck.
Unlock Deck
k this deck
66
Nels Neugent,Purchasing Manager at Pacific Medical Center,is designing a c chart to monitor the number of nonconformances per purchase order issued at Pacific.The total number of nonconformances for 30 purchase orders is 45.The upper control limit for Nels's c chart is ___.
A)3.00
B)5.17
C)5.50
D)7.21
E)30.00
A)3.00
B)5.17
C)5.50
D)7.21
E)30.00
Unlock Deck
Unlock for access to all 68 flashcards in this deck.
Unlock Deck
k this deck
67
Jack Joyner,Director of Quality Control at Covington Castings (CC),is designing a c chart to monitor the number of nonconformances per aluminum casting produced at CC.The total number of nonconformances for 26 castings is 91.The upper control limit for Jack's c chart is ___.
A)9.11
B)13.40
C)3.50
D)7.61
E)1.00
A)9.11
B)13.40
C)3.50
D)7.61
E)1.00
Unlock Deck
Unlock for access to all 68 flashcards in this deck.
Unlock Deck
k this deck
68
Jack Joyner,Director of Quality Control at Covington Castings (CC),is designing a c chart to monitor the number of nonconformances per aluminum casting produced at CC.The total number of nonconformances for 26 castings is 91.The centerline for Jack's c chart is ___.
A)117.00
B)0.2857
C)3.50
D)65.00
E)26.00
A)117.00
B)0.2857
C)3.50
D)65.00
E)26.00
Unlock Deck
Unlock for access to all 68 flashcards in this deck.
Unlock Deck
k this deck
Unlock Deck
Unlock for access to all 68 flashcards in this deck.


