Deck 14: Describing Relationships: Scatterplots and Correlation
Full screen (f)
Question
A random sample of patients who attended a clinic was selected. The age of the patient (years) and the number of days since the last visit were collected and are displayed in the figure. 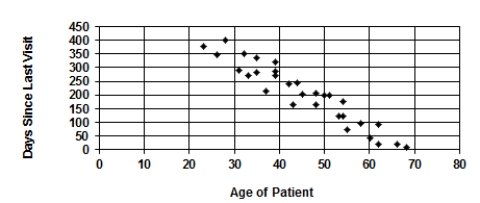 Describe the association between "Age of Patient" and "Days Since Last Visit."
A) There is a fairly strong, positive, straight-line association.
B) There is a fairly strong, negative, straight-line association.
C) There is a fairly weak, positive, straight-line association.
D) There is a fairly weak, negative, straight-line association.
Describe the association between "Age of Patient" and "Days Since Last Visit."A) There is a fairly strong, positive, straight-line association.
B) There is a fairly strong, negative, straight-line association.
C) There is a fairly weak, positive, straight-line association.
D) There is a fairly weak, negative, straight-line association.
Question
Question
How well does the number of beers a student drinks predict his or her blood alcohol content? Sixteen student volunteers at The Ohio State University drank a randomly assigned number of cans of beer. Thirty minutes later, a police officer measured their blood alcohol content (BAC). A scatterplot of the data appears below.  A plausible value of the correlation between number of beers and blood alcohol content, based on the scatterplot, is
A) r = -0.85.
B) r = -0.3.
C) r close to 0.
D) r = 0.3.
E) r = 0.85.
A plausible value of the correlation between number of beers and blood alcohol content, based on the scatterplot, isA) r = -0.85.
B) r = -0.3.
C) r close to 0.
D) r = 0.3.
E) r = 0.85.
Question
Question
Question
Question
Question
How well does the number of beers a student drinks predict his or her blood alcohol content? Sixteen student volunteers at The Ohio State University drank a randomly assigned number of cans of beer. Thirty minutes later, a police officer measured their blood alcohol content (BAC). A scatterplot of the data appears below. 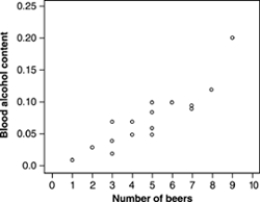 The scatterplot above shows
A) a moderately strong negative straight-line relationship between number of beers and BAC.
B) a weak negative straight-line relationship between number of beers and BAC.
C) almost no relationship between number of beers and BAC.
D) a weak positive straight-line relationship between number of beers and BAC.
E) a moderately strong positive straight-line relationship between number of beers and BAC.
The scatterplot above showsA) a moderately strong negative straight-line relationship between number of beers and BAC.
B) a weak negative straight-line relationship between number of beers and BAC.
C) almost no relationship between number of beers and BAC.
D) a weak positive straight-line relationship between number of beers and BAC.
E) a moderately strong positive straight-line relationship between number of beers and BAC.
Question
A random sample of patients who attended a clinic was selected. The age of the patient (years) and the number of days since the last visit were collected and are displayed in the figure.  A plausible value of the correlation coefficient for the data displayed is
A) -0.40.
B) -0.25.
C) 0.00.
D) +0.75.
E) -0.90.
A plausible value of the correlation coefficient for the data displayed isA) -0.40.
B) -0.25.
C) 0.00.
D) +0.75.
E) -0.90.
Question
Question
Question
Question
Question
Question
Question
How well does the number of beers a student drinks predict his or her blood alcohol content? Sixteen student volunteers at The Ohio State University drank a randomly assigned number of cans of beer. Thirty minutes later, a police officer measured their blood alcohol content (BAC). A scatterplot of the data appears below.  One student drank 9 beers. You see from the scatterplot that his BAC was about
A) 0.20.
B)5)
C)7)
D)9)
E) 20.
One student drank 9 beers. You see from the scatterplot that his BAC was aboutA) 0.20.
B)5)
C)7)
D)9)
E) 20.
Question
Question
Which of the values below is impossible for the descriptive measure in question?
A) r = -1.25
B)
 = -0.2
C) s = -3.4
D) Both r = -1.25 and s = -3.4 are correct.
E) Both
 = -0.2 and s = -3.4 are correct.
A) r = -1.25
B)
= -0.2C) s = -3.4
D) Both r = -1.25 and s = -3.4 are correct.
E) Both
= -0.2 and s = -3.4 are correct. Question
Question
Question
Question
A study of home heating costs collects data on the size of houses and the monthly cost to heat the houses with natural gas. Here are the data:
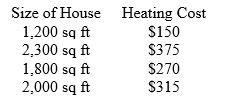
Just by looking at the data (don't do a calculation) you can see that the correlation between house size and heating cost is:
A) close to zero.
B) clearly positive.
C) clearly negative.
D) not close to zero, but it could be either positive or negative.
E) makes no sense for these data.
Just by looking at the data (don't do a calculation) you can see that the correlation between house size and heating cost is:
A) close to zero.
B) clearly positive.
C) clearly negative.
D) not close to zero, but it could be either positive or negative.
E) makes no sense for these data.
Question
Question
Question
Question
Question
An education researcher measured the IQ test scores of 78 seventh-grade students in a rural school, and also their school grade point average (GPA) measured on a 12-point scale. Here is a graph of GPA versus IQ for these students: 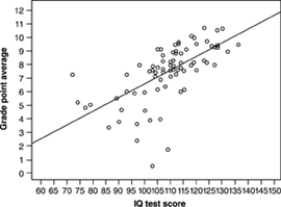 The name for this kind of graph is a
A) histogram.
B) bivariate plot.
C) boxplot.
D) scatterplot.
The name for this kind of graph is aA) histogram.
B) bivariate plot.
C) boxplot.
D) scatterplot.
Question
Question
A study of home heating costs collects data on the size of houses and the monthly cost to heat the houses with natural gas. Here are the data:
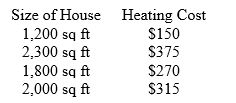
A friend tells you that the correlation for the data is r = 0.99984. You conclude from this number that
A) larger houses cost more to heat than smaller houses, and the relationship is almost perfectly straight.
B) smaller houses cost more to heat than larger houses, and the relationship is almost perfectly straight.
C) larger houses cost more to heat than smaller houses, but the relationship is not very strong.
D) smaller houses cost more to heat than larger houses, but the relationship is not very strong.
E) your friend made a mistake, because the value of r is impossible.
Question
Consider the following data:
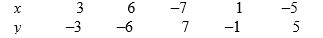
The correlation coefficient r is
A) 7.6.
B) 0.0
C) 1.0.
D) -0.6.
E) -1.0.
The correlation coefficient r is
A) 7.6.
B) 0.0
C) 1.0.
D) -0.6.
E) -1.0.
Question
Here are the heights of a young girl at several ages, from a pediatrician's records:
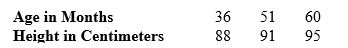
The correlation between the Age and Height variables is about
A) -0.97.
B) -0.6.
C) +0.1.
D) +0.5.
E) +0.97.
The correlation between the Age and Height variables is about
A) -0.97.
B) -0.6.
C) +0.1.
D) +0.5.
E) +0.97.
Question
Question
An education researcher measured the IQ test scores of 78 seventh-grade students in a rural school, and also their school grade point average (GPA) measured on a 12-point scale. Here is a graph of GPA versus IQ for these students:  The graph shows
A) a clear positive association.
B) very little association.
C) a clear negative association.
D) a skewed distribution.
The graph showsA) a clear positive association.
B) very little association.
C) a clear negative association.
D) a skewed distribution.
Question
An education researcher measured the IQ test scores of 78 seventh-grade students in a rural school, and also their school grade point average (GPA) measured on a 12-point scale. Here is a graph of GPA versus IQ for these students:  One of these numbers is the correlation r between IQ score and GPA. Which is it?
A) r = 0.02
B) r = 0.63
C) r = 0.95
D) r = -0.63
E) r = -0.95
One of these numbers is the correlation r between IQ score and GPA. Which is it?A) r = 0.02
B) r = 0.63
C) r = 0.95
D) r = -0.63
E) r = -0.95
Question
Question
For the data
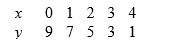
The correlation is
A) exactly equal to 1.
B) slightly less than 1.
C) about 1/2.
D) slightly greater than -1.
E) exactly equal to -1.
The correlation is
A) exactly equal to 1.
B) slightly less than 1.
C) about 1/2.
D) slightly greater than -1.
E) exactly equal to -1.
Question
Question
Question
Question
An education researcher measured the IQ test scores of 78 seventh-grade students in a rural school, and also their school grade point average (GPA) measured on a 12-point scale. Here is a graph of GPA versus IQ for these students:  The IQ score of the student who has the lowest GPA is about
A)103.
B) 0.6.
C)72.
D) 7.2.
The IQ score of the student who has the lowest GPA is aboutA)103.
B) 0.6.
C)72.
D) 7.2.
Question
A random sample of statistics students was selected. The heights (inches) and the weights (pounds) of the students were collected and are displayed in the figure below.  There is a student whose measurements were outliers in the data set. What do you expect will happen to the correlation if that student's measurements are removed?
A) The correlation will be greater than (further from zero) it was.
B) The correlation will be less than (closer to zero) it was.
C) The correlation will remain the same as it was.
D) There is not enough information to determine how the correlation might change.
There is a student whose measurements were outliers in the data set. What do you expect will happen to the correlation if that student's measurements are removed?A) The correlation will be greater than (further from zero) it was.
B) The correlation will be less than (closer to zero) it was.
C) The correlation will remain the same as it was.
D) There is not enough information to determine how the correlation might change.
Question
Question
Question
Question
Question
A random sample of statistics students was selected. The heights (inches) and the weights (pounds) of the students were collected and are displayed in the figure below.  There is a student whose measurements yield a point that is an outlier in the data set. The weight of this student was about
A)64.
B)66.
C)70.
D)120.
E) 180.
There is a student whose measurements yield a point that is an outlier in the data set. The weight of this student was aboutA)64.
B)66.
C)70.
D)120.
E) 180.
Question
Question
A random sample of statistics students was selected. The heights (inches) and the weights (pounds) of the students were collected and are displayed in the figure below.  There is a student whose measurements were outliers in the data set. What do you expect will happen to the correlation if that student's measurements are removed?
A) The correlation will be greater than (further from zero) it was.
B) The correlation will be less than (closer to zero) it was.
C) The correlation will remain the same as it was.
D) There is not enough information to determine how the correlation might change.
There is a student whose measurements were outliers in the data set. What do you expect will happen to the correlation if that student's measurements are removed?A) The correlation will be greater than (further from zero) it was.
B) The correlation will be less than (closer to zero) it was.
C) The correlation will remain the same as it was.
D) There is not enough information to determine how the correlation might change.
Question
Question
Question
A random sample of statistics students was selected. The heights (inches) and the weights (pounds) of the students were collected and are displayed in the figure below. 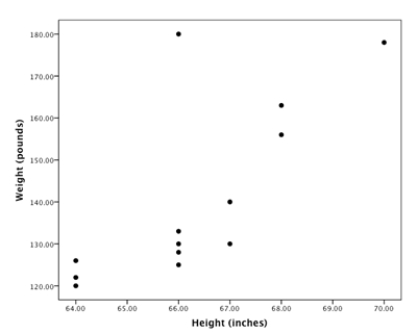 What is the approximate correlation between these two variables?
A) About -0.95
B) About -0.72
C) Close to 0
D) About 0.72
E) About 0.95
What is the approximate correlation between these two variables?A) About -0.95
B) About -0.72
C) Close to 0
D) About 0.72
E) About 0.95
Question
Question
Question
A random sample of statistics students was selected. The heights (inches) and the weights (pounds) of the students were collected and are displayed in the figure below.  There is a student whose measurements were outliers in the data set. The height of this student was about
A)56.
B)65.
C)70.
D)73.
E) 178.
There is a student whose measurements were outliers in the data set. The height of this student was aboutA)56.
B)65.
C)70.
D)73.
E) 178.
Question
A random sample of statistics students was selected. The heights (inches) and the weights (pounds) of the students were collected and are displayed in the figure below. 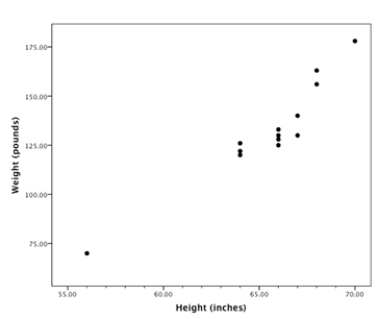 What is the approximate correlation between these two variables?
A) About -0.95
B) About -0.72
C) Close to 0
D) About 0.72
E) About 0.95
What is the approximate correlation between these two variables?A) About -0.95
B) About -0.72
C) Close to 0
D) About 0.72
E) About 0.95
Question

Unlock Deck
Sign up to unlock the cards in this deck!
Unlock Deck
Unlock Deck
1/56
Play
Full screen (f)
Deck 14: Describing Relationships: Scatterplots and Correlation
1
A random sample of patients who attended a clinic was selected. The age of the patient (years) and the number of days since the last visit were collected and are displayed in the figure. Describe the association between "Age of Patient" and "Days Since Last Visit."
A) There is a fairly strong, positive, straight-line association.
B) There is a fairly strong, negative, straight-line association.
C) There is a fairly weak, positive, straight-line association.
D) There is a fairly weak, negative, straight-line association.
Describe the association between "Age of Patient" and "Days Since Last Visit."A) There is a fairly strong, positive, straight-line association.
B) There is a fairly strong, negative, straight-line association.
C) There is a fairly weak, positive, straight-line association.
D) There is a fairly weak, negative, straight-line association.
There is a fairly strong, negative, straight-line association.
2
The correlation between the foot lengths of fathers and their (adult) sons, measured in inches, is r = 0.92.
If fathers' foot lengths were measured in millimeters (1 inch = 25.4 millimeters), and sons' foot lengths were measured in furlongs (one furlong equals 7,920 inches), the correlation between foot lengths of fathers and sons would be:
A) much smaller that 0.92.
B) slightly smaller than 0.92.
C) unchanged: equal to 0.92.
D) slightly larger than 0.92.
E) much larger that 0.92.
unchanged: equal to 0.92.
3
How well does the number of beers a student drinks predict his or her blood alcohol content? Sixteen student volunteers at The Ohio State University drank a randomly assigned number of cans of beer. Thirty minutes later, a police officer measured their blood alcohol content (BAC). A scatterplot of the data appears below. A plausible value of the correlation between number of beers and blood alcohol content, based on the scatterplot, is
A) r = -0.85.
B) r = -0.3.
C) r close to 0.
D) r = 0.3.
E) r = 0.85.
A plausible value of the correlation between number of beers and blood alcohol content, based on the scatterplot, isA) r = -0.85.
B) r = -0.3.
C) r close to 0.
D) r = 0.3.
E) r = 0.85.
r = 0.85.
4
Which statistical measure is not strongly affected by a few outliers in the data?
A) The mean
B) The median
C) The standard deviation
D) The correlation coefficient
A) The mean
B) The median
C) The standard deviation
D) The correlation coefficient
Unlock Deck
Unlock for access to all 56 flashcards in this deck.
Unlock Deck
k this deck
5
You calculate the correlation between height and weight for a simple random sample of 50 students from your college. Another student does the same for a simple random sample of 200 students from the college. The other student should get
A) a correlation greater than 1.
B) a correlation less than -1.
C) a higher value for the correlation.
D) a lower value for the correlation.
E) about the same value for the correlation.
A) a correlation greater than 1.
B) a correlation less than -1.
C) a higher value for the correlation.
D) a lower value for the correlation.
E) about the same value for the correlation.
Unlock Deck
Unlock for access to all 56 flashcards in this deck.
Unlock Deck
k this deck
6
A correlation cannot have the value
A) 0.4.
B) -0.75.
C) 1.5.
D) 0.0.
E) 0.99.
A) 0.4.
B) -0.75.
C) 1.5.
D) 0.0.
E) 0.99.
Unlock Deck
Unlock for access to all 56 flashcards in this deck.
Unlock Deck
k this deck
7
To display the relationship between per capita yearly liquor consumption and liver disease death rates per 100,000 people in each of 29 countries, a good choice of a graph would be a:
A) pie chart.
B) boxplot.
C) histogram.
D) line graph.
E) scatterplot.
A) pie chart.
B) boxplot.
C) histogram.
D) line graph.
E) scatterplot.
Unlock Deck
Unlock for access to all 56 flashcards in this deck.
Unlock Deck
k this deck
8
How well does the number of beers a student drinks predict his or her blood alcohol content? Sixteen student volunteers at The Ohio State University drank a randomly assigned number of cans of beer. Thirty minutes later, a police officer measured their blood alcohol content (BAC). A scatterplot of the data appears below. The scatterplot above shows
A) a moderately strong negative straight-line relationship between number of beers and BAC.
B) a weak negative straight-line relationship between number of beers and BAC.
C) almost no relationship between number of beers and BAC.
D) a weak positive straight-line relationship between number of beers and BAC.
E) a moderately strong positive straight-line relationship between number of beers and BAC.
The scatterplot above showsA) a moderately strong negative straight-line relationship between number of beers and BAC.
B) a weak negative straight-line relationship between number of beers and BAC.
C) almost no relationship between number of beers and BAC.
D) a weak positive straight-line relationship between number of beers and BAC.
E) a moderately strong positive straight-line relationship between number of beers and BAC.
Unlock Deck
Unlock for access to all 56 flashcards in this deck.
Unlock Deck
k this deck
9
A random sample of patients who attended a clinic was selected. The age of the patient (years) and the number of days since the last visit were collected and are displayed in the figure. A plausible value of the correlation coefficient for the data displayed is
A) -0.40.
B) -0.25.
C) 0.00.
D) +0.75.
E) -0.90.
A plausible value of the correlation coefficient for the data displayed isA) -0.40.
B) -0.25.
C) 0.00.
D) +0.75.
E) -0.90.
Unlock Deck
Unlock for access to all 56 flashcards in this deck.
Unlock Deck
k this deck
10
In a scatterplot we can see
A) a display of the five-number summary.
B) whether or not we have a simple random sample.
C) the shape, center, and spread of the distribution of a quantitative variable.
D) the form, direction, and strength of a relationship between two quantitative variables.
A) a display of the five-number summary.
B) whether or not we have a simple random sample.
C) the shape, center, and spread of the distribution of a quantitative variable.
D) the form, direction, and strength of a relationship between two quantitative variables.
Unlock Deck
Unlock for access to all 56 flashcards in this deck.
Unlock Deck
k this deck
11
Which of these is not true of the correlation r between the weight in pounds and gas mileage in miles-per-gallon for a sample of pickup trucks?
A) r must take a value between -1 and 1.
B) r is measured in pounds.
C) If heavier pickup trucks tend to also get lower gas mileage, then r < 0.
D) r would not change if we measured these trucks in kilograms instead of pounds.
E) Both "r is measured in pounds" and "r would not change if we measured these trucks in kilograms instead of pounds" are correct.
Unlock Deck
Unlock for access to all 56 flashcards in this deck.
Unlock Deck
k this deck
12
The correlation between the foot lengths of fathers and their (adult) sons, measured in inches, is r = 0.92.
This tells us that:
A) fathers with small feet tend to have sons with small feet.
B) fathers with small feet tend to have sons with large feet.
C) sons have, on the average, feet that are 0.92 times the length of their father's.
D) 92 percent of all sons have feet that are bigger than their father's.
E) there is almost no connection between the foot lengths of fathers and sons.
Unlock Deck
Unlock for access to all 56 flashcards in this deck.
Unlock Deck
k this deck
13
A nutrition study measuring how many helpings of vegetables each of 125 grade school children were served each week during a school year and their body mass index (BMI) scores found r = -0.13. This tells that:
A) children who ate more vegetables tend to have lower BMI scores, but it is a weak association.
B) children who ate more vegetables tend to have lower BMI scores, and it is a strong association.
C) children who ate more vegetables tend to have higher BMI scores, but it is a weak association.
D) children who ate more vegetables tend to have higher BMI scores, and it is a strong association.
Unlock Deck
Unlock for access to all 56 flashcards in this deck.
Unlock Deck
k this deck
14
The correlation between two variables is of -0.18. One can conclude that:
A) an increase in one variable causes a small decrease in the other variable.
B) there is a strong, positive association between the two variables.
C) there is a strong, negative association between the two variables.
D) there is a positive association between the variables, but it is weak.
E) there is a negative association between the variables, but it is weak.
Unlock Deck
Unlock for access to all 56 flashcards in this deck.
Unlock Deck
k this deck
15
Which correlation indicates almost no straight-line relationship?
A) -0.84
B) 0.75
C) 1.5
D) 0.04
E) 0.99
A) -0.84
B) 0.75
C) 1.5
D) 0.04
E) 0.99
Unlock Deck
Unlock for access to all 56 flashcards in this deck.
Unlock Deck
k this deck
16
How well does the number of beers a student drinks predict his or her blood alcohol content? Sixteen student volunteers at The Ohio State University drank a randomly assigned number of cans of beer. Thirty minutes later, a police officer measured their blood alcohol content (BAC). A scatterplot of the data appears below. One student drank 9 beers. You see from the scatterplot that his BAC was about
A) 0.20.
B)5)
C)7)
D)9)
E) 20.
One student drank 9 beers. You see from the scatterplot that his BAC was aboutA) 0.20.
B)5)
C)7)
D)9)
E) 20.
Unlock Deck
Unlock for access to all 56 flashcards in this deck.
Unlock Deck
k this deck
17
A study found that the size of the police force and the number of churches in towns across the United States are positively associated. This means that:
A) towns with few churches tend to have a small police force.
B) towns with many churches tend to have a large police force.
C) towns with few churches tend to have a large police force.
D) towns with many churches tend to have a small police force.
E) Both "towns with few churches tend to have a small police force" and "towns with many churches tend to have a large police force" are correct.
Unlock Deck
Unlock for access to all 56 flashcards in this deck.
Unlock Deck
k this deck
18
Which of the values below is impossible for the descriptive measure in question?
A) r = -1.25
B)
= -0.2
C) s = -3.4
D) Both r = -1.25 and s = -3.4 are correct.
E) Both
= -0.2 and s = -3.4 are correct.
A) r = -1.25
B)
= -0.2C) s = -3.4
D) Both r = -1.25 and s = -3.4 are correct.
E) Both
= -0.2 and s = -3.4 are correct. Unlock Deck
Unlock for access to all 56 flashcards in this deck.
Unlock Deck
k this deck
19
The scout troop is selling brownies for $4 per plate (no sales tax.) If the explanatory variable was the number of plates of brownies a customer purchased and the response was the amount paid, what would be the correlation between the number of plates and amount paid?
A) The correlation cannot be determined from the information provided.
B) $4
C) 0.25
D) 1.0
E) 4.0
A) The correlation cannot be determined from the information provided.
B) $4
C) 0.25
D) 1.0
E) 4.0
Unlock Deck
Unlock for access to all 56 flashcards in this deck.
Unlock Deck
k this deck
20
A nutrition study measured how many helpings of vegetables each of 125 grade school children were served each week during a school year and their body mass index (BMI) scores. Which variable would one put on the horizontal axis of a scatterplot of the data?
A) One would put the BMI score because it is the response variable.
B) One would put the BMI score because it is the explanatory variable.
C) One would put helpings of vegetables because it is the response variable.
D) One would put helpings of vegetables because it is the explanatory variable.
E) It makes no difference because there is no explanatory-response distinction in this study.
Unlock Deck
Unlock for access to all 56 flashcards in this deck.
Unlock Deck
k this deck
21
According to the USA Today web page that tracks such occurrences, NFL quarterbacks are arrested less often (on average) than running backs, who, in turn, are arrested less often than linemen. The correlation coefficient r between a player's position and his number of arrests:
A) is positive.
B) is near zero.
C) is negative.
D) makes no sense.
A) is positive.
B) is near zero.
C) is negative.
D) makes no sense.
Unlock Deck
Unlock for access to all 56 flashcards in this deck.
Unlock Deck
k this deck
22
A study of home heating costs collects data on the size of houses and the monthly cost to heat the houses with natural gas. Here are the data:
Just by looking at the data (don't do a calculation) you can see that the correlation between house size and heating cost is:
A) close to zero.
B) clearly positive.
C) clearly negative.
D) not close to zero, but it could be either positive or negative.
E) makes no sense for these data.
Just by looking at the data (don't do a calculation) you can see that the correlation between house size and heating cost is:
A) close to zero.
B) clearly positive.
C) clearly negative.
D) not close to zero, but it could be either positive or negative.
E) makes no sense for these data.
Unlock Deck
Unlock for access to all 56 flashcards in this deck.
Unlock Deck
k this deck
23
The correlation between average monthly temperature x and monthly natural gas consumption y over a period of months at Lincoln High School is -0.86. Which of the following operations would change the value of the correlation?
A) Measure gas consumption in cubic meters instead of cubic feet.
B) Remove two outliers from the data before doing the calculation.
C) Measure temperature in degrees Kelvin instead of in degrees Fahrenheit.
D) All of the answers are correct
A) Measure gas consumption in cubic meters instead of cubic feet.
B) Remove two outliers from the data before doing the calculation.
C) Measure temperature in degrees Kelvin instead of in degrees Fahrenheit.
D) All of the answers are correct
Unlock Deck
Unlock for access to all 56 flashcards in this deck.
Unlock Deck
k this deck
24
The numerical value of a correlation coefficient can be
A) any number.
B) zero or any positive number.
C) any number between 0 and 1.
D) any number between -1 and 1.
E) any number between -1 and 1 other than 0.
A) any number.
B) zero or any positive number.
C) any number between 0 and 1.
D) any number between -1 and 1.
E) any number between -1 and 1 other than 0.
Unlock Deck
Unlock for access to all 56 flashcards in this deck.
Unlock Deck
k this deck
25
All 753 students in grades 1 through 6 in an elementary school are given a math test that was designed for third graders. The heights of all 753 students are also recorded. We expect to see _______________ between height and test score.
A) positive association
B) little or no association
C) negative association
D) either positive or negative association (but it's hard to predict which)
A) positive association
B) little or no association
C) negative association
D) either positive or negative association (but it's hard to predict which)
Unlock Deck
Unlock for access to all 56 flashcards in this deck.
Unlock Deck
k this deck
26
An agricultural economist says that the correlation between corn prices and rainfall during the growing season is r = -0.7. This means that:
A) when rainfall is above average, corn prices also tend to be above average.
B) there is almost no relation between rainfall amount and corn prices.
C) when rainfall is above average, corn prices tend to be below average.
D) the economist is confused because correlation makes no sense in this situation.
Unlock Deck
Unlock for access to all 56 flashcards in this deck.
Unlock Deck
k this deck
27
An education researcher measured the IQ test scores of 78 seventh-grade students in a rural school, and also their school grade point average (GPA) measured on a 12-point scale. Here is a graph of GPA versus IQ for these students: The name for this kind of graph is a
A) histogram.
B) bivariate plot.
C) boxplot.
D) scatterplot.
The name for this kind of graph is aA) histogram.
B) bivariate plot.
C) boxplot.
D) scatterplot.
Unlock Deck
Unlock for access to all 56 flashcards in this deck.
Unlock Deck
k this deck
28
A psychologist says that the correlation between patients' profession (truck driver, school teacher, tattoo artist, etc.) and their intelligence quotient test score is r = -0.07. This means that:
A) patients who are tattoo artists tend to have lower IQ scores.
B) there is almost no relation between profession and IQ scores.
C) patients who are truck drivers tend to have lower IQ scores.
D) the psychologist is confused because correlation makes no sense in this situation.
A) patients who are tattoo artists tend to have lower IQ scores.
B) there is almost no relation between profession and IQ scores.
C) patients who are truck drivers tend to have lower IQ scores.
D) the psychologist is confused because correlation makes no sense in this situation.
Unlock Deck
Unlock for access to all 56 flashcards in this deck.
Unlock Deck
k this deck
29
A study of home heating costs collects data on the size of houses and the monthly cost to heat the houses with natural gas. Here are the data:
A friend tells you that the correlation for the data is r = 0.99984. You conclude from this number that
A) larger houses cost more to heat than smaller houses, and the relationship is almost perfectly straight.
B) smaller houses cost more to heat than larger houses, and the relationship is almost perfectly straight.
C) larger houses cost more to heat than smaller houses, but the relationship is not very strong.
D) smaller houses cost more to heat than larger houses, but the relationship is not very strong.
E) your friend made a mistake, because the value of r is impossible.
Unlock Deck
Unlock for access to all 56 flashcards in this deck.
Unlock Deck
k this deck
30
Consider the following data:
The correlation coefficient r is
A) 7.6.
B) 0.0
C) 1.0.
D) -0.6.
E) -1.0.
The correlation coefficient r is
A) 7.6.
B) 0.0
C) 1.0.
D) -0.6.
E) -1.0.
Unlock Deck
Unlock for access to all 56 flashcards in this deck.
Unlock Deck
k this deck
31
Here are the heights of a young girl at several ages, from a pediatrician's records:
The correlation between the Age and Height variables is about
A) -0.97.
B) -0.6.
C) +0.1.
D) +0.5.
E) +0.97.
The correlation between the Age and Height variables is about
A) -0.97.
B) -0.6.
C) +0.1.
D) +0.5.
E) +0.97.
Unlock Deck
Unlock for access to all 56 flashcards in this deck.
Unlock Deck
k this deck
32
Which of the statements does not contain a statistical blunder?
A) There is a strong negative correlation between a person's sex and the amount that he or she pays for automobile insurance.
B) The mean height of young women is 64 inches, and the correlation between their heights and weights is 0.6 inches.
C) The correlation between height and weight for adult females is about r = 1.2.
D) All three prior statements contain blunders.
Unlock Deck
Unlock for access to all 56 flashcards in this deck.
Unlock Deck
k this deck
33
An education researcher measured the IQ test scores of 78 seventh-grade students in a rural school, and also their school grade point average (GPA) measured on a 12-point scale. Here is a graph of GPA versus IQ for these students: The graph shows
A) a clear positive association.
B) very little association.
C) a clear negative association.
D) a skewed distribution.
The graph showsA) a clear positive association.
B) very little association.
C) a clear negative association.
D) a skewed distribution.
Unlock Deck
Unlock for access to all 56 flashcards in this deck.
Unlock Deck
k this deck
34
An education researcher measured the IQ test scores of 78 seventh-grade students in a rural school, and also their school grade point average (GPA) measured on a 12-point scale. Here is a graph of GPA versus IQ for these students: One of these numbers is the correlation r between IQ score and GPA. Which is it?
A) r = 0.02
B) r = 0.63
C) r = 0.95
D) r = -0.63
E) r = -0.95
One of these numbers is the correlation r between IQ score and GPA. Which is it?A) r = 0.02
B) r = 0.63
C) r = 0.95
D) r = -0.63
E) r = -0.95
Unlock Deck
Unlock for access to all 56 flashcards in this deck.
Unlock Deck
k this deck
35
Tall men tend to marry women who are taller than average, but the degree of association between the height of a husband and the height of his wife isn't very big. The correlation between heights of husbands and wives that best describes this situation is
A) -0.9.
B) -0.3.
C) close to 0.
D) 0.3.
E) 0.9.
A) -0.9.
B) -0.3.
C) close to 0.
D) 0.3.
E) 0.9.
Unlock Deck
Unlock for access to all 56 flashcards in this deck.
Unlock Deck
k this deck
36
For the data
The correlation is
A) exactly equal to 1.
B) slightly less than 1.
C) about 1/2.
D) slightly greater than -1.
E) exactly equal to -1.
The correlation is
A) exactly equal to 1.
B) slightly less than 1.
C) about 1/2.
D) slightly greater than -1.
E) exactly equal to -1.
Unlock Deck
Unlock for access to all 56 flashcards in this deck.
Unlock Deck
k this deck
37
A study is conducted to determine if there is a relationship between height (inches) and annual income (dollars) among executives at large companies in the United States. Which of the following statements about the descriptive statistics for the study data is not true?
A) The correlation is measured in inches per dollar.
B) The standard deviation of the incomes is measured in dollars.
C) The standard deviation of the heights is measured in inches.
D) The median income is measured in dollars.
E) Both "the standard deviation of the incomes is measured in dollars" and "the standard deviation of the heights is measured in inches" are correct.
Unlock Deck
Unlock for access to all 56 flashcards in this deck.
Unlock Deck
k this deck
38
Correlation is a measure of
A) center.
B) spread.
C) trend.
D) confounding.
E) None of the answers are correct.
A) center.
B) spread.
C) trend.
D) confounding.
E) None of the answers are correct.
Unlock Deck
Unlock for access to all 56 flashcards in this deck.
Unlock Deck
k this deck
39
A study found correlation r = 0.43 between high school math grades (on a 0 to 100 scale) and income 10 years after high school. This means that
A) people with high math grades tend to have higher income than people with low math grades.
B) people with low math grades tend to have higher income than people with high math grades.
C) there is almost no association between math grades and income.
D) a mistake has been made because a correlation cannot be 0.43.
E) a mistake has been made because a correlation between math grades and income makes no sense.
Unlock Deck
Unlock for access to all 56 flashcards in this deck.
Unlock Deck
k this deck
40
An education researcher measured the IQ test scores of 78 seventh-grade students in a rural school, and also their school grade point average (GPA) measured on a 12-point scale. Here is a graph of GPA versus IQ for these students: The IQ score of the student who has the lowest GPA is about
A)103.
B) 0.6.
C)72.
D) 7.2.
The IQ score of the student who has the lowest GPA is aboutA)103.
B) 0.6.
C)72.
D) 7.2.
Unlock Deck
Unlock for access to all 56 flashcards in this deck.
Unlock Deck
k this deck
41
A random sample of statistics students was selected. The heights (inches) and the weights (pounds) of the students were collected and are displayed in the figure below. There is a student whose measurements were outliers in the data set. What do you expect will happen to the correlation if that student's measurements are removed?
A) The correlation will be greater than (further from zero) it was.
B) The correlation will be less than (closer to zero) it was.
C) The correlation will remain the same as it was.
D) There is not enough information to determine how the correlation might change.
There is a student whose measurements were outliers in the data set. What do you expect will happen to the correlation if that student's measurements are removed?A) The correlation will be greater than (further from zero) it was.
B) The correlation will be less than (closer to zero) it was.
C) The correlation will remain the same as it was.
D) There is not enough information to determine how the correlation might change.
Unlock Deck
Unlock for access to all 56 flashcards in this deck.
Unlock Deck
k this deck
42
An analyst gathers data on the number of hours of political debates watched per week and the sales of antacids. She expects that political debate watching will help explain antacid sales.
The plot of the data in the preceding question shows that people who watch more political debates tend to buy more antacids. The analyst calculates the correlation r between hours of debates and antacids purchased. A plausible value is:
A) r = -1.
B) r = -0.4.
C) r = 0.
D) r = 0.4.
The plot of the data in the preceding question shows that people who watch more political debates tend to buy more antacids. The analyst calculates the correlation r between hours of debates and antacids purchased. A plausible value is:
A) r = -1.
B) r = -0.4.
C) r = 0.
D) r = 0.4.
Unlock Deck
Unlock for access to all 56 flashcards in this deck.
Unlock Deck
k this deck
43
Which of the following pairs of variables is most likely to show a positive correlation?
A) number of classes a senior has failed and number of job offers he or she receives
B) a car's maximum speed and its gas mileage (miles per gallon)
C) TV screen size (diagonal) in inches and its cost (in dollars)
D) time since removing a dish from the stove and the dish's temperature.
A) number of classes a senior has failed and number of job offers he or she receives
B) a car's maximum speed and its gas mileage (miles per gallon)
C) TV screen size (diagonal) in inches and its cost (in dollars)
D) time since removing a dish from the stove and the dish's temperature.
Unlock Deck
Unlock for access to all 56 flashcards in this deck.
Unlock Deck
k this deck
44
You read that "the correlation between spending on schools (dollars per pupil) and median score on student achievement tests is r = 0.08." This means that
A) school districts that spend a lot have higher scores than low-spending districts, and this effect is quite strong.
B) school districts that spend a lot have lower scores than low-spending districts, and the effect is quite strong.
C) school districts that spend a lot have somewhat higher scores than low-spending districts, but the effect is weak.
D) school districts that spend a lot have somewhat lower scores than low-spending districts, but the effect is weak.
Unlock Deck
Unlock for access to all 56 flashcards in this deck.
Unlock Deck
k this deck
45
Which of the following statements about correlation is false?
A) The value of correlation coefficient is heavily influenced by outliers.
B) The correlation coefficient can never be larger than 1.
C) The correlation coefficient measures how tightly the points in a scatterplot cluster about a straight line.
D) The correlation coefficient cannot be 0.
A) The value of correlation coefficient is heavily influenced by outliers.
B) The correlation coefficient can never be larger than 1.
C) The correlation coefficient measures how tightly the points in a scatterplot cluster about a straight line.
D) The correlation coefficient cannot be 0.
Unlock Deck
Unlock for access to all 56 flashcards in this deck.
Unlock Deck
k this deck
46
A random sample of statistics students was selected. The heights (inches) and the weights (pounds) of the students were collected and are displayed in the figure below. There is a student whose measurements yield a point that is an outlier in the data set. The weight of this student was about
A)64.
B)66.
C)70.
D)120.
E) 180.
There is a student whose measurements yield a point that is an outlier in the data set. The weight of this student was aboutA)64.
B)66.
C)70.
D)120.
E) 180.
Unlock Deck
Unlock for access to all 56 flashcards in this deck.
Unlock Deck
k this deck
47
Which of the following are most likely to be positively correlated?
A) Carat weight of a diamond and its price
B) Number of courses failed and college grade point average
C) Amount of food eaten and hunger level
D) Internet connection speed and time to download a movie file
A) Carat weight of a diamond and its price
B) Number of courses failed and college grade point average
C) Amount of food eaten and hunger level
D) Internet connection speed and time to download a movie file
Unlock Deck
Unlock for access to all 56 flashcards in this deck.
Unlock Deck
k this deck
48
A random sample of statistics students was selected. The heights (inches) and the weights (pounds) of the students were collected and are displayed in the figure below. There is a student whose measurements were outliers in the data set. What do you expect will happen to the correlation if that student's measurements are removed?
A) The correlation will be greater than (further from zero) it was.
B) The correlation will be less than (closer to zero) it was.
C) The correlation will remain the same as it was.
D) There is not enough information to determine how the correlation might change.
There is a student whose measurements were outliers in the data set. What do you expect will happen to the correlation if that student's measurements are removed?A) The correlation will be greater than (further from zero) it was.
B) The correlation will be less than (closer to zero) it was.
C) The correlation will remain the same as it was.
D) There is not enough information to determine how the correlation might change.
Unlock Deck
Unlock for access to all 56 flashcards in this deck.
Unlock Deck
k this deck
49
Which of the following are most likely to be negatively correlated?
A) The total floor space and the price of an apartment in New York
B) The percentage of body fat and the time it takes to run a mile for male college students
C) The heights and yearly earnings of 35-year-old U.S. adults
D) The prices and the weights of all racing bicycles sold last year in Chicago
A) The total floor space and the price of an apartment in New York
B) The percentage of body fat and the time it takes to run a mile for male college students
C) The heights and yearly earnings of 35-year-old U.S. adults
D) The prices and the weights of all racing bicycles sold last year in Chicago
Unlock Deck
Unlock for access to all 56 flashcards in this deck.
Unlock Deck
k this deck
50
An analyst gathers data on the number of hours of political debates watched per week and the sales of antacids. She expects that political debate watching will help explain antacid sales.
In a scatterplot of her data:
A) hours of political debate watching should be on the horizontal axis.
B) antacid sales should be on the horizontal axis.
C) it makes no difference which is horizontal.
D) a scatterplot is not an appropriate type of graph for these data.
In a scatterplot of her data:
A) hours of political debate watching should be on the horizontal axis.
B) antacid sales should be on the horizontal axis.
C) it makes no difference which is horizontal.
D) a scatterplot is not an appropriate type of graph for these data.
Unlock Deck
Unlock for access to all 56 flashcards in this deck.
Unlock Deck
k this deck
51
A random sample of statistics students was selected. The heights (inches) and the weights (pounds) of the students were collected and are displayed in the figure below. What is the approximate correlation between these two variables?
A) About -0.95
B) About -0.72
C) Close to 0
D) About 0.72
E) About 0.95
What is the approximate correlation between these two variables?A) About -0.95
B) About -0.72
C) Close to 0
D) About 0.72
E) About 0.95
Unlock Deck
Unlock for access to all 56 flashcards in this deck.
Unlock Deck
k this deck
52
Which of these statements is true of the correlation r?
A) r can only take values 0 or greater than 0.
B) r can only take values between -1 and 1, inclusive.
C) r describes only straight-line relationships.
D) Both "r can only take values 0 or greater than 0" and "r describes only straight-line relationships." are correct.
E) Both "r can only take values between -1 and 1, inclusive" and "r describes only straight-line relationships" are correct.
Unlock Deck
Unlock for access to all 56 flashcards in this deck.
Unlock Deck
k this deck
53
There is a strong straight-line relationship between the outdoor temperature and the amount of energy used to air condition a house. Higher temperatures require more energy to keep the house cool. Knowing this, a reasonable value for the correlation coefficient between temperature and home energy consumption is:
A) r = 1.
B) r = 0.8.
C) r = 0.
D) r = -0.8.
E) r = -1.
A) r = 1.
B) r = 0.8.
C) r = 0.
D) r = -0.8.
E) r = -1.
Unlock Deck
Unlock for access to all 56 flashcards in this deck.
Unlock Deck
k this deck
54
A random sample of statistics students was selected. The heights (inches) and the weights (pounds) of the students were collected and are displayed in the figure below. There is a student whose measurements were outliers in the data set. The height of this student was about
A)56.
B)65.
C)70.
D)73.
E) 178.
There is a student whose measurements were outliers in the data set. The height of this student was aboutA)56.
B)65.
C)70.
D)73.
E) 178.
Unlock Deck
Unlock for access to all 56 flashcards in this deck.
Unlock Deck
k this deck
55
A random sample of statistics students was selected. The heights (inches) and the weights (pounds) of the students were collected and are displayed in the figure below. What is the approximate correlation between these two variables?
A) About -0.95
B) About -0.72
C) Close to 0
D) About 0.72
E) About 0.95
What is the approximate correlation between these two variables?A) About -0.95
B) About -0.72
C) Close to 0
D) About 0.72
E) About 0.95
Unlock Deck
Unlock for access to all 56 flashcards in this deck.
Unlock Deck
k this deck
56
Which of the following pairs of variables is most likely to show a negative correlation?
A) A person's income and her years of education
B) A car's weight and its gas mileage (miles per gallon)
C) A student's grade point average and his IQ score
D) A man's height and his income
A) A person's income and her years of education
B) A car's weight and its gas mileage (miles per gallon)
C) A student's grade point average and his IQ score
D) A man's height and his income
Unlock Deck
Unlock for access to all 56 flashcards in this deck.
Unlock Deck
k this deck
Unlock Deck
Unlock for access to all 56 flashcards in this deck.


