Exam 14: Describing Relationships: Scatterplots and Correlation
Exam 1: Where Do Data Come From30 Questions
Exam 2: Samples, Good and Bad30 Questions
Exam 3: What Do Samples Tell Us55 Questions
Exam 4: Sample Surveys in the Real World36 Questions
Exam 5: Experiments, Good and Bad50 Questions
Exam 6: Experiments in the Real World32 Questions
Exam 7: Data Ethics21 Questions
Exam 8: Measuring33 Questions
Exam 9: Do the Numbers Make Sense25 Questions
Exam 10: Graphs, Good and Bad30 Questions
Exam 11: Displaying Distributions With Graphs22 Questions
Exam 13: Normal Distributions54 Questions
Exam 14: Describing Relationships: Scatterplots and Correlation56 Questions
Exam 15: Describing Relationships: Regression, Prediction, and Causation37 Questions
Exam 16: The Consumer Price Index and Government Statistics31 Questions
Exam 17: Thinking About Chance25 Questions
Exam 18: Probability Models30 Questions
Exam 19: Simulation20 Questions
Exam 20: The House Edge: Expected Values30 Questions
Exam 21: What Is a Confidence Interval43 Questions
Exam 22: What Is a Test of Significance30 Questions
Exam 23: Use and Abuse of Statistical Inference18 Questions
Exam 24: Two-Way Tables and the Chi-Square Test47 Questions
Select questions type
Which of the statements does not contain a statistical blunder?
Free
(Multiple Choice)
4.8/5  (35)
(35)
Correct Answer: Verified
D
A random sample of statistics students was selected. The heights (inches) and the weights (pounds) of the students were collected and are displayed in the figure below.  There is a student whose measurements were outliers in the data set. What do you expect will happen to the correlation if that student's measurements are removed?
Free
(Multiple Choice)
4.8/5 (27)
Correct Answer:Verified
A
A random sample of statistics students was selected. The heights (inches) and the weights (pounds) of the students were collected and are displayed in the figure below. 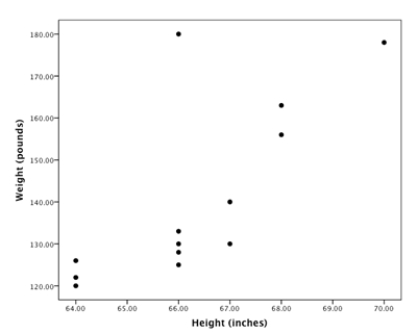 What is the approximate correlation between these two variables?
Free
(Multiple Choice)
4.8/5 (39)
Correct Answer:Verified
D
Which statistical measure is not strongly affected by a few outliers in the data?
(Multiple Choice)
4.8/5 (42)
Which of the following are most likely to be negatively correlated?
(Multiple Choice)
4.9/5 (34)
A study found correlation r = 0.43 between high school math grades (on a 0 to 100 scale) and income 10 years after high school. This means that
(Multiple Choice)
4.9/5 (44)
An education researcher measured the IQ test scores of 78 seventh-grade students in a rural school, and also their school grade point average (GPA) measured on a 12-point scale. Here is a graph of GPA versus IQ for these students:  The graph shows
(Multiple Choice)
4.8/5 (28)
A random sample of statistics students was selected. The heights (inches) and the weights (pounds) of the students were collected and are displayed in the figure below. 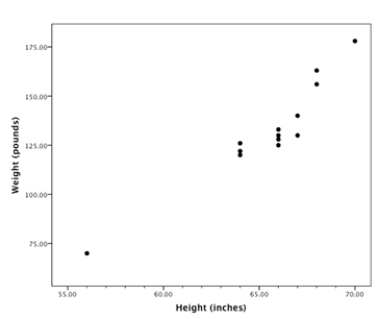 What is the approximate correlation between these two variables?
(Multiple Choice)
4.9/5 (39)
According to the USA Today web page that tracks such occurrences, NFL quarterbacks are arrested less often (on average) than running backs, who, in turn, are arrested less often than linemen. The correlation coefficient r between a player's position and his number of arrests:
(Multiple Choice)
4.9/5 (31)
How well does the number of beers a student drinks predict his or her blood alcohol content? Sixteen student volunteers at The Ohio State University drank a randomly assigned number of cans of beer. Thirty minutes later, a police officer measured their blood alcohol content (BAC). A scatterplot of the data appears below. 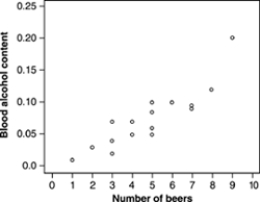 A plausible value of the correlation between number of beers and blood alcohol content, based on the scatterplot, is
(Multiple Choice)
4.9/5 (29)
An education researcher measured the IQ test scores of 78 seventh-grade students in a rural school, and also their school grade point average (GPA) measured on a 12-point scale. Here is a graph of GPA versus IQ for these students: 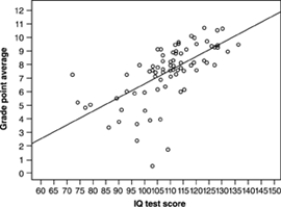 The IQ score of the student who has the lowest GPA is about
(Multiple Choice)
4.8/5 (36)
A nutrition study measuring how many helpings of vegetables each of 125 grade school children were served each week during a school year and their body mass index (BMI) scores found r = -0.13. This tells that:
(Multiple Choice)
4.8/5 (40)
All 753 students in grades 1 through 6 in an elementary school are given a math test that was designed for third graders. The heights of all 753 students are also recorded. We expect to see _______________ between height and test score.
(Multiple Choice)
4.9/5 (34)
An analyst gathers data on the number of hours of political debates watched per week and the sales of antacids. She expects that political debate watching will help explain antacid sales.
The plot of the data in the preceding question shows that people who watch more political debates tend to buy more antacids. The analyst calculates the correlation r between hours of debates and antacids purchased. A plausible value is:
(Multiple Choice)
4.9/5 (36)
Which of these is not true of the correlation r between the weight in pounds and gas mileage in miles-per-gallon for a sample of pickup trucks?
(Multiple Choice)
4.9/5 (34)
Which of the values below is impossible for the descriptive measure in question?
(Multiple Choice)
4.8/5 (35)
An education researcher measured the IQ test scores of 78 seventh-grade students in a rural school, and also their school grade point average (GPA) measured on a 12-point scale. Here is a graph of GPA versus IQ for these students:  One of these numbers is the correlation r between IQ score and GPA. Which is it?
(Multiple Choice)
4.7/5 (32)
Filters
- Essay(0)
- Multiple Choice(0)
- Short Answer(0)
- True False(0)
- Matching(0)