Deck 14: Univariate and Bivariate Analysis of Quantitative Data
Full screen (f)
Question
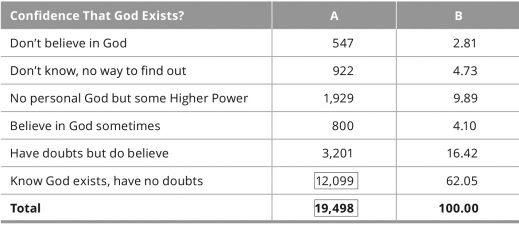
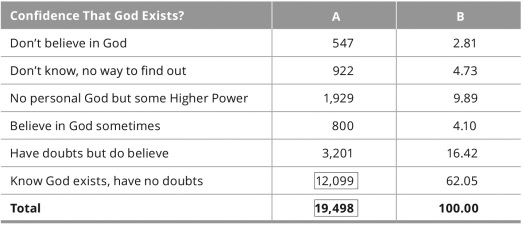
In this table,Column B indicates the ________ of each response.
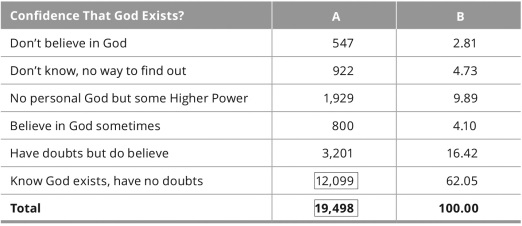
A)frequency
B)relative frequency
C)relative deviation
D)standard deviation
A)frequency
B)relative frequency
C)relative deviation
D)standard deviation
Question
Question
Question
Question
Question
Question
Question
In this table,Column A indicates the ________ of each response.
A)frequency
B)relative frequency
C)relative deviation
D)standard deviation
A)frequency
B)relative frequency
C)relative deviation
D)standard deviation
Question
Question
Willow has collected information from 12 members of a sorority on campus to see at what age they desire to marry.Here are the responses she collected:
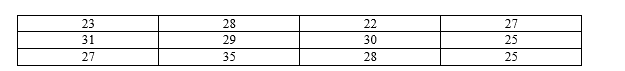 What is the range of the responses?
A)9
B)10
C)11
D)13
What is the range of the responses?A)9
B)10
C)11
D)13
Question
Question
Question
This table depicts a
A)standard deviation.
B)regression coefficient.
C)measure of central tendency.
D)frequency distribution.
A)standard deviation.
B)regression coefficient.
C)measure of central tendency.
D)frequency distribution.
Question
Question
Question
This graph displays a ________ distribution.
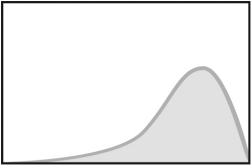
A)skewed right
B)skewed left
C)symmetric
D)bimodal
A)skewed right
B)skewed left
C)symmetric
D)bimodal
Question
Question
Question
Question
Question
Question
In the pictured cross-tabulation,what are the totals in the bottom row and right most column called?
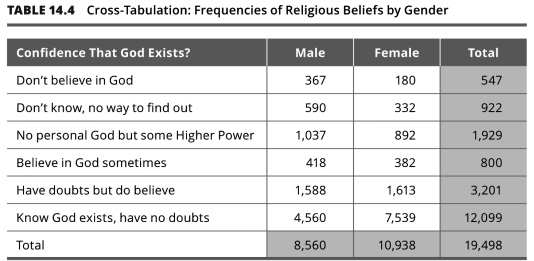
A)period effects
B)percentiles
C)marginal frequencies
D)conditional means
A)period effects
B)percentiles
C)marginal frequencies
D)conditional means
Question
Question
Question
Question
Question
Question
Question
Question
Question
Question
Question
Question
What type of graph is displayed below?
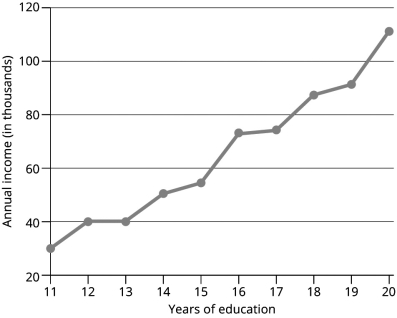
A)bar graph
B)histogram
C)line graph
D)pie chart
A)bar graph
B)histogram
C)line graph
D)pie chart
Question
Question
Question
Question
Question
Question
Question
Question
Question
Question
Question
Question
As this graph notes,there are big differences between cohorts,but since 1985 each cohort has also become more tolerant toward gay people over time.What type of effect is demonstrated with the increased tolerance over time within cohort?
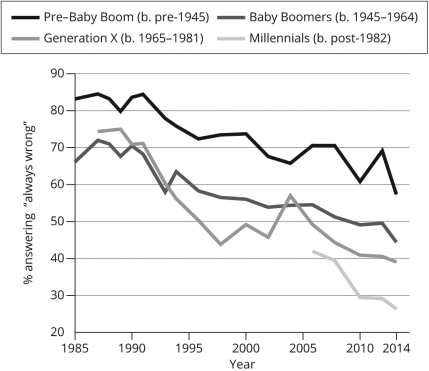
A)age
B)cross-sectional
C)panel
D)period
A)age
B)cross-sectional
C)panel
D)period
Question
Question
Question
Question
Question
Question
Question
Question

Unlock Deck
Sign up to unlock the cards in this deck!
Unlock Deck
Unlock Deck
1/54
Play
Full screen (f)
Deck 14: Univariate and Bivariate Analysis of Quantitative Data
1
In this table,Column B indicates the ________ of each response.
A)frequency
B)relative frequency
C)relative deviation
D)standard deviation
A)frequency
B)relative frequency
C)relative deviation
D)standard deviation
B
2
________ data analysis is the process by which substantive findings are drawn from numerical data.
A)Bivariate
B)Qualitative
C)Quantitative
D)Univariate
A)Bivariate
B)Qualitative
C)Quantitative
D)Univariate
C
3
Luna surveyed 5,000 public defenders in five U.S.cities and asked them to report their monthly incomes.If Luna has accurately determined that the median is the most appropriate measure of central tendency for this sample,this tells us that the income scores had a
A)bimodal distribution.
B)skewed distribution.
C)large standard deviation.
D)symmetric distribution.
A)bimodal distribution.
B)skewed distribution.
C)large standard deviation.
D)symmetric distribution.
B
4
Jerome has surveyed his friends to see the number of meals they've eaten at McDonald's in the past month.He received the following responses: 2,3,1,2,4,2,and 12.Twelve is an example of a/an
A)error.
B)outlier.
C)median.
D)mode.
A)error.
B)outlier.
C)median.
D)mode.
Unlock Deck
Unlock for access to all 54 flashcards in this deck.
Unlock Deck
k this deck
5
Dr.Liu wants to learn how well the students in his research methods class performed on their final exam.He ranked the 25 exam scores in order from lowest to highest,and then he examined the middle score.What measure of central tendency did Dr.Liu calculate?
A)mode
B)median
C)mean
D)standard deviation
A)mode
B)median
C)mean
D)standard deviation
Unlock Deck
Unlock for access to all 54 flashcards in this deck.
Unlock Deck
k this deck
6
Dr.Anderson has collected information on whether respondents voted in the 2016 presidential election.There are two answer choices (yes or no).Can she report a mean for this variable?
A)No,she should only report the median.
B)No,she should only report the mode.
C)No,she should only report the standard deviation.
D)Yes,she can report the proportion who voted and the proportion who did not vote.
A)No,she should only report the median.
B)No,she should only report the mode.
C)No,she should only report the standard deviation.
D)Yes,she can report the proportion who voted and the proportion who did not vote.
Unlock Deck
Unlock for access to all 54 flashcards in this deck.
Unlock Deck
k this deck
7
If a distribution of scores is skewed to the right,this indicates that the outliers
A)have especially high scores.
B)have especially low scores.
C)create a bimodal distribution above the mean.
D)create a bimodal distribution below the mean.
A)have especially high scores.
B)have especially low scores.
C)create a bimodal distribution above the mean.
D)create a bimodal distribution below the mean.
Unlock Deck
Unlock for access to all 54 flashcards in this deck.
Unlock Deck
k this deck
8
In this table,Column A indicates the ________ of each response.
A)frequency
B)relative frequency
C)relative deviation
D)standard deviation
A)frequency
B)relative frequency
C)relative deviation
D)standard deviation
Unlock Deck
Unlock for access to all 54 flashcards in this deck.
Unlock Deck
k this deck
9
Monique has collected data on how frequently students skip class at her university.She asked respondents to report the exact number of classes skipped in the past semester.She wants to create a graph to display the distribution of responses.What type of graph should she create?
A)pie chart
B)line graph
C)histogram
D)bar graph
A)pie chart
B)line graph
C)histogram
D)bar graph
Unlock Deck
Unlock for access to all 54 flashcards in this deck.
Unlock Deck
k this deck
10
Willow has collected information from 12 members of a sorority on campus to see at what age they desire to marry.Here are the responses she collected:
What is the range of the responses?
A)9
B)10
C)11
D)13
What is the range of the responses?A)9
B)10
C)11
D)13
Unlock Deck
Unlock for access to all 54 flashcards in this deck.
Unlock Deck
k this deck
11
You are curious about color preference among kindergarteners and have surveyed a class to see which color (pink,purple,blue,green,red,or yellow)is the favorite.Which measure of central tendency should you calculate for this variable?
A)mode
B)median
C)mean
D)standard deviation
A)mode
B)median
C)mean
D)standard deviation
Unlock Deck
Unlock for access to all 54 flashcards in this deck.
Unlock Deck
k this deck
12
Julia has collected data on how students at her university feel about the legalization of marijuana.Answers ranged from "strongly disagree" to "strongly agree." She wants to create a graph to display the distribution of responses.What type of graph should she create?
A)pie chart
B)line graph
C)histogram
D)bar graph
A)pie chart
B)line graph
C)histogram
D)bar graph
Unlock Deck
Unlock for access to all 54 flashcards in this deck.
Unlock Deck
k this deck
13
This table depicts a
A)standard deviation.
B)regression coefficient.
C)measure of central tendency.
D)frequency distribution.
A)standard deviation.
B)regression coefficient.
C)measure of central tendency.
D)frequency distribution.
Unlock Deck
Unlock for access to all 54 flashcards in this deck.
Unlock Deck
k this deck
14
How does univariate analysis differ from bivariate analysis?
A)Univariate analysis examines one variable,while bivariate analysis looks at the relationship between two variables.
B)Univariate analysis looks at the relationship between two variables,while bivariate analysis examines one variable.
C)Univariate analysis is a form of qualitative analysis,while bivariate analysis is a form of quantitative analysis.
D)Univariate analysis is a form of quantitative analysis,while bivariate analysis is a form of qualitative analysis.
Unlock Deck
Unlock for access to all 54 flashcards in this deck.
Unlock Deck
k this deck
15
Dr.Liu wants to learn how well the students in his research methods class performed on their final exam.He added together all 25 exam scores and then divided by 25.What measure of central tendency did Dr.Liu calculate?
A)mode
B)median
C)mean
D)standard deviation
A)mode
B)median
C)mean
D)standard deviation
Unlock Deck
Unlock for access to all 54 flashcards in this deck.
Unlock Deck
k this deck
16
This graph displays a ________ distribution.
A)skewed right
B)skewed left
C)symmetric
D)bimodal
A)skewed right
B)skewed left
C)symmetric
D)bimodal
Unlock Deck
Unlock for access to all 54 flashcards in this deck.
Unlock Deck
k this deck
17
Bita has asked a sample of 50 college sophomores how many close friends they have.Most of the scores range from 1 to 4,with two students reporting 0 close friends and 8 students reporting between 5 and 8 close friends.However,there is one student who reports having 27 close friends.When Bita presents her univariate results on the central tendency of this distribution,she should report the
A)mode.
B)median.
C)mean.
D)range.
A)mode.
B)median.
C)mean.
D)range.
Unlock Deck
Unlock for access to all 54 flashcards in this deck.
Unlock Deck
k this deck
18
A ________ is the most fundamental concept in univariate analysis.
A)distribution
B)measure of central tendency
C)regression coefficient
D)standard deviation
A)distribution
B)measure of central tendency
C)regression coefficient
D)standard deviation
Unlock Deck
Unlock for access to all 54 flashcards in this deck.
Unlock Deck
k this deck
19
The ________ is more sensitive to outliers than the ________ is.
A)mode;median
B)median;mode
C)median;mean
D)mean;median
A)mode;median
B)median;mode
C)median;mean
D)mean;median
Unlock Deck
Unlock for access to all 54 flashcards in this deck.
Unlock Deck
k this deck
20
If a research team has asked a sample of politicians to report the U.S.region in which they were born,the team should report the mode to indicate central tendency because region is a(n)________ variable.
A)categorical
B)dichotomous
C)ordinal
D)nominal
A)categorical
B)dichotomous
C)ordinal
D)nominal
Unlock Deck
Unlock for access to all 54 flashcards in this deck.
Unlock Deck
k this deck
21
________ analysis allows us to examine two variables simultaneously to see if one variable influences the other.
A)Bivariate
B)Qualitative
C)Quantitative
D)Univariate
A)Bivariate
B)Qualitative
C)Quantitative
D)Univariate
Unlock Deck
Unlock for access to all 54 flashcards in this deck.
Unlock Deck
k this deck
22
In the pictured cross-tabulation,what are the totals in the bottom row and right most column called?
A)period effects
B)percentiles
C)marginal frequencies
D)conditional means
A)period effects
B)percentiles
C)marginal frequencies
D)conditional means
Unlock Deck
Unlock for access to all 54 flashcards in this deck.
Unlock Deck
k this deck
23
Bivariate regression analysis expresses the ________ as a simple function of the ________.
A)independent variable;dependent variable
B)dependent variable;independent variable
C)row percentage;column percentage
D)column percentage;row percentage
A)independent variable;dependent variable
B)dependent variable;independent variable
C)row percentage;column percentage
D)column percentage;row percentage
Unlock Deck
Unlock for access to all 54 flashcards in this deck.
Unlock Deck
k this deck
24
Martin is creating a cross-tabulation of categorical variables,and he wants to compare groups to one another.He would like your advice on whether he should compare frequencies or percentages.You suggest that he compare
A)frequencies because it allows for clearer comparison of groups of each size.
B)frequencies because it allows for clear understanding of the size of each group.
C)percentages because it allows for clearer comparison of groups of each size.
D)percentages because it allows for clear understanding of the size of each group.
Unlock Deck
Unlock for access to all 54 flashcards in this deck.
Unlock Deck
k this deck
25
Benjamin is studying the influence of age on weekly hours of television viewing.Using a statistical software program to estimate the slope for age on voting,he derives the following regression equation:
Weekly TV Hours = 2.35 + (0.16 * Age)
As your textbook notes,the regression coefficient,or slope,can be used to calculate
The expected value of the dependent variable (in this case,TV hours)for a given
Value of the independent variable (in this case,age).If a person is 63 years old,what would his or her expected number of TV hours be?
A)10.08
B)12.43
C)23.69
D)7.73
Unlock Deck
Unlock for access to all 54 flashcards in this deck.
Unlock Deck
k this deck
26
The margin of error increases when the sample size ________ and the variation in a variable ________.
A)increases;increases
B)decreases;decreases
C)decreases;increases
D)increases;decreases
A)increases;increases
B)decreases;decreases
C)decreases;increases
D)increases;decreases
Unlock Deck
Unlock for access to all 54 flashcards in this deck.
Unlock Deck
k this deck
27
Radka has collected data on the conditional mean of weekly hours of exercise,comparing those under 75 years of age and those 75 years or older.She observes a higher mean number of weekly exercise hours for the younger group.Because the sample of respondents 75 or older is much smaller than the sample of those under 75,the error bar is much wider for the older than for the younger respondents.Radka needs to check for whether the two groups' error bars overlap,because if they do,
A)that could indicate that the older groups' scores are more highly skewed.
B)it reduces confidence that the observed group differences weren't due to chance.
C)the types of exercise that differ by age could bias reported exercise hours.
D)that could indicate that there is a smaller standard deviation for the older group.
Unlock Deck
Unlock for access to all 54 flashcards in this deck.
Unlock Deck
k this deck
28
Rene compares the income distributions of male and female dentists.She finds that,among dentists,men's average income is higher than women's,but that the standard deviation of women's income is larger than the standard deviation of men's income.These results tell us that
A)there is more variation in women's income than men's income.
B)women's income is skewed,so average comparisons are inaccurate.
C)men's income is skewed,so women and men make about the same income.
D)the range of men's income is larger than the range of women's income.
A)there is more variation in women's income than men's income.
B)women's income is skewed,so average comparisons are inaccurate.
C)men's income is skewed,so women and men make about the same income.
D)the range of men's income is larger than the range of women's income.
Unlock Deck
Unlock for access to all 54 flashcards in this deck.
Unlock Deck
k this deck
29
The Houston Area Survey is conducted annually by the Kinder Institute at Rice University.A representative sample is surveyed each year,and the Houston Area Survey is a rich source of data on how Houstonians have changed over time.What type of study is the Houston Area Survey?
A)one-time cross-sectional survey
B)repeated cross-sectional survey
C)one-time panel survey
D)repeated panel survey
A)one-time cross-sectional survey
B)repeated cross-sectional survey
C)one-time panel survey
D)repeated panel survey
Unlock Deck
Unlock for access to all 54 flashcards in this deck.
Unlock Deck
k this deck
30
You have collected sample data on the mean number of hookups students had in the last year.If the mean is 3 and the margin of error is 0.5,what would the 95% confidence interval be?
A)2.0 to 3.0
B)2.5 to 3.0
C)2.5 to 3.5
D)3.0 to 3.5
A)2.0 to 3.0
B)2.5 to 3.0
C)2.5 to 3.5
D)3.0 to 3.5
Unlock Deck
Unlock for access to all 54 flashcards in this deck.
Unlock Deck
k this deck
31
Nadia has collected data on whether students study abroad and whether their major is a foreign language.She has created a cross-tabulation with foreign language as the column and studying abroad as the row.She wants to compare foreign language majors to nonmajors.Which percentage should she use?
A)cell
B)column
C)marginal
D)row
A)cell
B)column
C)marginal
D)row
Unlock Deck
Unlock for access to all 54 flashcards in this deck.
Unlock Deck
k this deck
32
A local high school wants to compare the average GPA of female students to that of male students.What statistic should it calculate?
A)conditional means
B)conditional modes
C)column percentages
D)row percentages
A)conditional means
B)conditional modes
C)column percentages
D)row percentages
Unlock Deck
Unlock for access to all 54 flashcards in this deck.
Unlock Deck
k this deck
33
The ________ is the value of the 50th percentile.
A)mode
B)mean
C)median
D)standard deviation
A)mode
B)mean
C)median
D)standard deviation
Unlock Deck
Unlock for access to all 54 flashcards in this deck.
Unlock Deck
k this deck
34
What type of graph is displayed below?
A)bar graph
B)histogram
C)line graph
D)pie chart
A)bar graph
B)histogram
C)line graph
D)pie chart
Unlock Deck
Unlock for access to all 54 flashcards in this deck.
Unlock Deck
k this deck
35
________ show the 95% confidence intervals for conditional means.
A)Percentiles
B)Marginal frequencies
C)Column percentages
D)Error bars
A)Percentiles
B)Marginal frequencies
C)Column percentages
D)Error bars
Unlock Deck
Unlock for access to all 54 flashcards in this deck.
Unlock Deck
k this deck
36
Population trends are bivariate patterns in which one of the variables is
A)gender.
B)race.
C)social class.
D)time.
A)gender.
B)race.
C)social class.
D)time.
Unlock Deck
Unlock for access to all 54 flashcards in this deck.
Unlock Deck
k this deck
37
If you want to compare groups in a cross-tabulation,you should use ________ or ________ percentages.
A)cell;row
B)cell;marginal
C)column;cell
D)column;row
A)cell;row
B)cell;marginal
C)column;cell
D)column;row
Unlock Deck
Unlock for access to all 54 flashcards in this deck.
Unlock Deck
k this deck
38
The cross-tabulation is using ________ percentages.
A)cell
B)column
C)marginal
D)row
A)cell
B)column
C)marginal
D)row
Unlock Deck
Unlock for access to all 54 flashcards in this deck.
Unlock Deck
k this deck
39
Dr.Raza wants to present data on how college hookups vary by social class.What would you recommend as the simplest way to present the comparison between the groups?
A)pie chart
B)line graph
C)frequency distribution
D)cross-tabulation
A)pie chart
B)line graph
C)frequency distribution
D)cross-tabulation
Unlock Deck
Unlock for access to all 54 flashcards in this deck.
Unlock Deck
k this deck
40
You are presenting results of a study on income inequality to the local community,the members of which have little to no statistical training.Which measure of variation would be the best for you to use to describe the variation in income to the community?
A)mean
B)percentile
C)range
D)standard deviation
A)mean
B)percentile
C)range
D)standard deviation
Unlock Deck
Unlock for access to all 54 flashcards in this deck.
Unlock Deck
k this deck
41
A study uses a repeated cross-sectional survey to study changes in attitudes toward nonmarital cohabitation over time.The results show that in more recent years,people have become more accepting of unmarried couples living together.To the extent that this increased acceptance is due to cohort replacement,the feature of the cross-sectional design that helps us to understand the change in attitudes over time is that repeated cross-sectional surveys
A)survey different people in each data collection over time.
B)survey the original respondents,but also add new respondents each time.
C)reduce the number of respondents with each new data collection period.
D)oversample younger people in each additional data collection period.
A)survey different people in each data collection over time.
B)survey the original respondents,but also add new respondents each time.
C)reduce the number of respondents with each new data collection period.
D)oversample younger people in each additional data collection period.
Unlock Deck
Unlock for access to all 54 flashcards in this deck.
Unlock Deck
k this deck
42
Explain why it is important for sociologists to have a healthy skepticism about the statistics we encounter daily.
Unlock Deck
Unlock for access to all 54 flashcards in this deck.
Unlock Deck
k this deck
43
You are interested in studying time spent on social media among college students and have collected the following information:
Hours spent on social media each day: 0,1,1,1,2,2,2,2,3,3,3,3,4,4,20
Please calculate the mean and median.Then,determine which measure of central tendency you think best represents the "average" number of hours students spend on social media daily.Justify your choice.
Hours spent on social media each day: 0,1,1,1,2,2,2,2,3,3,3,3,4,4,20
Please calculate the mean and median.Then,determine which measure of central tendency you think best represents the "average" number of hours students spend on social media daily.Justify your choice.
Unlock Deck
Unlock for access to all 54 flashcards in this deck.
Unlock Deck
k this deck
44
Define the terms standard deviation and percentiles.Then,evaluate which measure you think best describes variation to the average American.Justify your choice.
Unlock Deck
Unlock for access to all 54 flashcards in this deck.
Unlock Deck
k this deck
45
Knowing a variable's ________ is incredibly valuable;it allows us to talk about possible values,averages,and variation,as well as describe differences among groups.
A)distribution
B)measures of central tendency
C)range
D)regression coefficient
A)distribution
B)measures of central tendency
C)range
D)regression coefficient
Unlock Deck
Unlock for access to all 54 flashcards in this deck.
Unlock Deck
k this deck
46
As this graph notes,there are big differences between cohorts,but since 1985 each cohort has also become more tolerant toward gay people over time.What type of effect is demonstrated with the increased tolerance over time within cohort?
A)age
B)cross-sectional
C)panel
D)period
A)age
B)cross-sectional
C)panel
D)period
Unlock Deck
Unlock for access to all 54 flashcards in this deck.
Unlock Deck
k this deck
47
Consider a study of how gender (male = 0;female = 1)might predict weekly hours of household labor (child care,cooking,cleaning,grocery shopping,etc. ).First,identify the measure of central tendency you would report for each variable at the univariate level and explain why.Second,explain what it would mean if the standard deviation of the household work hours for men was a larger value than the standard deviation for women's household work hours.Finally,regarding the relationship between gender and weekly hours of housework,explain the difference between the bivariate correlation and the regression coefficient.
Unlock Deck
Unlock for access to all 54 flashcards in this deck.
Unlock Deck
k this deck
48
________ statistics often receive extended media exposure and are the most likely to grab the public's attention.
A)Accurate
B)Expected
C)Repeated
D)Surprising
A)Accurate
B)Expected
C)Repeated
D)Surprising
Unlock Deck
Unlock for access to all 54 flashcards in this deck.
Unlock Deck
k this deck
49
Using an example,distinguish between an age effect and a period effect.
Unlock Deck
Unlock for access to all 54 flashcards in this deck.
Unlock Deck
k this deck
50
You are interested in studying gender role attitudes over time in the United States.Would you conduct repeated cross-sectional surveys or panel surveys? Choose one,and justify it as the superior approach for this topic.
Unlock Deck
Unlock for access to all 54 flashcards in this deck.
Unlock Deck
k this deck
51
Compare and contrast bivariate regression analysis to correlation.Offer one point of comparison and one point of contrast.
Unlock Deck
Unlock for access to all 54 flashcards in this deck.
Unlock Deck
k this deck
52
________ replacement occurs when younger people who enter the survey population by becoming adults have systematically different attitudes than older people who exit the population by death.
A)Age
B)Cohort
C)Cross-sectional
D)Panel
A)Age
B)Cohort
C)Cross-sectional
D)Panel
Unlock Deck
Unlock for access to all 54 flashcards in this deck.
Unlock Deck
k this deck
53
Data from the General Social Survey reveals that as Americans grow older,they profess to be more religious.This is an example of a(n)________ effect.
A)age
B)cross-sectional
C)panel
D)period
A)age
B)cross-sectional
C)panel
D)period
Unlock Deck
Unlock for access to all 54 flashcards in this deck.
Unlock Deck
k this deck
54
Should researchers report means of ordinal variables? Why or why not?
Unlock Deck
Unlock for access to all 54 flashcards in this deck.
Unlock Deck
k this deck
Unlock Deck
Unlock for access to all 54 flashcards in this deck.


