Exam 14: Univariate and Bivariate Analysis of Quantitative Data
Exam 1: The Art and Science of Social Research: An Introduction58 Questions
Exam 2: Research Foundations: Linking Sociological Theory to Research57 Questions
Exam 3: Ethical Issues in Social Science Research59 Questions
Exam 4: From Concepts to Models: Hypotheses, Operationalization, and Measurement55 Questions
Exam 5: Evaluating Research: Reliability and Validity39 Questions
Exam 6: Sampling Strategies48 Questions
Exam 8: Experimental Research69 Questions
Exam 9: Evaluation Research45 Questions
Exam 10: Ethnography59 Questions
Exam 11: In-Depth Interviewing59 Questions
Exam 12: Materials-Based Methods61 Questions
Exam 13: Social Network Analysis61 Questions
Exam 14: Univariate and Bivariate Analysis of Quantitative Data54 Questions
Exam 15: Multivariate and Advanced Quantitative Methods55 Questions
Exam 16: Analysis of Qualitative Data55 Questions
Exam 17: Communicating Social Science Research Findings57 Questions
Select questions type
The margin of error increases when the sample size ________ and the variation in a variable ________.
Free
(Multiple Choice)
4.8/5  (37)
(37)
Correct Answer: Verified
C
The ________ is more sensitive to outliers than the ________ is.
Free
(Multiple Choice)
4.8/5 (33)
Correct Answer:Verified
D
You are interested in studying gender role attitudes over time in the United States.Would you conduct repeated cross-sectional surveys or panel surveys? Choose one,and justify it as the superior approach for this topic.
Free
(Essay)
4.8/5 (39)
Correct Answer:Verified
Answers can vary.If students want to study how the American population has changed over time with regard to gender role attitudes,repeated cross-sectional surveys should be chosen.If students want to study how individuals' gender role attitudes change over time,panel surveys should be chosen.
Dr.Raza wants to present data on how college hookups vary by social class.What would you recommend as the simplest way to present the comparison between the groups?
(Multiple Choice)
4.8/5 (32)
If a distribution of scores is skewed to the right,this indicates that the outliers
(Multiple Choice)
4.8/5 (38)
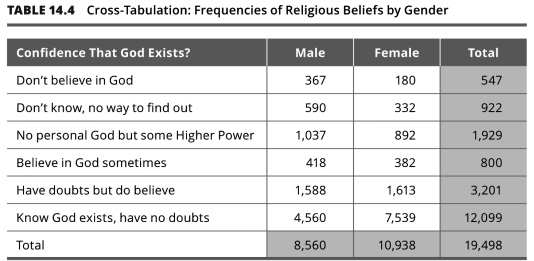
In the pictured cross-tabulation,what are the totals in the bottom row and right most column called?
(Multiple Choice)
4.8/5 (38)
Martin is creating a cross-tabulation of categorical variables,and he wants to compare groups to one another.He would like your advice on whether he should compare frequencies or percentages.You suggest that he compare
(Multiple Choice)
4.8/5 (41)
How does univariate analysis differ from bivariate analysis?
(Multiple Choice)
4.7/5 (37)
Nadia has collected data on whether students study abroad and whether their major is a foreign language.She has created a cross-tabulation with foreign language as the column and studying abroad as the row.She wants to compare foreign language majors to nonmajors.Which percentage should she use?
(Multiple Choice)
4.9/5 (32)
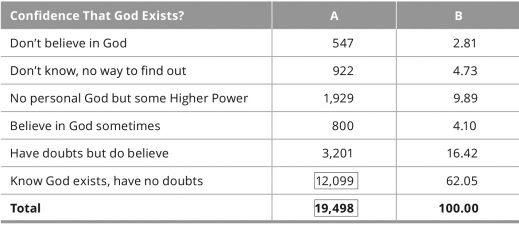
In this table,Column A indicates the ________ of each response.
(Multiple Choice)
4.9/5 (30)
________ analysis allows us to examine two variables simultaneously to see if one variable influences the other.
(Multiple Choice)
4.8/5 (35)
Should researchers report means of ordinal variables? Why or why not?
(Essay)
4.8/5 (38)
A local high school wants to compare the average GPA of female students to that of male students.What statistic should it calculate?
(Multiple Choice)
4.8/5 (30)
Population trends are bivariate patterns in which one of the variables is
(Multiple Choice)
4.8/5 (31)
You have collected sample data on the mean number of hookups students had in the last year.If the mean is 3 and the margin of error is 0.5,what would the 95% confidence interval be?
(Multiple Choice)
4.8/5 (28)
You are curious about color preference among kindergarteners and have surveyed a class to see which color (pink,purple,blue,green,red,or yellow)is the favorite.Which measure of central tendency should you calculate for this variable?
(Multiple Choice)
4.9/5 (31)
Julia has collected data on how students at her university feel about the legalization of marijuana.Answers ranged from "strongly disagree" to "strongly agree." She wants to create a graph to display the distribution of responses.What type of graph should she create?
(Multiple Choice)
4.8/5 (26)
________ data analysis is the process by which substantive findings are drawn from numerical data.
(Multiple Choice)
4.8/5 (31)
You are interested in studying time spent on social media among college students and have collected the following information:
Hours spent on social media each day: 0,1,1,1,2,2,2,2,3,3,3,3,4,4,20
Please calculate the mean and median.Then,determine which measure of central tendency you think best represents the "average" number of hours students spend on social media daily.Justify your choice.
(Essay)
4.8/5 (28)
Consider a study of how gender (male = 0;female = 1)might predict weekly hours of household labor (child care,cooking,cleaning,grocery shopping,etc. ).First,identify the measure of central tendency you would report for each variable at the univariate level and explain why.Second,explain what it would mean if the standard deviation of the household work hours for men was a larger value than the standard deviation for women's household work hours.Finally,regarding the relationship between gender and weekly hours of housework,explain the difference between the bivariate correlation and the regression coefficient.
(Essay)
4.8/5 (37)
Filters
- Essay(0)
- Multiple Choice(0)
- Short Answer(0)
- True False(0)
- Matching(0)