Deck 3: Demand, Supply, and Market Equilibrium
Full screen (f)
Question
Question
Question
Question
Question
Question
Question
Question
Question
Question
Question
Question
Question
Question
Question
Question
Question
Question
Question
Question
Question
Refer to the information provided in Figure 3.6 below to answer the questions that follow. 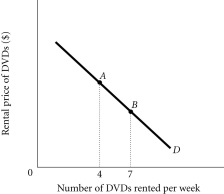 Figure 3.6
Refer to Figure 3.6. The number of DVDs Isabel rents per week increases from 4 to 7. This is caused by
A) an increase in income if DVDs are a normal good.
B) a decrease in the price of popcorn, which is a complement to DVDs.
C) a decrease in the rental price of DVDs.
D) either A or B.
Figure 3.6Refer to Figure 3.6. The number of DVDs Isabel rents per week increases from 4 to 7. This is caused by
A) an increase in income if DVDs are a normal good.
B) a decrease in the price of popcorn, which is a complement to DVDs.
C) a decrease in the rental price of DVDs.
D) either A or B.
Question
Refer to the information provided in Figure 3.3 below to answer the questions that follow. 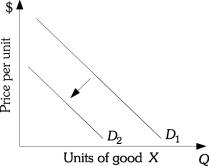 Figure 3.3
Refer to Figure 3.3. As your income increased, the demand for X shifted from D1 to D2. Good X is
A) an inferior good.
B) a normal good.
C) a luxury good.
D) an income-neutral good.
Figure 3.3Refer to Figure 3.3. As your income increased, the demand for X shifted from D1 to D2. Good X is
A) an inferior good.
B) a normal good.
C) a luxury good.
D) an income-neutral good.
Question
Question
Question
Question
Question
Question
Refer to the information provided in Figure 3.2 below to answer the questions that follow. 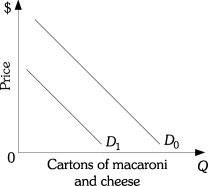 Figure 3.2
Refer to Figure 3.2. Which of the following would be most likely to cause the demand for macaroni and cheese to shift from D1 to D0?
A) an increase in the price of macaroni and cheese
B) an increase in the price of flour used to make macaroni and cheese
C) an increase in income, assuming macaroni and cheese is a normal good
D) an increase in the quantity demanded for macaroni and cheese
Figure 3.2Refer to Figure 3.2. Which of the following would be most likely to cause the demand for macaroni and cheese to shift from D1 to D0?
A) an increase in the price of macaroni and cheese
B) an increase in the price of flour used to make macaroni and cheese
C) an increase in income, assuming macaroni and cheese is a normal good
D) an increase in the quantity demanded for macaroni and cheese
Question
Question
Question
Question
Refer to the information provided in Figure 3.5 below to answer the questions that follow. 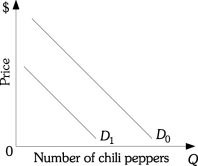 Figure 3.5
Refer to Figure 3.5. If consumer income increases, the demand for chili peppers shifts from D0 to D1. This implies that chili peppers are a(n)
A) normal good.
B) inferior good.
C) substitute good.
D) complementary good.
Figure 3.5Refer to Figure 3.5. If consumer income increases, the demand for chili peppers shifts from D0 to D1. This implies that chili peppers are a(n)
A) normal good.
B) inferior good.
C) substitute good.
D) complementary good.
Question
Question
Question
Refer to the information provided in Figure 3.1 below to answer the questions that follow. 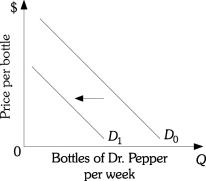 Figure 3.1
Refer to Figure 3.1. Which of the following would be most likely to cause the demand for Dr. Pepper to shift from D0 to D1?
A) a decrease in income, assuming that Dr. Pepper is a normal good
B) an increase in the price of 7-UP, assuming 7-UP is a substitute for Dr. Pepper
C) a decrease in the price of Dr. Pepper
D) a reduction in the price of sugar used to make Dr. Pepper
Figure 3.1Refer to Figure 3.1. Which of the following would be most likely to cause the demand for Dr. Pepper to shift from D0 to D1?
A) a decrease in income, assuming that Dr. Pepper is a normal good
B) an increase in the price of 7-UP, assuming 7-UP is a substitute for Dr. Pepper
C) a decrease in the price of Dr. Pepper
D) a reduction in the price of sugar used to make Dr. Pepper
Question
Question
Question
Question
Question
Refer to the information provided in Figure 3.4 below to answer the questions that follow. 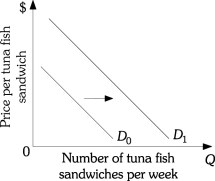 Figure 3.4
Refer to Figure 3.4. If consumer income falls, the demand for tuna fish sandwiches shifts from D0 to D1. This implies that tuna fish sandwiches are a(n)
A) normal good.
B) inferior good.
C) substitute good.
D) complementary good.
Figure 3.4Refer to Figure 3.4. If consumer income falls, the demand for tuna fish sandwiches shifts from D0 to D1. This implies that tuna fish sandwiches are a(n)
A) normal good.
B) inferior good.
C) substitute good.
D) complementary good.
Question
Refer to the information provided in Figure 3.7 below to answer the following questions. 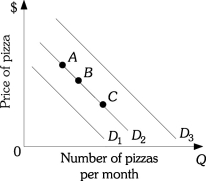 Figure 3.7
Refer to Figure 3.7. An increase in quantity demanded is represented by movement
A) from D2 to D1.
B) from D2 to D3.
C) along D2 from Point B to point A.
D) along D2 from Point B to point C.
Figure 3.7Refer to Figure 3.7. An increase in quantity demanded is represented by movement
A) from D2 to D1.
B) from D2 to D3.
C) along D2 from Point B to point A.
D) along D2 from Point B to point C.
Question
Refer to the information provided in Figure 3.7 below to answer the following questions. Figure 3.7
Refer to Figure 3.7. A decrease in demand is represented by the movement
A) from D2 to D1.
B) from D2 to D3.
C) along D2 from Point B to Point A.
D) along D2 from Point B to Point C.
Figure 3.7Refer to Figure 3.7. A decrease in demand is represented by the movement
A) from D2 to D1.
B) from D2 to D3.
C) along D2 from Point B to Point A.
D) along D2 from Point B to Point C.
Question
Question
Question
Refer to the information provided in Figure 3.7 below to answer the following questions. Figure 3.7
Refer to Figure 3.7. A movement from Point C to Point B on demand curve D2 would be caused by a(n)
A) decrease in income, assuming pizza is a normal good.
B) decrease in the price of hamburgers, assuming that pizza and hamburgers are substitutes.
C) decrease in the price of pizza.
D) increase in the price of pizza.
Figure 3.7Refer to Figure 3.7. A movement from Point C to Point B on demand curve D2 would be caused by a(n)
A) decrease in income, assuming pizza is a normal good.
B) decrease in the price of hamburgers, assuming that pizza and hamburgers are substitutes.
C) decrease in the price of pizza.
D) increase in the price of pizza.
Question
Question
Refer to the information provided in Figure 3.8 below to answer the following questions. 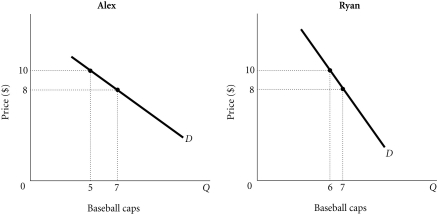 Figure 3.8
Refer to Figure 3.8. Assume that there are only two people in the market for baseball caps: Alex and Ryan. Along the market demand curve for baseball caps, at a price of ________, quantity demanded would be ________.
A) $10; 7
B) $10; 11
C) $8; 12
D) $8; 13
Figure 3.8Refer to Figure 3.8. Assume that there are only two people in the market for baseball caps: Alex and Ryan. Along the market demand curve for baseball caps, at a price of ________, quantity demanded would be ________.
A) $10; 7
B) $10; 11
C) $8; 12
D) $8; 13
Question
Question
Question
Question
Refer to the information provided in Figure 3.9 below to answer the following questions. 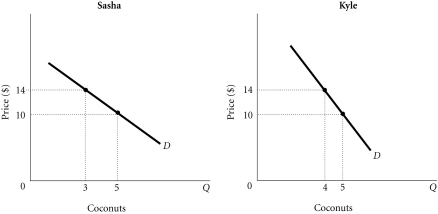 Figure 3.9
Refer to Figure 3.9. Assume there are only two people in the market for coconuts: Sasha and Kyle. Along the market demand curve for coconuts, at a price of ________, quantity demanded would be ________.
A) $10; 9
B) $10; 10
C) $14; 9
D) $14; 8
Figure 3.9Refer to Figure 3.9. Assume there are only two people in the market for coconuts: Sasha and Kyle. Along the market demand curve for coconuts, at a price of ________, quantity demanded would be ________.
A) $10; 9
B) $10; 10
C) $14; 9
D) $14; 8
Question
Question
Refer to the information provided in Figure 3.7 below to answer the following questions. Figure 3.7
Refer to Figure 3.7. If pizza and hamburgers are substitutes, an increase in the price of hamburgers will cause a movement from Point B on demand curve D2 to
A) demand curve D1.
B) demand curve D3.
C) Point A on demand curve D2.
D) Point C on demand curve D2.
Figure 3.7Refer to Figure 3.7. If pizza and hamburgers are substitutes, an increase in the price of hamburgers will cause a movement from Point B on demand curve D2 to
A) demand curve D1.
B) demand curve D3.
C) Point A on demand curve D2.
D) Point C on demand curve D2.
Question
Question
Refer to the information provided in Figure 3.7 below to answer the following questions. Figure 3.7
Refer to Figure 3.7. Assume the market is initially at Point B and that pizza is a normal good. A decrease in income would cause the market to move from Point B on demand curve D2 to
A) demand curve D1.
B) demand curve D3.
C) Point A on demand curve D2.
D) Point C on demand curve D2.
Figure 3.7Refer to Figure 3.7. Assume the market is initially at Point B and that pizza is a normal good. A decrease in income would cause the market to move from Point B on demand curve D2 to
A) demand curve D1.
B) demand curve D3.
C) Point A on demand curve D2.
D) Point C on demand curve D2.
Question
Question
Refer to the information provided in Figure 3.8 below to answer the following questions. Figure 3.8
Refer to Figure 3.8. Assume there are only two people in the market for baseball caps: Alex and Ryan. Along the market demand curve for baseball caps, at a price of ________, quantity demanded would be ________.
A) $10; 6
B) $10; 12
C) $8; 14
D) $8; 25
Figure 3.8Refer to Figure 3.8. Assume there are only two people in the market for baseball caps: Alex and Ryan. Along the market demand curve for baseball caps, at a price of ________, quantity demanded would be ________.
A) $10; 6
B) $10; 12
C) $8; 14
D) $8; 25
Question
Question
Refer to the information provided in Figure 3.9 below to answer the following questions. Figure 3.9
Refer to Figure 3.9. Assume that there are only two people in the market for coconuts: Sasha and Kyle. Along the market demand curve for coconuts, at a price of ________, quantity demanded would be ________.
A) $14; 7
B) $14; 9
C) $10; 9
D) $10; 8
Figure 3.9Refer to Figure 3.9. Assume that there are only two people in the market for coconuts: Sasha and Kyle. Along the market demand curve for coconuts, at a price of ________, quantity demanded would be ________.
A) $14; 7
B) $14; 9
C) $10; 9
D) $10; 8
Question
Refer to the information provided in Figure 3.7 below to answer the following questions. Figure 3.7
Refer to Figure 3.7. If pizza and beer are complementary goods, a decrease in the price of beer will cause a movement from Point B on demand curve D2 to
A) demand curve D1.
B) demand curve D3.
C) Point A on demand curve D2.
D) Point C on demand curve D2.
Figure 3.7Refer to Figure 3.7. If pizza and beer are complementary goods, a decrease in the price of beer will cause a movement from Point B on demand curve D2 to
A) demand curve D1.
B) demand curve D3.
C) Point A on demand curve D2.
D) Point C on demand curve D2.
Question
Question
Question
Question
Question
Refer to the information provided in Figure 3.11 below to answer the questions that follow. 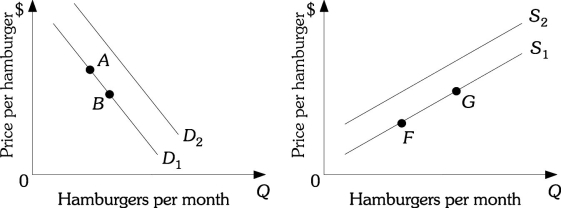 Figure 3.11
Refer to Figure 3.11. Assume hamburgers are a normal good. An increase in income will cause a movement from
A) Point A to Point B.
B) Point G to Point F.
C) D1 to D2.
D) S1 to S2.
Figure 3.11Refer to Figure 3.11. Assume hamburgers are a normal good. An increase in income will cause a movement from
A) Point A to Point B.
B) Point G to Point F.
C) D1 to D2.
D) S1 to S2.
Question
Refer to the information provided in Figure 3.16 below to answer the questions that follow. 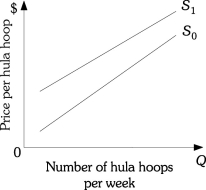 Figure 3.16
Refer to Figure 3.16. The supply curve for hula hoops shifts from S0 to S1. This could be caused by
A) an decrease in the price of hula hoops.
B) a decrease in the number of firms selling hula hoops.
C) a decrease in the demand for hula hoops.
D) either B or C.
Figure 3.16Refer to Figure 3.16. The supply curve for hula hoops shifts from S0 to S1. This could be caused by
A) an decrease in the price of hula hoops.
B) a decrease in the number of firms selling hula hoops.
C) a decrease in the demand for hula hoops.
D) either B or C.
Question
Refer to the information provided in Figure 3.14 below to answer the following questions. 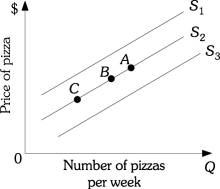 Figure 3.14
Refer to Figure 3.14. A decrease in the wage rate of pizza makers will cause a movement from Point B on supply curve S2 to
A) Point A on supply curve S2.
B) Point B on supply curve S2.
C) supply curve S3.
D) supply curve S1.
Figure 3.14Refer to Figure 3.14. A decrease in the wage rate of pizza makers will cause a movement from Point B on supply curve S2 to
A) Point A on supply curve S2.
B) Point B on supply curve S2.
C) supply curve S3.
D) supply curve S1.
Question
Refer to the information provided in Figure 3.14 below to answer the following questions. Figure 3.14
Refer to Figure 3.14. A movement from Point A to Point B on supply curve S2 would be caused by a(n)
A) increase in the price of pizza.
B) decrease in the demand for pizza.
C) increase in the price of pizza dough.
D) increase in the price of hamburgers, assuming hamburgers are a substitute for pizza.
Figure 3.14Refer to Figure 3.14. A movement from Point A to Point B on supply curve S2 would be caused by a(n)
A) increase in the price of pizza.
B) decrease in the demand for pizza.
C) increase in the price of pizza dough.
D) increase in the price of hamburgers, assuming hamburgers are a substitute for pizza.
Question
Refer to the information provided in Figure 3.14 below to answer the following questions. Figure 3.14
Refer to Figure 3.14. A decrease in quantity supplied is represented by a movement from
A) S2 to S3.
B) S2 to S1.
C) Point B to Point A along supply curve S2.
D) Point B to Point C along supply curve S2.
Figure 3.14Refer to Figure 3.14. A decrease in quantity supplied is represented by a movement from
A) S2 to S3.
B) S2 to S1.
C) Point B to Point A along supply curve S2.
D) Point B to Point C along supply curve S2.
Question
Question
Refer to the information provided in Figure 3.14 below to answer the following questions. Figure 3.14
Refer to Figure 3.14. An increase in supply is represented by the movement from
A) S2 to S3.
B) S2 to S1.
C) Point B to Point A along supply curve S2.
D) Point B to Point C along supply curve S2.
Figure 3.14Refer to Figure 3.14. An increase in supply is represented by the movement from
A) S2 to S3.
B) S2 to S1.
C) Point B to Point A along supply curve S2.
D) Point B to Point C along supply curve S2.
Question
Refer to the information provided in Figure 3.15 below to answer the following questions. 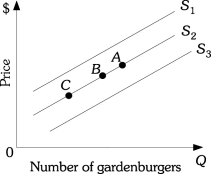 Figure 3.15
Refer to Figure 3.15. An increase in quantity supplied is represented by a movement from
A) S2 to S1.
B) S2 to S3.
C) Point B to Point A along supply curve S2.
D) Point B to Point C along supply curve S2.
Figure 3.15Refer to Figure 3.15. An increase in quantity supplied is represented by a movement from
A) S2 to S1.
B) S2 to S3.
C) Point B to Point A along supply curve S2.
D) Point B to Point C along supply curve S2.
Question
Refer to the information provided in Figure 3.15 below to answer the following questions. Figure 3.15
Refer to Figure 3.15. An increase in the wage rate of gardenburger makers will cause a movement from Point B on supply curve S2 to
A) Point A on supply curve S2.
B) Point C on supply curve S2.
C) supply curve S3.
D) supply curve S1.
Figure 3.15Refer to Figure 3.15. An increase in the wage rate of gardenburger makers will cause a movement from Point B on supply curve S2 to
A) Point A on supply curve S2.
B) Point C on supply curve S2.
C) supply curve S3.
D) supply curve S1.
Question
Question
Refer to the information provided in Figure 3.11 below to answer the questions that follow. Figure 3.11
Refer to Figure 3.11. Assume hamburgers and hot dogs are substitutes. A decrease in the price of hot dogs will cause a movement from
A) Point A to Point B.
B) Point F to Point G.
C) D2 to D1.
D) D1 to D2.
Figure 3.11Refer to Figure 3.11. Assume hamburgers and hot dogs are substitutes. A decrease in the price of hot dogs will cause a movement from
A) Point A to Point B.
B) Point F to Point G.
C) D2 to D1.
D) D1 to D2.
Question
Refer to the information provided in Figure 3.14 below to answer the following questions. Figure 3.14
Refer to Figure 3.14. An increase in the price of pizza sauce will cause a movement from Point B on supply curve S2 to
A) supply curve S3.
B) supply curve S1.
C) Point A on supply curve S2.
D) Point C on supply curve S2.
Figure 3.14Refer to Figure 3.14. An increase in the price of pizza sauce will cause a movement from Point B on supply curve S2 to
A) supply curve S3.
B) supply curve S1.
C) Point A on supply curve S2.
D) Point C on supply curve S2.
Question
Refer to the information provided in Figure 3.15 below to answer the following questions. Figure 3.15
Refer to Figure 3.15. A decrease in supply is represented by the movement from
A) S2 to S3.
B) S2 to S1.
C) Point B to Point A along supply curve S2.
D) Point B to Point C along supply curve S2.
Figure 3.15Refer to Figure 3.15. A decrease in supply is represented by the movement from
A) S2 to S3.
B) S2 to S1.
C) Point B to Point A along supply curve S2.
D) Point B to Point C along supply curve S2.
Question
Refer to the information provided in Figure 3.15 below to answer the following questions. Figure 3.15
Refer to Figure 3.15. A movement from Point C to Point B on supply curve S2 would be caused by a(n)
A) decrease in the price of gardenburgers.
B) increase in the demand for gardenburgers.
C) decrease in the price of mushrooms.
D) decrease in the price of hamburgers, assuming hamburgers are a substitute for pizza.
Figure 3.15Refer to Figure 3.15. A movement from Point C to Point B on supply curve S2 would be caused by a(n)
A) decrease in the price of gardenburgers.
B) increase in the demand for gardenburgers.
C) decrease in the price of mushrooms.
D) decrease in the price of hamburgers, assuming hamburgers are a substitute for pizza.
Question
Question
Refer to the information provided in Figure 3.15 below to answer the following questions. Figure 3.15
Refer to Figure 3.15. A decrease in the price of mushrooms (an input for gardenburgers) will cause a movement from Point B on supply curve S2 to
A) supply curve S3.
B) supply curve S1.
C) Point A on supply curve S2.
D) Point C on supply curve S2.
Figure 3.15Refer to Figure 3.15. A decrease in the price of mushrooms (an input for gardenburgers) will cause a movement from Point B on supply curve S2 to
A) supply curve S3.
B) supply curve S1.
C) Point A on supply curve S2.
D) Point C on supply curve S2.

Unlock Deck
Sign up to unlock the cards in this deck!
Unlock Deck
Unlock Deck
1/144
Play
Full screen (f)
Deck 3: Demand, Supply, and Market Equilibrium
1
Firms are organizations that
A) take advantage of the public.
B) transform resources into products.
C) transform outputs into inputs.
D) consumer outputs.
A) take advantage of the public.
B) transform resources into products.
C) transform outputs into inputs.
D) consumer outputs.
B
2
Labor is demanded by firms in an output market.
False
3
A factor market is
A) where goods are exchanged.
B) where resources are exchanged.
C) where goods are made.
D) organized by government.
A) where goods are exchanged.
B) where resources are exchanged.
C) where goods are made.
D) organized by government.
B
4
Factors of production are traded in the product market.
Unlock Deck
Unlock for access to all 144 flashcards in this deck.
Unlock Deck
k this deck
5
As an individual consumes more of a product within a given period of time, it is likely that each additional unit consumed will yield
A) successively less satisfaction.
B) successively more satisfaction.
C) the same amount of satisfaction.
D) less satisfaction for a while and then start to add more satisfaction.
A) successively less satisfaction.
B) successively more satisfaction.
C) the same amount of satisfaction.
D) less satisfaction for a while and then start to add more satisfaction.
Unlock Deck
Unlock for access to all 144 flashcards in this deck.
Unlock Deck
k this deck
6
Why do firms engage in the activity of production?
A) to help society advance technologically
B) to participate in the circular flow
C) to acquire profits
D) to develop a supply schedule
A) to help society advance technologically
B) to participate in the circular flow
C) to acquire profits
D) to develop a supply schedule
Unlock Deck
Unlock for access to all 144 flashcards in this deck.
Unlock Deck
k this deck
7
Households are the consuming units of the economy.
Unlock Deck
Unlock for access to all 144 flashcards in this deck.
Unlock Deck
k this deck
8
The "law of demand" implies that
A) as prices fall, demand increases.
B) as prices rise, demand increases.
C) as prices fall, quantity demanded increases.
D) as prices rise, quantity demanded increases.
A) as prices fall, demand increases.
B) as prices rise, demand increases.
C) as prices fall, quantity demanded increases.
D) as prices rise, quantity demanded increases.
Unlock Deck
Unlock for access to all 144 flashcards in this deck.
Unlock Deck
k this deck
9
Entrepreneurs are unnecessary in a market economy, and their profit is unearned.
Unlock Deck
Unlock for access to all 144 flashcards in this deck.
Unlock Deck
k this deck
10
According to the law of demand there is ________ relationship between price and quantity demanded.
A) a positive
B) a negative
C) either a positive or negative
D) a constantly changing
A) a positive
B) a negative
C) either a positive or negative
D) a constantly changing
Unlock Deck
Unlock for access to all 144 flashcards in this deck.
Unlock Deck
k this deck
11
Economists would classify the Boston Symphony Orchestra as a firm.
Unlock Deck
Unlock for access to all 144 flashcards in this deck.
Unlock Deck
k this deck
12
In input or factor markets,
A) consumers purchase products.
B) firms supply goods.
C) households supply resources.
D) households demand goods.
A) consumers purchase products.
B) firms supply goods.
C) households supply resources.
D) households demand goods.
Unlock Deck
Unlock for access to all 144 flashcards in this deck.
Unlock Deck
k this deck
13
Households are paid income for the resources they supply in an input market.
Unlock Deck
Unlock for access to all 144 flashcards in this deck.
Unlock Deck
k this deck
14
According to the law of demand, as prices rise, ceteris paribus
A) demand increases.
B) demand decreases.
C) quantity demanded decreases.
D) quantity demanded increases.
A) demand increases.
B) demand decreases.
C) quantity demanded decreases.
D) quantity demanded increases.
Unlock Deck
Unlock for access to all 144 flashcards in this deck.
Unlock Deck
k this deck
15
Michael Dell was the first individual who sold computers by mail order. The company founded by Dell is now one of the largest and most successful computer companies in the United States. Michael Dell would be classified as a(n)
A) entrepreneur.
B) opportunist.
C) monopolist.
D) socialist.
A) entrepreneur.
B) opportunist.
C) monopolist.
D) socialist.
Unlock Deck
Unlock for access to all 144 flashcards in this deck.
Unlock Deck
k this deck
16
Which of the following is held constant along the demand curve?
A) price of the good
B) quantity
C) income
D) both A and B
A) price of the good
B) quantity
C) income
D) both A and B
Unlock Deck
Unlock for access to all 144 flashcards in this deck.
Unlock Deck
k this deck
17
Which of the following will NOT cause a shift in the demand curve for compact discs?
A) a change in income
B) a change in wealth
C) a change in the price of downloadable online music
D) a change in the price of compact discs
A) a change in income
B) a change in wealth
C) a change in the price of downloadable online music
D) a change in the price of compact discs
Unlock Deck
Unlock for access to all 144 flashcards in this deck.
Unlock Deck
k this deck
18
An entrepreneur is a person who does all of the following EXCEPT
A) assumes the risk of a firm.
B) organizes and manages a firm.
C) turns a new idea or product into a business.
D) always makes a profit.
A) assumes the risk of a firm.
B) organizes and manages a firm.
C) turns a new idea or product into a business.
D) always makes a profit.
Unlock Deck
Unlock for access to all 144 flashcards in this deck.
Unlock Deck
k this deck
19
Among the factors of production are
A) capital.
B) wages.
C) income.
D) all of the above
A) capital.
B) wages.
C) income.
D) all of the above
Unlock Deck
Unlock for access to all 144 flashcards in this deck.
Unlock Deck
k this deck
20
In an output market,
A) consumers purchase products.
B) firms purchase resources.
C) households earn income.
D) land, labor and capital may be exchanged.
A) consumers purchase products.
B) firms purchase resources.
C) households earn income.
D) land, labor and capital may be exchanged.
Unlock Deck
Unlock for access to all 144 flashcards in this deck.
Unlock Deck
k this deck
21
Refer to the information provided in Figure 3.6 below to answer the questions that follow. Figure 3.6
Refer to Figure 3.6. The number of DVDs Isabel rents per week increases from 4 to 7. This is caused by
A) an increase in income if DVDs are a normal good.
B) a decrease in the price of popcorn, which is a complement to DVDs.
C) a decrease in the rental price of DVDs.
D) either A or B.
Figure 3.6Refer to Figure 3.6. The number of DVDs Isabel rents per week increases from 4 to 7. This is caused by
A) an increase in income if DVDs are a normal good.
B) a decrease in the price of popcorn, which is a complement to DVDs.
C) a decrease in the rental price of DVDs.
D) either A or B.
Unlock Deck
Unlock for access to all 144 flashcards in this deck.
Unlock Deck
k this deck
22
Refer to the information provided in Figure 3.3 below to answer the questions that follow. Figure 3.3
Refer to Figure 3.3. As your income increased, the demand for X shifted from D1 to D2. Good X is
A) an inferior good.
B) a normal good.
C) a luxury good.
D) an income-neutral good.
Figure 3.3Refer to Figure 3.3. As your income increased, the demand for X shifted from D1 to D2. Good X is
A) an inferior good.
B) a normal good.
C) a luxury good.
D) an income-neutral good.
Unlock Deck
Unlock for access to all 144 flashcards in this deck.
Unlock Deck
k this deck
23
During an economic downturn when consumer income falls, the demand for tacos increases and the demand for sushi decreases. This implies that tacos
A) and sushi are complements.
B) are a normal good and sushi is an inferior good.
C) are an inferior good and sushi is a normal good.
D) are an economic bad and sushi is an economic good.
A) and sushi are complements.
B) are a normal good and sushi is an inferior good.
C) are an inferior good and sushi is a normal good.
D) are an economic bad and sushi is an economic good.
Unlock Deck
Unlock for access to all 144 flashcards in this deck.
Unlock Deck
k this deck
24
When the decrease in the price of one good causes the demand for another good to decrease, the goods are
A) normal.
B) inferior.
C) substitutes.
D) complements.
A) normal.
B) inferior.
C) substitutes.
D) complements.
Unlock Deck
Unlock for access to all 144 flashcards in this deck.
Unlock Deck
k this deck
25
In response to news reports that taking aspirin daily can reduce an individual's risk of a heart attack, there will most likely be a(n)
A) increase in the supply of aspirin.
B) decrease in the supply of aspirin.
C) increase in the demand for aspirin.
D) increase in the quantity demanded of aspirin.
A) increase in the supply of aspirin.
B) decrease in the supply of aspirin.
C) increase in the demand for aspirin.
D) increase in the quantity demanded of aspirin.
Unlock Deck
Unlock for access to all 144 flashcards in this deck.
Unlock Deck
k this deck
26
Demand for one item goes down when the price of another item goes up. These items must be
A) substitutes.
B) complements.
C) normal goods.
D) inferior goods.
A) substitutes.
B) complements.
C) normal goods.
D) inferior goods.
Unlock Deck
Unlock for access to all 144 flashcards in this deck.
Unlock Deck
k this deck
27
A good whose demand is inversely related to income is a(n)
A) normal good.
B) inferior good.
C) regular good.
D) new good.
A) normal good.
B) inferior good.
C) regular good.
D) new good.
Unlock Deck
Unlock for access to all 144 flashcards in this deck.
Unlock Deck
k this deck
28
Refer to the information provided in Figure 3.2 below to answer the questions that follow. Figure 3.2
Refer to Figure 3.2. Which of the following would be most likely to cause the demand for macaroni and cheese to shift from D1 to D0?
A) an increase in the price of macaroni and cheese
B) an increase in the price of flour used to make macaroni and cheese
C) an increase in income, assuming macaroni and cheese is a normal good
D) an increase in the quantity demanded for macaroni and cheese
Figure 3.2Refer to Figure 3.2. Which of the following would be most likely to cause the demand for macaroni and cheese to shift from D1 to D0?
A) an increase in the price of macaroni and cheese
B) an increase in the price of flour used to make macaroni and cheese
C) an increase in income, assuming macaroni and cheese is a normal good
D) an increase in the quantity demanded for macaroni and cheese
Unlock Deck
Unlock for access to all 144 flashcards in this deck.
Unlock Deck
k this deck
29
If the demand for sardines increases as income decreases, sardines are a(n)
A) normal good.
B) inferior good.
C) substitute good.
D) complementary good.
A) normal good.
B) inferior good.
C) substitute good.
D) complementary good.
Unlock Deck
Unlock for access to all 144 flashcards in this deck.
Unlock Deck
k this deck
30
The quantity demanded of Pepsi has decreased. The best explanation for this is that
A) the price of Coca-Cola has increased.
B) Pepsi's advertising is not as effective as in the past.
C) the price of Pepsi has increased.
D) Pepsi consumers had an increase in income.
A) the price of Coca-Cola has increased.
B) Pepsi's advertising is not as effective as in the past.
C) the price of Pepsi has increased.
D) Pepsi consumers had an increase in income.
Unlock Deck
Unlock for access to all 144 flashcards in this deck.
Unlock Deck
k this deck
31
If the demand for coffee decreases as income decreases, coffee is a(n)
A) normal good.
B) inferior good.
C) substitute good.
D) complementary good.
A) normal good.
B) inferior good.
C) substitute good.
D) complementary good.
Unlock Deck
Unlock for access to all 144 flashcards in this deck.
Unlock Deck
k this deck
32
Refer to the information provided in Figure 3.5 below to answer the questions that follow. Figure 3.5
Refer to Figure 3.5. If consumer income increases, the demand for chili peppers shifts from D0 to D1. This implies that chili peppers are a(n)
A) normal good.
B) inferior good.
C) substitute good.
D) complementary good.
Figure 3.5Refer to Figure 3.5. If consumer income increases, the demand for chili peppers shifts from D0 to D1. This implies that chili peppers are a(n)
A) normal good.
B) inferior good.
C) substitute good.
D) complementary good.
Unlock Deck
Unlock for access to all 144 flashcards in this deck.
Unlock Deck
k this deck
33
In college you practically existed on instant noodles, but now you earn $95,000 a year. You never want to see instant noodles again. We can safely conclude that you consider instant noodles to be a(n)
A) normal good.
B) complementary good.
C) luxury.
D) inferior good.
A) normal good.
B) complementary good.
C) luxury.
D) inferior good.
Unlock Deck
Unlock for access to all 144 flashcards in this deck.
Unlock Deck
k this deck
34
A change in the price of a good or service leads to a ________ that leads to a ________.
A) change in demand; movement along the demand curve
B) change in quantity demanded; movement along the demand curve
C) change in demand; shift in the demand curve
D) change in quantity demanded; shift of the demand curve
A) change in demand; movement along the demand curve
B) change in quantity demanded; movement along the demand curve
C) change in demand; shift in the demand curve
D) change in quantity demanded; shift of the demand curve
Unlock Deck
Unlock for access to all 144 flashcards in this deck.
Unlock Deck
k this deck
35
Refer to the information provided in Figure 3.1 below to answer the questions that follow. Figure 3.1
Refer to Figure 3.1. Which of the following would be most likely to cause the demand for Dr. Pepper to shift from D0 to D1?
A) a decrease in income, assuming that Dr. Pepper is a normal good
B) an increase in the price of 7-UP, assuming 7-UP is a substitute for Dr. Pepper
C) a decrease in the price of Dr. Pepper
D) a reduction in the price of sugar used to make Dr. Pepper
Figure 3.1Refer to Figure 3.1. Which of the following would be most likely to cause the demand for Dr. Pepper to shift from D0 to D1?
A) a decrease in income, assuming that Dr. Pepper is a normal good
B) an increase in the price of 7-UP, assuming 7-UP is a substitute for Dr. Pepper
C) a decrease in the price of Dr. Pepper
D) a reduction in the price of sugar used to make Dr. Pepper
Unlock Deck
Unlock for access to all 144 flashcards in this deck.
Unlock Deck
k this deck
36
Suppose the demand for books goes down when the price of video games goes down. We can say that these two goods are
A) complements.
B) substitutes.
C) unrelated goods.
D) perfect substitutes.
A) complements.
B) substitutes.
C) unrelated goods.
D) perfect substitutes.
Unlock Deck
Unlock for access to all 144 flashcards in this deck.
Unlock Deck
k this deck
37
Demand curves are derived while holding constant
A) income, tastes, and the price of the good.
B) only income and tastes.
C) income, tastes, and the prices of other goods.
D) only tastes and the price of other goods.
A) income, tastes, and the price of the good.
B) only income and tastes.
C) income, tastes, and the prices of other goods.
D) only tastes and the price of other goods.
Unlock Deck
Unlock for access to all 144 flashcards in this deck.
Unlock Deck
k this deck
38
A decrease in demand for cameras would likely be caused by
A) an increase in the price of a substitute good.
B) an increase in the price of cameras.
C) an increase in the price of a complementary good.
D) a decrease in the price of cameras.
A) an increase in the price of a substitute good.
B) an increase in the price of cameras.
C) an increase in the price of a complementary good.
D) a decrease in the price of cameras.
Unlock Deck
Unlock for access to all 144 flashcards in this deck.
Unlock Deck
k this deck
39
For inferior goods, an increase in income will cause the
A) quantity demanded to fall.
B) demand to increase.
C) demand to fall.
D) quantity demanded to increase.
A) quantity demanded to fall.
B) demand to increase.
C) demand to fall.
D) quantity demanded to increase.
Unlock Deck
Unlock for access to all 144 flashcards in this deck.
Unlock Deck
k this deck
40
Refer to the information provided in Figure 3.4 below to answer the questions that follow. Figure 3.4
Refer to Figure 3.4. If consumer income falls, the demand for tuna fish sandwiches shifts from D0 to D1. This implies that tuna fish sandwiches are a(n)
A) normal good.
B) inferior good.
C) substitute good.
D) complementary good.
Figure 3.4Refer to Figure 3.4. If consumer income falls, the demand for tuna fish sandwiches shifts from D0 to D1. This implies that tuna fish sandwiches are a(n)
A) normal good.
B) inferior good.
C) substitute good.
D) complementary good.
Unlock Deck
Unlock for access to all 144 flashcards in this deck.
Unlock Deck
k this deck
41
Refer to the information provided in Figure 3.7 below to answer the following questions. Figure 3.7
Refer to Figure 3.7. An increase in quantity demanded is represented by movement
A) from D2 to D1.
B) from D2 to D3.
C) along D2 from Point B to point A.
D) along D2 from Point B to point C.
Figure 3.7Refer to Figure 3.7. An increase in quantity demanded is represented by movement
A) from D2 to D1.
B) from D2 to D3.
C) along D2 from Point B to point A.
D) along D2 from Point B to point C.
Unlock Deck
Unlock for access to all 144 flashcards in this deck.
Unlock Deck
k this deck
42
Refer to the information provided in Figure 3.7 below to answer the following questions. Figure 3.7
Refer to Figure 3.7. A decrease in demand is represented by the movement
A) from D2 to D1.
B) from D2 to D3.
C) along D2 from Point B to Point A.
D) along D2 from Point B to Point C.
Figure 3.7Refer to Figure 3.7. A decrease in demand is represented by the movement
A) from D2 to D1.
B) from D2 to D3.
C) along D2 from Point B to Point A.
D) along D2 from Point B to Point C.
Unlock Deck
Unlock for access to all 144 flashcards in this deck.
Unlock Deck
k this deck
43
Refer to Scenario 3.1 below to answer the questions that follow.
SCENARIO 3.1: Rented DVDs and movies shown in theaters are substitutes. Rented DVDs and plasma TVs are complements. Plasma TVs and movies shown in theaters are normal goods. People watch rented DVDs more often in the winter than in the summer.
Refer to Scenario 3.1. The number of stores renting DVDs is reduced by 25%, reducing the number of DVDs available. Which of the following would occur?
A) The rental price of DVDs would increase, and the price of plasma TVs and movie tickets would decrease.
B) The rental price of DVDs would increase, but the price of plasma TVs and movie tickets would be unaffected.
C) The rental price of DVDs and movie tickets would decrease, but the price of plasma TVs would increase.
D) The rental price of DVDs and the price of movie tickets would increase, but the price of plasma TVs would decrease.
Unlock Deck
Unlock for access to all 144 flashcards in this deck.
Unlock Deck
k this deck
44
Refer to Scenario 3.1 below to answer the questions that follow.
SCENARIO 3.1: Rented DVDs and movies shown in theaters are substitutes. Rented DVDs and plasma TVs are complements. Plasma TVs and movies shown in theaters are normal goods. People watch rented DVDs more often in the winter than in the summer.
Refer to Scenario 3.1. To raise additional revenues, the government imposes an entertainment tax on movie tickets, but there are no new additional taxes levied on rented DVDs. This would lead to
A) an increase in the price of movie tickets, but no change in the rental price of DVDs.
B) an increase in the price of movie tickets and the rental price of DVDs.
C) an increase in the price of a movie ticket and a decrease in the rental price of DVDs.
D) no change in the price of a movie ticket and an increase in the rental price of DVDs.
Unlock Deck
Unlock for access to all 144 flashcards in this deck.
Unlock Deck
k this deck
45
Refer to the information provided in Figure 3.7 below to answer the following questions. Figure 3.7
Refer to Figure 3.7. A movement from Point C to Point B on demand curve D2 would be caused by a(n)
A) decrease in income, assuming pizza is a normal good.
B) decrease in the price of hamburgers, assuming that pizza and hamburgers are substitutes.
C) decrease in the price of pizza.
D) increase in the price of pizza.
Figure 3.7Refer to Figure 3.7. A movement from Point C to Point B on demand curve D2 would be caused by a(n)
A) decrease in income, assuming pizza is a normal good.
B) decrease in the price of hamburgers, assuming that pizza and hamburgers are substitutes.
C) decrease in the price of pizza.
D) increase in the price of pizza.
Unlock Deck
Unlock for access to all 144 flashcards in this deck.
Unlock Deck
k this deck
46
Refer to Scenario 3.1 below to answer the questions that follow.
SCENARIO 3.1: Rented DVDs and movies shown in theaters are substitutes. Rented DVDs and plasma TVs are complements. Plasma TVs and movies shown in theaters are normal goods. People watch rented DVDs more often in the winter than in the summer.
Refer to Scenario 3.1. Most plasma TVs sold in the United States are imported from Japan. If the United States government reduces the number of plasma TVs that can be imported into the United States, ceteris paribus, what would happen?
A) The price of plasma TVs and the rental price of DVDs would decrease.
B) The price of plasma TVs would decrease, and the rental price of DVDs would increase.
C) The price of plasma TVs would increase, and the rental price of DVDs would decrease.
D) The price of plasma TVs and the rental price of DVDs would increase.
Unlock Deck
Unlock for access to all 144 flashcards in this deck.
Unlock Deck
k this deck
47
Refer to the information provided in Figure 3.8 below to answer the following questions. Figure 3.8
Refer to Figure 3.8. Assume that there are only two people in the market for baseball caps: Alex and Ryan. Along the market demand curve for baseball caps, at a price of ________, quantity demanded would be ________.
A) $10; 7
B) $10; 11
C) $8; 12
D) $8; 13
Figure 3.8Refer to Figure 3.8. Assume that there are only two people in the market for baseball caps: Alex and Ryan. Along the market demand curve for baseball caps, at a price of ________, quantity demanded would be ________.
A) $10; 7
B) $10; 11
C) $8; 12
D) $8; 13
Unlock Deck
Unlock for access to all 144 flashcards in this deck.
Unlock Deck
k this deck
48
Quantity demanded of a product is determined only by how much of that product consumers desire.
Unlock Deck
Unlock for access to all 144 flashcards in this deck.
Unlock Deck
k this deck
49
Related to the Economics in Practice on page 55: The Amazon Kindle and the electronic textbooks available for the Kindle are complementary goods. Electronic textbooks and traditional, hard copy textbooks are substitute products. If the price of electronic textbooks for the Kindle decreases,
A) demand for the Kindle increases, demand for electronic textbooks increases, and demand for traditional, hard copy textbooks decreases.
B) the quantity of Kindles demanded increases, demand for electronic textbooks increases, and the quantity of traditional, hard copy textbooks demanded decreases.
C) demand for the Kindle decreases, the quantity of electronic textbooks demanded increases, and demand for traditional, hard copy textbooks decreases.
D) demand for the Kindle increases, the quantity of electronic textbooks demanded increases, and demand for traditional, hard copy textbooks decreases.
Unlock Deck
Unlock for access to all 144 flashcards in this deck.
Unlock Deck
k this deck
50
Refer to Scenario 3.1 below to answer the questions that follow.
SCENARIO 3.1: Rented DVDs and movies shown in theaters are substitutes. Rented DVDs and plasma TVs are complements. Plasma TVs and movies shown in theaters are normal goods. People watch rented DVDs more often in the winter than in the summer.
Refer to Scenario 3.1. You observe that the rental price for DVDs is higher in the winter than in the summer. This would be explained by the fact that
A) demand for rented DVDs is higher in the winter than in the summer.
B) the quantity demanded of rented DVDs is higher in the winter than in the summer.
C) there are more DVDs released into the rental market in the winter than in the summer.
D) consumer income tends to fall in the winter and increase in the summer.
Unlock Deck
Unlock for access to all 144 flashcards in this deck.
Unlock Deck
k this deck
51
Refer to the information provided in Figure 3.9 below to answer the following questions. Figure 3.9
Refer to Figure 3.9. Assume there are only two people in the market for coconuts: Sasha and Kyle. Along the market demand curve for coconuts, at a price of ________, quantity demanded would be ________.
A) $10; 9
B) $10; 10
C) $14; 9
D) $14; 8
Figure 3.9Refer to Figure 3.9. Assume there are only two people in the market for coconuts: Sasha and Kyle. Along the market demand curve for coconuts, at a price of ________, quantity demanded would be ________.
A) $10; 9
B) $10; 10
C) $14; 9
D) $14; 8
Unlock Deck
Unlock for access to all 144 flashcards in this deck.
Unlock Deck
k this deck
52
Related to the Economics in Practice on page 55: The Amazon Kindle and the electronic textbooks available for the Kindle are complementary goods. Electronic textbooks and traditional, hard copy textbooks are substitute products. If the price of traditional, hard copy textbooks increases,
A) demand for traditional, hard copy textbooks decreases and demand for electronic textbooks increases.
B) the quantity of traditional, hard copy textbooks demanded decreases and demand for electronic textbooks increases.
C) the quantity of electronic textbooks demanded increases and demand for the Kindle increases.
D) the quantity of electronic textbooks demanded increases and demand for traditional, hard copy textbooks decreases.
Unlock Deck
Unlock for access to all 144 flashcards in this deck.
Unlock Deck
k this deck
53
Refer to the information provided in Figure 3.7 below to answer the following questions. Figure 3.7
Refer to Figure 3.7. If pizza and hamburgers are substitutes, an increase in the price of hamburgers will cause a movement from Point B on demand curve D2 to
A) demand curve D1.
B) demand curve D3.
C) Point A on demand curve D2.
D) Point C on demand curve D2.
Figure 3.7Refer to Figure 3.7. If pizza and hamburgers are substitutes, an increase in the price of hamburgers will cause a movement from Point B on demand curve D2 to
A) demand curve D1.
B) demand curve D3.
C) Point A on demand curve D2.
D) Point C on demand curve D2.
Unlock Deck
Unlock for access to all 144 flashcards in this deck.
Unlock Deck
k this deck
54
A change in income, preferences, or prices of other goods or services leads to a ________ that causes a ________.
A) change in demand; movement along the demand curve
B) change in quantity demanded; movement along the demand curve
C) change in demand; shift of the demand curve
D) change in quantity demanded; shift of the demand curve
A) change in demand; movement along the demand curve
B) change in quantity demanded; movement along the demand curve
C) change in demand; shift of the demand curve
D) change in quantity demanded; shift of the demand curve
Unlock Deck
Unlock for access to all 144 flashcards in this deck.
Unlock Deck
k this deck
55
Refer to the information provided in Figure 3.7 below to answer the following questions. Figure 3.7
Refer to Figure 3.7. Assume the market is initially at Point B and that pizza is a normal good. A decrease in income would cause the market to move from Point B on demand curve D2 to
A) demand curve D1.
B) demand curve D3.
C) Point A on demand curve D2.
D) Point C on demand curve D2.
Figure 3.7Refer to Figure 3.7. Assume the market is initially at Point B and that pizza is a normal good. A decrease in income would cause the market to move from Point B on demand curve D2 to
A) demand curve D1.
B) demand curve D3.
C) Point A on demand curve D2.
D) Point C on demand curve D2.
Unlock Deck
Unlock for access to all 144 flashcards in this deck.
Unlock Deck
k this deck
56
A change in the price of a good or service leads to a change in quantity demanded of the good.
Unlock Deck
Unlock for access to all 144 flashcards in this deck.
Unlock Deck
k this deck
57
Refer to the information provided in Figure 3.8 below to answer the following questions. Figure 3.8
Refer to Figure 3.8. Assume there are only two people in the market for baseball caps: Alex and Ryan. Along the market demand curve for baseball caps, at a price of ________, quantity demanded would be ________.
A) $10; 6
B) $10; 12
C) $8; 14
D) $8; 25
Figure 3.8Refer to Figure 3.8. Assume there are only two people in the market for baseball caps: Alex and Ryan. Along the market demand curve for baseball caps, at a price of ________, quantity demanded would be ________.
A) $10; 6
B) $10; 12
C) $8; 14
D) $8; 25
Unlock Deck
Unlock for access to all 144 flashcards in this deck.
Unlock Deck
k this deck
58
Wealth is a flow measure.
Unlock Deck
Unlock for access to all 144 flashcards in this deck.
Unlock Deck
k this deck
59
Refer to the information provided in Figure 3.9 below to answer the following questions. Figure 3.9
Refer to Figure 3.9. Assume that there are only two people in the market for coconuts: Sasha and Kyle. Along the market demand curve for coconuts, at a price of ________, quantity demanded would be ________.
A) $14; 7
B) $14; 9
C) $10; 9
D) $10; 8
Figure 3.9Refer to Figure 3.9. Assume that there are only two people in the market for coconuts: Sasha and Kyle. Along the market demand curve for coconuts, at a price of ________, quantity demanded would be ________.
A) $14; 7
B) $14; 9
C) $10; 9
D) $10; 8
Unlock Deck
Unlock for access to all 144 flashcards in this deck.
Unlock Deck
k this deck
60
Refer to the information provided in Figure 3.7 below to answer the following questions. Figure 3.7
Refer to Figure 3.7. If pizza and beer are complementary goods, a decrease in the price of beer will cause a movement from Point B on demand curve D2 to
A) demand curve D1.
B) demand curve D3.
C) Point A on demand curve D2.
D) Point C on demand curve D2.
Figure 3.7Refer to Figure 3.7. If pizza and beer are complementary goods, a decrease in the price of beer will cause a movement from Point B on demand curve D2 to
A) demand curve D1.
B) demand curve D3.
C) Point A on demand curve D2.
D) Point C on demand curve D2.
Unlock Deck
Unlock for access to all 144 flashcards in this deck.
Unlock Deck
k this deck
61
If iPods and iTunes are complements, then a decrease in the price of iPods will result in a decrease in the demand for iTunes.
Unlock Deck
Unlock for access to all 144 flashcards in this deck.
Unlock Deck
k this deck
62
The change in the price of a good leads to a change in ________, which leads to a ________.
A) quantity supplied; movement along a supply curve
B) quantity supplied; shift of the supply curve
C) supply; movement along a supply curve
D) supply; shift of the supply curve
A) quantity supplied; movement along a supply curve
B) quantity supplied; shift of the supply curve
C) supply; movement along a supply curve
D) supply; shift of the supply curve
Unlock Deck
Unlock for access to all 144 flashcards in this deck.
Unlock Deck
k this deck
63
If the price of chili increases, there will be ________ of chili cheese fries.
A) an increase in the supply
B) a decrease in the supply
C) an increase in the quantity supplied
D) a decrease in the quantity supplied
A) an increase in the supply
B) a decrease in the supply
C) an increase in the quantity supplied
D) a decrease in the quantity supplied
Unlock Deck
Unlock for access to all 144 flashcards in this deck.
Unlock Deck
k this deck
64
A frozen food manufacturer can produce either pizzas or calzones. As the result of an increase in the price of calzones, the firm produces more calzones and fewer pizzas. An economist would explain this by saying
A) the supply of calzones increased and the supply of pizzas decreased.
B) there has been an increase in the quantity supplied of calzones and a decrease in the quantity supplied of pizzas.
C) there has been an increase in the quantity supplied of calzones and a decrease in the supply of pizza.
D) the supply of calzones increased and the quantity supplied of pizza decreased.
Unlock Deck
Unlock for access to all 144 flashcards in this deck.
Unlock Deck
k this deck
65
Refer to the information provided in Figure 3.11 below to answer the questions that follow. Figure 3.11
Refer to Figure 3.11. Assume hamburgers are a normal good. An increase in income will cause a movement from
A) Point A to Point B.
B) Point G to Point F.
C) D1 to D2.
D) S1 to S2.
Figure 3.11Refer to Figure 3.11. Assume hamburgers are a normal good. An increase in income will cause a movement from
A) Point A to Point B.
B) Point G to Point F.
C) D1 to D2.
D) S1 to S2.
Unlock Deck
Unlock for access to all 144 flashcards in this deck.
Unlock Deck
k this deck
66
Refer to the information provided in Figure 3.16 below to answer the questions that follow. Figure 3.16
Refer to Figure 3.16. The supply curve for hula hoops shifts from S0 to S1. This could be caused by
A) an decrease in the price of hula hoops.
B) a decrease in the number of firms selling hula hoops.
C) a decrease in the demand for hula hoops.
D) either B or C.
Figure 3.16Refer to Figure 3.16. The supply curve for hula hoops shifts from S0 to S1. This could be caused by
A) an decrease in the price of hula hoops.
B) a decrease in the number of firms selling hula hoops.
C) a decrease in the demand for hula hoops.
D) either B or C.
Unlock Deck
Unlock for access to all 144 flashcards in this deck.
Unlock Deck
k this deck
67
Refer to the information provided in Figure 3.14 below to answer the following questions. Figure 3.14
Refer to Figure 3.14. A decrease in the wage rate of pizza makers will cause a movement from Point B on supply curve S2 to
A) Point A on supply curve S2.
B) Point B on supply curve S2.
C) supply curve S3.
D) supply curve S1.
Figure 3.14Refer to Figure 3.14. A decrease in the wage rate of pizza makers will cause a movement from Point B on supply curve S2 to
A) Point A on supply curve S2.
B) Point B on supply curve S2.
C) supply curve S3.
D) supply curve S1.
Unlock Deck
Unlock for access to all 144 flashcards in this deck.
Unlock Deck
k this deck
68
Refer to the information provided in Figure 3.14 below to answer the following questions. Figure 3.14
Refer to Figure 3.14. A movement from Point A to Point B on supply curve S2 would be caused by a(n)
A) increase in the price of pizza.
B) decrease in the demand for pizza.
C) increase in the price of pizza dough.
D) increase in the price of hamburgers, assuming hamburgers are a substitute for pizza.
Figure 3.14Refer to Figure 3.14. A movement from Point A to Point B on supply curve S2 would be caused by a(n)
A) increase in the price of pizza.
B) decrease in the demand for pizza.
C) increase in the price of pizza dough.
D) increase in the price of hamburgers, assuming hamburgers are a substitute for pizza.
Unlock Deck
Unlock for access to all 144 flashcards in this deck.
Unlock Deck
k this deck
69
Refer to the information provided in Figure 3.14 below to answer the following questions. Figure 3.14
Refer to Figure 3.14. A decrease in quantity supplied is represented by a movement from
A) S2 to S3.
B) S2 to S1.
C) Point B to Point A along supply curve S2.
D) Point B to Point C along supply curve S2.
Figure 3.14Refer to Figure 3.14. A decrease in quantity supplied is represented by a movement from
A) S2 to S3.
B) S2 to S1.
C) Point B to Point A along supply curve S2.
D) Point B to Point C along supply curve S2.
Unlock Deck
Unlock for access to all 144 flashcards in this deck.
Unlock Deck
k this deck
70
The price of hard drives used in the manufacturing of laptop computers has risen. This will lead to ________ laptop computers.
A) an increase in the supply of
B) a decrease in the supply of
C) an increase in the quantity supplied of
D) a decrease in the quantity supplied of
A) an increase in the supply of
B) a decrease in the supply of
C) an increase in the quantity supplied of
D) a decrease in the quantity supplied of
Unlock Deck
Unlock for access to all 144 flashcards in this deck.
Unlock Deck
k this deck
71
Refer to the information provided in Figure 3.14 below to answer the following questions. Figure 3.14
Refer to Figure 3.14. An increase in supply is represented by the movement from
A) S2 to S3.
B) S2 to S1.
C) Point B to Point A along supply curve S2.
D) Point B to Point C along supply curve S2.
Figure 3.14Refer to Figure 3.14. An increase in supply is represented by the movement from
A) S2 to S3.
B) S2 to S1.
C) Point B to Point A along supply curve S2.
D) Point B to Point C along supply curve S2.
Unlock Deck
Unlock for access to all 144 flashcards in this deck.
Unlock Deck
k this deck
72
Refer to the information provided in Figure 3.15 below to answer the following questions. Figure 3.15
Refer to Figure 3.15. An increase in quantity supplied is represented by a movement from
A) S2 to S1.
B) S2 to S3.
C) Point B to Point A along supply curve S2.
D) Point B to Point C along supply curve S2.
Figure 3.15Refer to Figure 3.15. An increase in quantity supplied is represented by a movement from
A) S2 to S1.
B) S2 to S3.
C) Point B to Point A along supply curve S2.
D) Point B to Point C along supply curve S2.
Unlock Deck
Unlock for access to all 144 flashcards in this deck.
Unlock Deck
k this deck
73
Refer to the information provided in Figure 3.15 below to answer the following questions. Figure 3.15
Refer to Figure 3.15. An increase in the wage rate of gardenburger makers will cause a movement from Point B on supply curve S2 to
A) Point A on supply curve S2.
B) Point C on supply curve S2.
C) supply curve S3.
D) supply curve S1.
Figure 3.15Refer to Figure 3.15. An increase in the wage rate of gardenburger makers will cause a movement from Point B on supply curve S2 to
A) Point A on supply curve S2.
B) Point C on supply curve S2.
C) supply curve S3.
D) supply curve S1.
Unlock Deck
Unlock for access to all 144 flashcards in this deck.
Unlock Deck
k this deck
74
According to the law of supply, there is a
A) negative relationship between price and the quantity of a good supplied.
B) positive relationship between price and the quantity of a good supplied.
C) negative relationship between price and the change in supply.
D) positive relationship between price and the change in supply.
A) negative relationship between price and the quantity of a good supplied.
B) positive relationship between price and the quantity of a good supplied.
C) negative relationship between price and the change in supply.
D) positive relationship between price and the change in supply.
Unlock Deck
Unlock for access to all 144 flashcards in this deck.
Unlock Deck
k this deck
75
Refer to the information provided in Figure 3.11 below to answer the questions that follow. Figure 3.11
Refer to Figure 3.11. Assume hamburgers and hot dogs are substitutes. A decrease in the price of hot dogs will cause a movement from
A) Point A to Point B.
B) Point F to Point G.
C) D2 to D1.
D) D1 to D2.
Figure 3.11Refer to Figure 3.11. Assume hamburgers and hot dogs are substitutes. A decrease in the price of hot dogs will cause a movement from
A) Point A to Point B.
B) Point F to Point G.
C) D2 to D1.
D) D1 to D2.
Unlock Deck
Unlock for access to all 144 flashcards in this deck.
Unlock Deck
k this deck
76
Refer to the information provided in Figure 3.14 below to answer the following questions. Figure 3.14
Refer to Figure 3.14. An increase in the price of pizza sauce will cause a movement from Point B on supply curve S2 to
A) supply curve S3.
B) supply curve S1.
C) Point A on supply curve S2.
D) Point C on supply curve S2.
Figure 3.14Refer to Figure 3.14. An increase in the price of pizza sauce will cause a movement from Point B on supply curve S2 to
A) supply curve S3.
B) supply curve S1.
C) Point A on supply curve S2.
D) Point C on supply curve S2.
Unlock Deck
Unlock for access to all 144 flashcards in this deck.
Unlock Deck
k this deck
77
Refer to the information provided in Figure 3.15 below to answer the following questions. Figure 3.15
Refer to Figure 3.15. A decrease in supply is represented by the movement from
A) S2 to S3.
B) S2 to S1.
C) Point B to Point A along supply curve S2.
D) Point B to Point C along supply curve S2.
Figure 3.15Refer to Figure 3.15. A decrease in supply is represented by the movement from
A) S2 to S3.
B) S2 to S1.
C) Point B to Point A along supply curve S2.
D) Point B to Point C along supply curve S2.
Unlock Deck
Unlock for access to all 144 flashcards in this deck.
Unlock Deck
k this deck
78
Refer to the information provided in Figure 3.15 below to answer the following questions. Figure 3.15
Refer to Figure 3.15. A movement from Point C to Point B on supply curve S2 would be caused by a(n)
A) decrease in the price of gardenburgers.
B) increase in the demand for gardenburgers.
C) decrease in the price of mushrooms.
D) decrease in the price of hamburgers, assuming hamburgers are a substitute for pizza.
Figure 3.15Refer to Figure 3.15. A movement from Point C to Point B on supply curve S2 would be caused by a(n)
A) decrease in the price of gardenburgers.
B) increase in the demand for gardenburgers.
C) decrease in the price of mushrooms.
D) decrease in the price of hamburgers, assuming hamburgers are a substitute for pizza.
Unlock Deck
Unlock for access to all 144 flashcards in this deck.
Unlock Deck
k this deck
79
Inferior goods are always substandard.
Unlock Deck
Unlock for access to all 144 flashcards in this deck.
Unlock Deck
k this deck
80
Refer to the information provided in Figure 3.15 below to answer the following questions. Figure 3.15
Refer to Figure 3.15. A decrease in the price of mushrooms (an input for gardenburgers) will cause a movement from Point B on supply curve S2 to
A) supply curve S3.
B) supply curve S1.
C) Point A on supply curve S2.
D) Point C on supply curve S2.
Figure 3.15Refer to Figure 3.15. A decrease in the price of mushrooms (an input for gardenburgers) will cause a movement from Point B on supply curve S2 to
A) supply curve S3.
B) supply curve S1.
C) Point A on supply curve S2.
D) Point C on supply curve S2.
Unlock Deck
Unlock for access to all 144 flashcards in this deck.
Unlock Deck
k this deck
Unlock Deck
Unlock for access to all 144 flashcards in this deck.


