Deck 7: Demand Forecasting in a Supply Chain
Full screen (f)
Question
Question
Question
Question
Question
Question
Question
Question
Question
Question
Question
Question
Question
Question
Question
Question
Question
Question
Question
Question
Question
Question
Question
Question
Question
Question
Question
Question
Question
Question
Question
Question
Question
Question
Question
Question
Question
Question
Question
Question
Question
Scenario 7.2 - Gulab Greatness
Historical demand for gulab jamun from a sweet stall on Commercial Road is as displayed in the table.
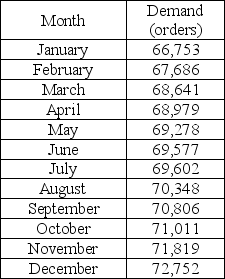
Use a simple moving average of three periods to forecast the demand for October.What is the forecast?
A)70,252
B)70,722
C)69,842
D)71,212
Historical demand for gulab jamun from a sweet stall on Commercial Road is as displayed in the table.
Use a simple moving average of three periods to forecast the demand for October.What is the forecast?
A)70,252
B)70,722
C)69,842
D)71,212
Question
Question
Question
Scenario 7.1 - Marshmallow Madness
Historical demand for Peeps is as displayed in the table.
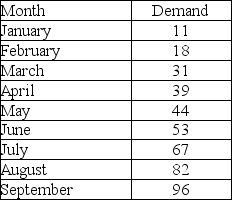
What is the level component of Holt's model for period 0?
A)-2.5
B)10.3
C)2.5
D)6.4
Historical demand for Peeps is as displayed in the table.
What is the level component of Holt's model for period 0?
A)-2.5
B)10.3
C)2.5
D)6.4
Question
Question
Scenario 7.1 - Marshmallow Madness
Historical demand for Peeps is as displayed in the table.
Use exponential smoothing to forecast the demand for March.What is the forecast if α = 0.7?
A)17.58
B)18.26
C)18.74
D)19.32
Historical demand for Peeps is as displayed in the table.
Use exponential smoothing to forecast the demand for March.What is the forecast if α = 0.7?
A)17.58
B)18.26
C)18.74
D)19.32
Question
Question
Scenario 7.1 - Marshmallow Madness
Historical demand for Peeps is as displayed in the table.
Use a simple moving average of three periods to forecast the demand for July.What is the forecast?
A)67
B)58
C)48.5
D)45.3
Historical demand for Peeps is as displayed in the table.
Use a simple moving average of three periods to forecast the demand for July.What is the forecast?
A)67
B)58
C)48.5
D)45.3
Question
Question
Question
Question
Question
Question
Question
Question
Question
Scenario 7.1 - Marshmallow Madness
Historical demand for Peeps is as displayed in the table.
What is the trend component of Holt's model for period 0?
A)-2.5
B)10.3
C)2.5
D)6.4
Historical demand for Peeps is as displayed in the table.
What is the trend component of Holt's model for period 0?
A)-2.5
B)10.3
C)2.5
D)6.4
Question
Question
Question
Question
Scenario 7.3
The Entrepreneurship professor had a habit of oversupplying extra credit opportunities for his class each semester and his colleagues delighted in trying to forecast his class enrollment from one semester to the next.The forecasts for one colleague,along with the actual class enrollment,appear in the table.
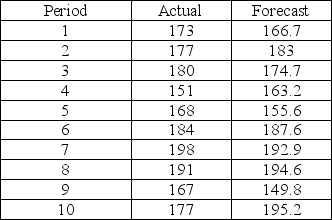
Calculate the MSE for this scenario.
A)106.60
B)119.80
C)108.54
D)112.20
The Entrepreneurship professor had a habit of oversupplying extra credit opportunities for his class each semester and his colleagues delighted in trying to forecast his class enrollment from one semester to the next.The forecasts for one colleague,along with the actual class enrollment,appear in the table.
Calculate the MSE for this scenario.
A)106.60
B)119.80
C)108.54
D)112.20
Question
Scenario 7.2 - Gulab Greatness
Historical demand for gulab jamun from a sweet stall on Commercial Road is as displayed in the table.
Use exponential smoothing to forecast the demand for July.What is the forecast if α = 0.4 and the forecast for May was 69,000?
A)69,346
B)69,379
C)69,500
D)69,298
Historical demand for gulab jamun from a sweet stall on Commercial Road is as displayed in the table.
Use exponential smoothing to forecast the demand for July.What is the forecast if α = 0.4 and the forecast for May was 69,000?
A)69,346
B)69,379
C)69,500
D)69,298
Question
Question
Question
Question
Question
Use Solver to determine the alpha that minimizes the MSE for the exponential smoothing forecast for the data that appear in this table.Use the actual demand of period 1 as the forecast for period 2 and then use the forecasts for periods 2 through 9 to calculate MSE. 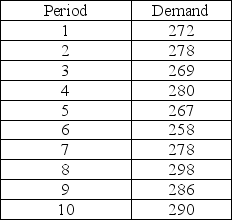
A)0.39
B)0.48
C)0.57
D)0.66
A)0.39
B)0.48
C)0.57
D)0.66
Question
Question
Question
Question
Question
Question
Question
Use Solver to determine the alpha that minimizes the MAD for the exponential smoothing forecast for the data that appear in this table.Use the actual demand of period 1 as the forecast for period 2 and then use the forecasts for periods 2 through 9 to calculate MAD. 
A)0.36
B)0.43
C)0.54
D)0.62
A)0.36
B)0.43
C)0.54
D)0.62
Question
Scenario 7.3
The Entrepreneurship professor had a habit of oversupplying extra credit opportunities for his class each semester and his colleagues delighted in trying to forecast his class enrollment from one semester to the next.The forecasts for one colleague,along with the actual class enrollment,appear in the table.
Calculate the MAD for this scenario.
A)10.04
B)8.99
C)10.40
D)9.25
Question
Question
Question
Question
Question

Unlock Deck
Sign up to unlock the cards in this deck!
Unlock Deck
Unlock Deck
1/84
Play
Full screen (f)
Deck 7: Demand Forecasting in a Supply Chain
1
Qualitative forecasting methods are most appropriate when there is good historical data available or when experts do not have market intelligence that is critical in making the forecast.
False
2
Aggregate forecasts are usually more accurate than disaggregate forecasts,as they tend to have a smaller standard deviation of error relative to the mean.
True
3
Most firms that employ forecasting do not maintain any estimates of forecast error.
True
4
The forecast error measures the difference between the forecast and the estimate.
Unlock Deck
Unlock for access to all 84 flashcards in this deck.
Unlock Deck
k this deck
5
Forecasts should include both the expected value of the forecast and a measure of forecast error.
Unlock Deck
Unlock for access to all 84 flashcards in this deck.
Unlock Deck
k this deck
6
The moving average forecast method is used when demand has an observable trend or seasonality.
Unlock Deck
Unlock for access to all 84 flashcards in this deck.
Unlock Deck
k this deck
7
Causal forecasting methods find a correlation between demand and environmental factors and use estimates of what environmental factors will be to forecast future demand.
Unlock Deck
Unlock for access to all 84 flashcards in this deck.
Unlock Deck
k this deck
8
Excel's Solver function should be used to minimize the forecast errors in a model.
Unlock Deck
Unlock for access to all 84 flashcards in this deck.
Unlock Deck
k this deck
9
The goal of any forecasting method is to predict the systematic component of demand and estimate the random component.
Unlock Deck
Unlock for access to all 84 flashcards in this deck.
Unlock Deck
k this deck
10
Time series forecasting methods are the most difficult methods to implement.
Unlock Deck
Unlock for access to all 84 flashcards in this deck.
Unlock Deck
k this deck
11
Leaders in many supply chains have started moving toward collaborative forecasting to improve their ability to match supply and demand.
Unlock Deck
Unlock for access to all 84 flashcards in this deck.
Unlock Deck
k this deck
12
Mature products with stable demand are usually the most difficult to forecast.
Unlock Deck
Unlock for access to all 84 flashcards in this deck.
Unlock Deck
k this deck
13
Collaborative forecasting based on sales to the end customer can help enterprises further up the supply chain reduce forecast error.
Unlock Deck
Unlock for access to all 84 flashcards in this deck.
Unlock Deck
k this deck
14
Forecasting and the accompanying managerial decisions are extremely difficult when either the supply of raw materials or the demand for the finished product is highly variable.
Unlock Deck
Unlock for access to all 84 flashcards in this deck.
Unlock Deck
k this deck
15
For pull processes,a manager must forecast what customer demand will be in order to plan the level of available capacity and inventory.
Unlock Deck
Unlock for access to all 84 flashcards in this deck.
Unlock Deck
k this deck
16
The forecast of demand forms the basis for all strategic and planning decisions in a supply chain.
Unlock Deck
Unlock for access to all 84 flashcards in this deck.
Unlock Deck
k this deck
17
In adaptive forecasting,the estimates of level,trend,and seasonality are updated after each demand observation.
Unlock Deck
Unlock for access to all 84 flashcards in this deck.
Unlock Deck
k this deck
18
Long-term forecasts have a larger standard deviation of error relative to the mean than short-term forecasts.
Unlock Deck
Unlock for access to all 84 flashcards in this deck.
Unlock Deck
k this deck
19
The result when each stage in the supply chain makes its own separate forecast is often a match between supply and demand because these forecasts are often very different.
Unlock Deck
Unlock for access to all 84 flashcards in this deck.
Unlock Deck
k this deck
20
A static time-series method should be used when the estimates for level,seasonality and trend may be based solely on historical data.
Unlock Deck
Unlock for access to all 84 flashcards in this deck.
Unlock Deck
k this deck
21
When either the supply of raw materials or the demand for the finished product is highly variable,forecasting and the accompanying managerial decisions
A)are extremely simple.
B)are relatively straightforward.
C)are extremely difficult.
D)should not be attempted.
A)are extremely simple.
B)are relatively straightforward.
C)are extremely difficult.
D)should not be attempted.
Unlock Deck
Unlock for access to all 84 flashcards in this deck.
Unlock Deck
k this deck
22
Leaders in many supply chains have started moving
A)toward independent forecasting to improve their ability to match supply and demand.
B)toward consecutive forecasting to improve their ability to match supply and demand.
C)toward sequential forecasting to improve their ability to match supply and demand.
D)toward collaborative forecasting to improve their ability to match supply and demand.
Unlock Deck
Unlock for access to all 84 flashcards in this deck.
Unlock Deck
k this deck
23
The =MAPE(array1,array2)function in Excel can calculate the mean absolute percent error of any two data arrays of the same size.
Unlock Deck
Unlock for access to all 84 flashcards in this deck.
Unlock Deck
k this deck
24
The basis for all strategic and planning decisions in a supply chain comes from
A)the forecast of demand.
B)sales targets.
C)profitability projections.
D)production efficiency goals.
A)the forecast of demand.
B)sales targets.
C)profitability projections.
D)production efficiency goals.
Unlock Deck
Unlock for access to all 84 flashcards in this deck.
Unlock Deck
k this deck
25
Production can utilize forecasts to make decisions concerning
A)scheduling.
B)sales-force allocation.
C)promotions.
D)hiring decisions.
A)scheduling.
B)sales-force allocation.
C)promotions.
D)hiring decisions.
Unlock Deck
Unlock for access to all 84 flashcards in this deck.
Unlock Deck
k this deck
26
One of the characteristics of forecasts is
A)aggregate forecasts are usually more accurate than disaggregate forecasts.
B)disaggregate forecasts are usually more accurate than aggregate forecasts.
C)short-term forecasts are usually less accurate than long-term forecasts.
D)long-term forecasts are usually more accurate than short-term forecasts.
Unlock Deck
Unlock for access to all 84 flashcards in this deck.
Unlock Deck
k this deck
27
When all stages of a supply chain produce a collaborative forecast,it tends to be
A)much more detailed.
B)much more complex.
C)much more accurate.
D)much more flexible.
A)much more detailed.
B)much more complex.
C)much more accurate.
D)much more flexible.
Unlock Deck
Unlock for access to all 84 flashcards in this deck.
Unlock Deck
k this deck
28
The result of each stage in the supply chain making its own separate forecast is
A)an accurate forecast.
B)a more accurate forecast.
C)a match between supply and demand.
D)a mismatch between supply and demand.
A)an accurate forecast.
B)a more accurate forecast.
C)a match between supply and demand.
D)a mismatch between supply and demand.
Unlock Deck
Unlock for access to all 84 flashcards in this deck.
Unlock Deck
k this deck
29
Personnel can utilize forecasts to make decisions concerning
A)scheduling.
B)promotions.
C)plant/equipment investment.
D)purchasing.
A)scheduling.
B)promotions.
C)plant/equipment investment.
D)purchasing.
Unlock Deck
Unlock for access to all 84 flashcards in this deck.
Unlock Deck
k this deck
30
Long-term forecasts are usually less accurate than short-term forecasts because
A)short-term forecasts have a larger standard deviation of error relative to the mean than long-term forecasts.
B)short-term forecasts have more standard deviation of error relative to the mean than long-term forecasts.
C)long-term forecasts have a smaller standard deviation of error relative to the mean than short-term forecasts.
D)long-term forecasts have a larger standard deviation of error relative to the mean than short-term forecasts.
Unlock Deck
Unlock for access to all 84 flashcards in this deck.
Unlock Deck
k this deck
31
Forecasting methods that use historical demand to make a forecast are known as
A)qualitative forecasting methods.
B)time series forecasting methods.
C)causal forecasting methods.
D)simulation forecasting methods.
A)qualitative forecasting methods.
B)time series forecasting methods.
C)causal forecasting methods.
D)simulation forecasting methods.
Unlock Deck
Unlock for access to all 84 flashcards in this deck.
Unlock Deck
k this deck
32
The resulting accuracy of a collaborative forecast enables supply chains to be
A)more responsive but less efficient in serving their customers.
B)both more responsive and more efficient in serving their customers.
C)less responsive but less efficient in serving their customers.
D)both less responsive and less efficient in serving their customers.
A)more responsive but less efficient in serving their customers.
B)both more responsive and more efficient in serving their customers.
C)less responsive but less efficient in serving their customers.
D)both less responsive and less efficient in serving their customers.
Unlock Deck
Unlock for access to all 84 flashcards in this deck.
Unlock Deck
k this deck
33
Aggregate forecasts are usually more accurate than disaggregate forecasts because
A)aggregate forecasts tend to have a larger standard deviation of error relative to the mean.
B)aggregate forecasts tend to have a smaller standard deviation of error relative to the mean.
C)disaggregate forecasts tend to have a smaller standard deviation of error relative to the mean.
D)disaggregate forecasts tend to have less standard deviation of error relative to the mean.
Unlock Deck
Unlock for access to all 84 flashcards in this deck.
Unlock Deck
k this deck
34
Forecasting methods that assume that the demand forecast is highly correlated with certain factors in the environment (e.g. ,the state of the economy,interest rates,etc. )to make a forecast are known as
A)qualitative forecasting methods.
B)time series forecasting methods.
C)causal forecasting methods.
D)simulation forecasting methods.
A)qualitative forecasting methods.
B)time series forecasting methods.
C)causal forecasting methods.
D)simulation forecasting methods.
Unlock Deck
Unlock for access to all 84 flashcards in this deck.
Unlock Deck
k this deck
35
One of the characteristics of forecasts is
A)aggregate forecasts are usually less accurate than disaggregate forecasts.
B)disaggregate forecasts are usually more accurate than aggregate forecasts.
C)short-term forecasts are usually less accurate than long-term forecasts.
D)long-term forecasts are usually less accurate than short-term forecasts.
Unlock Deck
Unlock for access to all 84 flashcards in this deck.
Unlock Deck
k this deck
36
Forecasting methods that imitate the consumer choices that give rise to demand to arrive at a forecast are known as
A)qualitative forecasting methods.
B)time series forecasting methods.
C)causal forecasting methods.
D)simulation forecasting methods.
A)qualitative forecasting methods.
B)time series forecasting methods.
C)causal forecasting methods.
D)simulation forecasting methods.
Unlock Deck
Unlock for access to all 84 flashcards in this deck.
Unlock Deck
k this deck
37
Forecasts are always wrong and therefore
A)should include both the expected value of the forecast and a measure of forecast error.
B)should not include both the expected value of the forecast and a measure of forecast error.
C)should only be used when there are no accurate estimates.
D)should be missing the expected value of the forecast and a measure of forecast error.
Unlock Deck
Unlock for access to all 84 flashcards in this deck.
Unlock Deck
k this deck
38
Mature products with stable demand
A)are usually easiest to forecast.
B)are usually hardest to forecast.
C)cannot be forecast.
D)do not need to be forecast.
A)are usually easiest to forecast.
B)are usually hardest to forecast.
C)cannot be forecast.
D)do not need to be forecast.
Unlock Deck
Unlock for access to all 84 flashcards in this deck.
Unlock Deck
k this deck
39
In general,the further up the supply chain a company is (or the further they are from the consumer),
A)the greater the distortion of information they receive.
B)the smaller the distortion of information they receive.
C)the more accurate the information they receive.
D)the more useful the information they receive.
A)the greater the distortion of information they receive.
B)the smaller the distortion of information they receive.
C)the more accurate the information they receive.
D)the more useful the information they receive.
Unlock Deck
Unlock for access to all 84 flashcards in this deck.
Unlock Deck
k this deck
40
For push processes,a manager must forecast what customer demand will be in order to
A)plan the service level.
B)plan the level of available capacity and inventory.
C)plan the level of productivity.
D)plan the level of production.
A)plan the service level.
B)plan the level of available capacity and inventory.
C)plan the level of productivity.
D)plan the level of production.
Unlock Deck
Unlock for access to all 84 flashcards in this deck.
Unlock Deck
k this deck
41
Scenario 7.2 - Gulab Greatness
Historical demand for gulab jamun from a sweet stall on Commercial Road is as displayed in the table.
Use a simple moving average of three periods to forecast the demand for October.What is the forecast?
A)70,252
B)70,722
C)69,842
D)71,212
Historical demand for gulab jamun from a sweet stall on Commercial Road is as displayed in the table.
Use a simple moving average of three periods to forecast the demand for October.What is the forecast?
A)70,252
B)70,722
C)69,842
D)71,212
Unlock Deck
Unlock for access to all 84 flashcards in this deck.
Unlock Deck
k this deck
42
The mixed form of the systematic component of demand is shown as
A)level × trend × seasonal factor.
B)level + trend + seasonal factor.
C)(level + trend)× seasonal factor.
D)level × (trend + seasonal factor).
A)level × trend × seasonal factor.
B)level + trend + seasonal factor.
C)(level + trend)× seasonal factor.
D)level × (trend + seasonal factor).
Unlock Deck
Unlock for access to all 84 flashcards in this deck.
Unlock Deck
k this deck
43
The moving average forecast method is used when
A)demand has observable trend or seasonality.
B)demand has no observable trend or seasonality.
C)demand has observable trend and seasonality.
D)demand has no observable level or seasonality.
A)demand has observable trend or seasonality.
B)demand has no observable trend or seasonality.
C)demand has observable trend and seasonality.
D)demand has no observable level or seasonality.
Unlock Deck
Unlock for access to all 84 flashcards in this deck.
Unlock Deck
k this deck
44
Scenario 7.1 - Marshmallow Madness
Historical demand for Peeps is as displayed in the table.
What is the level component of Holt's model for period 0?
A)-2.5
B)10.3
C)2.5
D)6.4
Historical demand for Peeps is as displayed in the table.
What is the level component of Holt's model for period 0?
A)-2.5
B)10.3
C)2.5
D)6.4
Unlock Deck
Unlock for access to all 84 flashcards in this deck.
Unlock Deck
k this deck
45
________ forecasting methods assume that the demand forecast is highly correlated with certain factors in the environment (the state of the economy,interest rates,etc. ).
A)Qualitative
B)Time-series
C)Causal
D)Simulation
A)Qualitative
B)Time-series
C)Causal
D)Simulation
Unlock Deck
Unlock for access to all 84 flashcards in this deck.
Unlock Deck
k this deck
46
Scenario 7.1 - Marshmallow Madness
Historical demand for Peeps is as displayed in the table.
Use exponential smoothing to forecast the demand for March.What is the forecast if α = 0.7?
A)17.58
B)18.26
C)18.74
D)19.32
Historical demand for Peeps is as displayed in the table.
Use exponential smoothing to forecast the demand for March.What is the forecast if α = 0.7?
A)17.58
B)18.26
C)18.74
D)19.32
Unlock Deck
Unlock for access to all 84 flashcards in this deck.
Unlock Deck
k this deck
47
The multiplicative form of the systematic component of demand is shown as
A)level × trend × seasonal factor.
B)level + trend + seasonal factor.
C)(level + trend)× seasonal factor.
D)level × (trend + seasonal factor).
A)level × trend × seasonal factor.
B)level + trend + seasonal factor.
C)(level + trend)× seasonal factor.
D)level × (trend + seasonal factor).
Unlock Deck
Unlock for access to all 84 flashcards in this deck.
Unlock Deck
k this deck
48
Scenario 7.1 - Marshmallow Madness
Historical demand for Peeps is as displayed in the table.
Use a simple moving average of three periods to forecast the demand for July.What is the forecast?
A)67
B)58
C)48.5
D)45.3
Historical demand for Peeps is as displayed in the table.
Use a simple moving average of three periods to forecast the demand for July.What is the forecast?
A)67
B)58
C)48.5
D)45.3
Unlock Deck
Unlock for access to all 84 flashcards in this deck.
Unlock Deck
k this deck
49
The simple exponential smoothing forecast method is appropriate when
A)demand has observable trend or seasonality.
B)demand has no observable trend or seasonality.
C)demand has observable trend and seasonality.
D)demand has no observable level or seasonality.
A)demand has observable trend or seasonality.
B)demand has no observable trend or seasonality.
C)demand has observable trend and seasonality.
D)demand has no observable level or seasonality.
Unlock Deck
Unlock for access to all 84 flashcards in this deck.
Unlock Deck
k this deck
50
________ forecasting methods use historical demand to make a forecast.
A)Qualitative
B)Time-series
C)Causal
D)Simulation
A)Qualitative
B)Time-series
C)Causal
D)Simulation
Unlock Deck
Unlock for access to all 84 flashcards in this deck.
Unlock Deck
k this deck
51
________ forecasting methods are primarily subjective and rely on human judgment.
A)Qualitative
B)Time-series
C)Causal
D)Simulation
A)Qualitative
B)Time-series
C)Causal
D)Simulation
Unlock Deck
Unlock for access to all 84 flashcards in this deck.
Unlock Deck
k this deck
52
The additive form of the systematic component of demand is shown as
A)level × trend × seasonal factor.
B)level + trend + seasonal factor.
C)(level + trend)× seasonal factor.
D)level × (trend + seasonal factor).
A)level × trend × seasonal factor.
B)level + trend + seasonal factor.
C)(level + trend)× seasonal factor.
D)level × (trend + seasonal factor).
Unlock Deck
Unlock for access to all 84 flashcards in this deck.
Unlock Deck
k this deck
53
The goal of any forecasting method is to
A)predict the random component of demand and estimate the systematic component.
B)predict the systematic component of demand and estimate the random component.
C)predict the seasonal component of demand and estimate the random component.
D)predict the random component of demand and estimate the seasonal component.
Unlock Deck
Unlock for access to all 84 flashcards in this deck.
Unlock Deck
k this deck
54
The trend corrected exponential smoothing (Holt's Model)forecast method is appropriate when
A)demand has observable trend or seasonality.
B)demand has no observable trend or seasonality.
C)demand has observable trend but no seasonality.
D)demand has no observable level or seasonality.
A)demand has observable trend or seasonality.
B)demand has no observable trend or seasonality.
C)demand has observable trend but no seasonality.
D)demand has no observable level or seasonality.
Unlock Deck
Unlock for access to all 84 flashcards in this deck.
Unlock Deck
k this deck
55
What does deseasonalizing a data set accomplish?
A)It removes the wavelike pattern from the data.
B)It removes all point-to-point variation from the data.
C)It removes all change in level from the data.
D)It removes the progression from one point to another from the data.
A)It removes the wavelike pattern from the data.
B)It removes all point-to-point variation from the data.
C)It removes all change in level from the data.
D)It removes the progression from one point to another from the data.
Unlock Deck
Unlock for access to all 84 flashcards in this deck.
Unlock Deck
k this deck
56
Qualitative forecasting methods are most appropriate when
A)there is good historical data available.
B)there is little historical data available.
C)experts do not have critical market intelligence.
D)forecasting demand into the near future.
A)there is good historical data available.
B)there is little historical data available.
C)experts do not have critical market intelligence.
D)forecasting demand into the near future.
Unlock Deck
Unlock for access to all 84 flashcards in this deck.
Unlock Deck
k this deck
57
Scenario 7.1 - Marshmallow Madness
Historical demand for Peeps is as displayed in the table.
What is the trend component of Holt's model for period 0?
A)-2.5
B)10.3
C)2.5
D)6.4
Historical demand for Peeps is as displayed in the table.
What is the trend component of Holt's model for period 0?
A)-2.5
B)10.3
C)2.5
D)6.4
Unlock Deck
Unlock for access to all 84 flashcards in this deck.
Unlock Deck
k this deck
58
Which forecasting methods are the simplest to implement and can serve as a good starting point for a demand forecast?
A)Qualitative forecasting methods
B)Time series forecasting methods
C)Causal forecasting methods
D)Simulation forecasting methods
A)Qualitative forecasting methods
B)Time series forecasting methods
C)Causal forecasting methods
D)Simulation forecasting methods
Unlock Deck
Unlock for access to all 84 flashcards in this deck.
Unlock Deck
k this deck
59
A static method of forecasting
A)assumes that the estimates of level,trend,and seasonality within the systematic component do not vary as new demand is observed.
B)assumes that the estimates of level,trend,and seasonality within the systematic component vary as new demand is observed.
C)the estimates of level,trend,and seasonality are updated after each demand observation.
D)All of the above are true.
Unlock Deck
Unlock for access to all 84 flashcards in this deck.
Unlock Deck
k this deck
60
In adaptive forecasting,
A)there is an assumption that the estimates of level,trend,and seasonality within the systematic component do not vary as new demand is observed.
B)the estimates of level,trend,and seasonality within the systematic component are not adjusted as new demand is observed.
C)the estimates of level,trend,and seasonality are updated after each demand observation.
D)All of the above are true.
Unlock Deck
Unlock for access to all 84 flashcards in this deck.
Unlock Deck
k this deck
61
Scenario 7.3
The Entrepreneurship professor had a habit of oversupplying extra credit opportunities for his class each semester and his colleagues delighted in trying to forecast his class enrollment from one semester to the next.The forecasts for one colleague,along with the actual class enrollment,appear in the table.
Calculate the MSE for this scenario.
A)106.60
B)119.80
C)108.54
D)112.20
Unlock Deck
Unlock for access to all 84 flashcards in this deck.
Unlock Deck
k this deck
62
Scenario 7.2 - Gulab Greatness
Historical demand for gulab jamun from a sweet stall on Commercial Road is as displayed in the table.
Use exponential smoothing to forecast the demand for July.What is the forecast if α = 0.4 and the forecast for May was 69,000?
A)69,346
B)69,379
C)69,500
D)69,298
Historical demand for gulab jamun from a sweet stall on Commercial Road is as displayed in the table.
Use exponential smoothing to forecast the demand for July.What is the forecast if α = 0.4 and the forecast for May was 69,000?
A)69,346
B)69,379
C)69,500
D)69,298
Unlock Deck
Unlock for access to all 84 flashcards in this deck.
Unlock Deck
k this deck
63
The measure of forecast error where the amount of error of each forecast is squared and then an average is calculated is
A)mean squared error (MSE).
B)mean absolute deviation (MAD).
C)mean absolute percentage error (MAPE).
D)the tracking signal.
A)mean squared error (MSE).
B)mean absolute deviation (MAD).
C)mean absolute percentage error (MAPE).
D)the tracking signal.
Unlock Deck
Unlock for access to all 84 flashcards in this deck.
Unlock Deck
k this deck
64
What is the forecast for June using Holt's model with an alpha of 0.1 and a beta of 0.2?
A)69,612
B)69,121
C)70,082
D)70,499
A)69,612
B)69,121
C)70,082
D)70,499
Unlock Deck
Unlock for access to all 84 flashcards in this deck.
Unlock Deck
k this deck
65
The ________ is a good measure of forecast error when the underlying forecast has significant seasonality and demand varies considerably from one period to the next.
A)MAD
B)MSE
C)MKE
D)MAPE
A)MAD
B)MSE
C)MKE
D)MAPE
Unlock Deck
Unlock for access to all 84 flashcards in this deck.
Unlock Deck
k this deck
66
The measure of whether a forecast method consistently over- or underestimates demand is
A)mean absolute deviation (MAD).
B)mean absolute percentage error (MAPE).
C)bias.
D)the tracking signal.
A)mean absolute deviation (MAD).
B)mean absolute percentage error (MAPE).
C)bias.
D)the tracking signal.
Unlock Deck
Unlock for access to all 84 flashcards in this deck.
Unlock Deck
k this deck
67
Use Solver to determine the alpha that minimizes the MSE for the exponential smoothing forecast for the data that appear in this table.Use the actual demand of period 1 as the forecast for period 2 and then use the forecasts for periods 2 through 9 to calculate MSE.
A)0.39
B)0.48
C)0.57
D)0.66
A)0.39
B)0.48
C)0.57
D)0.66
Unlock Deck
Unlock for access to all 84 flashcards in this deck.
Unlock Deck
k this deck
68
What Excel function/feature should be used to minimize the mean squared error for an exponential smoothing model?
A)Solver
B)=EXPON
C)=ALPHA
D)Goal seek
A)Solver
B)=EXPON
C)=ALPHA
D)Goal seek
Unlock Deck
Unlock for access to all 84 flashcards in this deck.
Unlock Deck
k this deck
69
The measure of forecast error where the average absolute error of each forecast is shown as a percentage of demand is
A)mean squared error (MSE).
B)mean absolute percentage error (MAPE).
C)bias.
D)the tracking signal.
A)mean squared error (MSE).
B)mean absolute percentage error (MAPE).
C)bias.
D)the tracking signal.
Unlock Deck
Unlock for access to all 84 flashcards in this deck.
Unlock Deck
k this deck
70
What Excel function/feature should be used to calculate a moving average?
A)Solver
B)=AVERAGE
C)=MAVE
D)Goal seek
A)Solver
B)=AVERAGE
C)=MAVE
D)Goal seek
Unlock Deck
Unlock for access to all 84 flashcards in this deck.
Unlock Deck
k this deck
71
The measure of forecast error where the absolute amount of error of each forecast is averaged is
A)mean squared error (MSE).
B)mean absolute deviation (MAD).
C)mean absolute percentage error (MAPE).
D)bias.
A)mean squared error (MSE).
B)mean absolute deviation (MAD).
C)mean absolute percentage error (MAPE).
D)bias.
Unlock Deck
Unlock for access to all 84 flashcards in this deck.
Unlock Deck
k this deck
72
What is the mean absolute percentage error?
A)5.24%
B)5.61%
C)5.40%
D)5.06%
A)5.24%
B)5.61%
C)5.40%
D)5.06%
Unlock Deck
Unlock for access to all 84 flashcards in this deck.
Unlock Deck
k this deck
73
Describe the basic characteristics of forecasts that managers should be aware of.
Unlock Deck
Unlock for access to all 84 flashcards in this deck.
Unlock Deck
k this deck
74
Use Solver to determine the alpha that minimizes the MAD for the exponential smoothing forecast for the data that appear in this table.Use the actual demand of period 1 as the forecast for period 2 and then use the forecasts for periods 2 through 9 to calculate MAD.
A)0.36
B)0.43
C)0.54
D)0.62
A)0.36
B)0.43
C)0.54
D)0.62
Unlock Deck
Unlock for access to all 84 flashcards in this deck.
Unlock Deck
k this deck
75
Scenario 7.3
The Entrepreneurship professor had a habit of oversupplying extra credit opportunities for his class each semester and his colleagues delighted in trying to forecast his class enrollment from one semester to the next.The forecasts for one colleague,along with the actual class enrollment,appear in the table.
Calculate the MAD for this scenario.
A)10.04
B)8.99
C)10.40
D)9.25
Unlock Deck
Unlock for access to all 84 flashcards in this deck.
Unlock Deck
k this deck
76
The measure of how significantly a forecast method consistently over- or underestimates demand is
A)mean squared error (MSE).
B)mean absolute deviation (MAD).
C)bias.
D)the tracking signal.
A)mean squared error (MSE).
B)mean absolute deviation (MAD).
C)bias.
D)the tracking signal.
Unlock Deck
Unlock for access to all 84 flashcards in this deck.
Unlock Deck
k this deck
77
Which of the following is a commonly used measure for measuring forecast error?
A)MDE
B)MKE
C)MAD
D)MES
A)MDE
B)MKE
C)MAD
D)MES
Unlock Deck
Unlock for access to all 84 flashcards in this deck.
Unlock Deck
k this deck
78
What is the largest value for the tracking signal (either under or overforecasting)?
A)0.955
B)-3.188
C)1.004
D)2.623
A)0.955
B)-3.188
C)1.004
D)2.623
Unlock Deck
Unlock for access to all 84 flashcards in this deck.
Unlock Deck
k this deck
79
What is the level component of Holt's model for period 0?
A)78,666
B)642
C)462
D)66,768
A)78,666
B)642
C)462
D)66,768
Unlock Deck
Unlock for access to all 84 flashcards in this deck.
Unlock Deck
k this deck
80
What is the trend component of Holt's model for period 0?
A)642
B)66,768
C)462
D)78,666
A)642
B)66,768
C)462
D)78,666
Unlock Deck
Unlock for access to all 84 flashcards in this deck.
Unlock Deck
k this deck
Unlock Deck
Unlock for access to all 84 flashcards in this deck.


