Deck 6: Scatterplots, association, and Correlation
Full screen (f)
Question
Question
Question
Question
Question
Question
Question
Question
A)Negative association
B)Moderately strong association
C)Linear association,moderately strong association
D)Negative association,linear association,moderate association
E)Little or no association
Question
Question
A)Negative association,linear association
B)Positive association,moderately strong association
C)Little or no association
D)Negative association,moderately strong association
E)Positive association,linear association
Question
Question
A)Little or no association
B)Positive association,moderately strong association
C)Negative association,linear association
D)Moderately strong nonlinear association
E)Negative association,moderately strong association
Question

A)Positive association,linear association
B)Positive association,moderately strong association
C)Positive association,linear association,very strong association
D)Linear association,very strong association
E)Linear association,moderately strong association
Question
Question
A)Linear association,moderately strong association
B)Linear association,very strong association
C)Negative association,linear association,very strong association
D)Negative association,moderately strong association
E)Negative association,linear association
Question
Question
Question
A)Positive association
B)Positive association,linear association,moderately strong association
C)Moderately strong association
D)Linear association,moderately strong association
E)Little or no association
Question
A)Linear association,moderately strong association
B)Positive association
C)Linear association
D)Positive association,moderately strong association,linear association
E)Positive association,moderately strong association
Question
Question
The following table gives the total sales (revenue)and profits for 8 retailers. 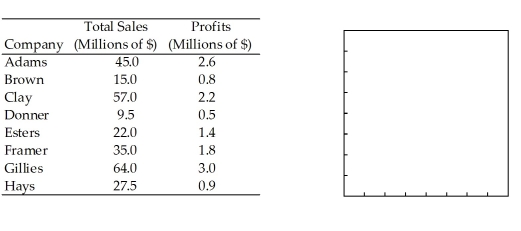
Question
The table contains the daily study time for students from Statistics 101 and the grades on their quiz. 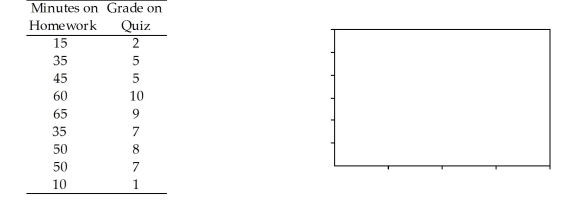
Question
Owners of a new appliances store tracked sales (in thousands)for the first 10 days,and displayed the data in a scatterplot.Make a histogram of the daily sales since the shop has been in business. 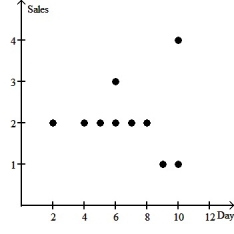
Question
Data collected from 20 students in Statistics classes included their heights (in inches)and weights (in pounds),and are displayed in the following scatterplot.Make a histogram of the weights of the children. 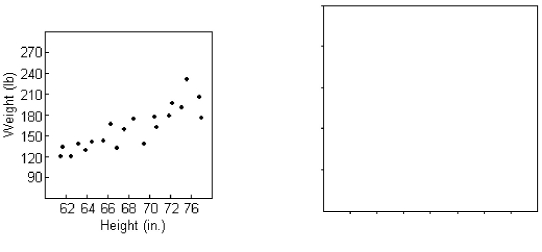
Question
A ceramics factory can fire seven large batches of pottery per day.Sometimes in the process a few of the pieces break.In order to understand the problem better,the factory records the number of broken pieces in each batch for 3 days and then creates the scatterplot shown.Make a histogram showing the distribution of the number of broken pieces in the 21 batches of pottery examined. 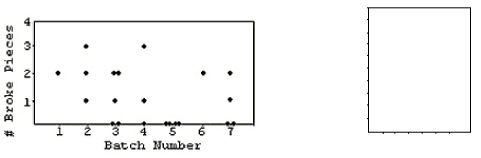
Question
Below are the Olympic gold medal performances in the men's high jump from 1960 to 1984. 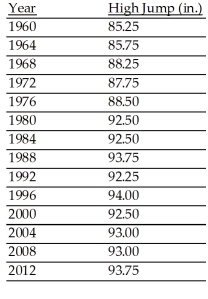
Question
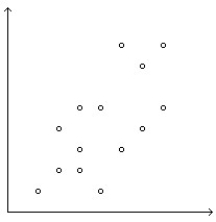
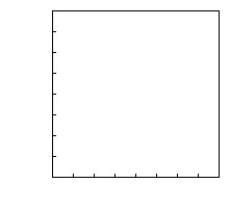
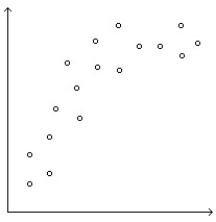
The relationship between two quantities x and y is examined,and the association is shown in the scatterplot below. 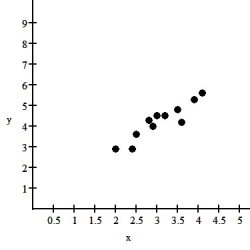 Describe the association between these variables shown in the scatterplot.
A)Fairly linear,negative,weak relationship
B)Fairly linear,negative,strong relationship
C)Fairly linear,positive,weak relationship
D)Fairly linear,positive,strong relationship
E)Fairly exponential,strong relationship
Describe the association between these variables shown in the scatterplot.A)Fairly linear,negative,weak relationship
B)Fairly linear,negative,strong relationship
C)Fairly linear,positive,weak relationship
D)Fairly linear,positive,strong relationship
E)Fairly exponential,strong relationship
Question
One of the important factors determining a car's fuel efficiency is its weight.This relationship is examined for 11 cars,and the association is shown in the scatterplot below.  Describe the association between these variables shown in the scatterplot.
A)Fairly Exponential,positive,strong relational
B)Fairly Quadratic,positive,weak relationship
C)Fairly linear,negative,strong relationship
D)Fairly linear,negative,weak relationship
E)Fairly linear,positive,strong relationship
Describe the association between these variables shown in the scatterplot.A)Fairly Exponential,positive,strong relational
B)Fairly Quadratic,positive,weak relationship
C)Fairly linear,negative,strong relationship
D)Fairly linear,negative,weak relationship
E)Fairly linear,positive,strong relationship
Question
A)Linear association,moderately strong association
B)Positive association,linear association
C)Moderately strong association
D)Linear association
E)Little or no association
Question
A)Linear association
B)Negative association,linear association
C)Little or no association
D)Moderately strong association
E)Linear association,moderately strong association
Question
A survey was conducted in 26 counties to determine the percentage of teenagers who had used marijuana and other drugs.Data are displayed in the following scatterplot.Make a histogram of the other drugs. 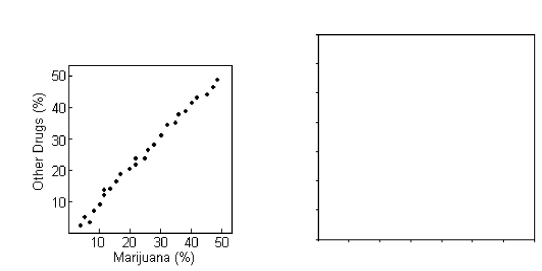
Question
A shop owner tries to predict the winter collection sales by displaying coat sales (in dollars)and the outside temperature (in degrees Fahrenheit)in the following scatterplot.Make a histogram of the coat sales. 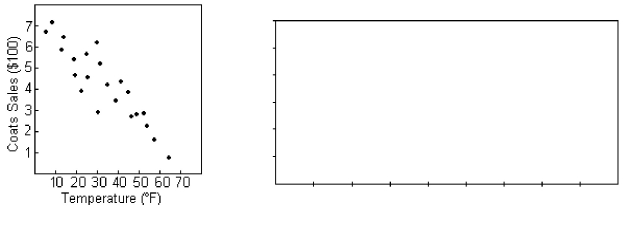
Question
A ceramics factory can fire six large batches of pottery per day.Sometimes in the process a few of the pieces break.In order to understand the problem better,the factory records the number of broken pieces in each batch for 4 days and then creates the scatterplot shown.Make a histogram showing the distribution of the number of broken pieces in the 24 batches of pottery examined. 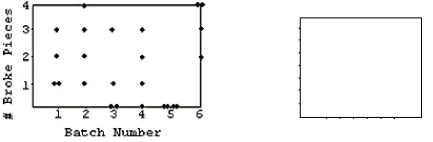
Question
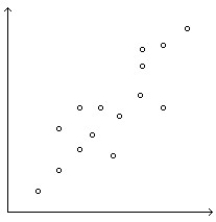
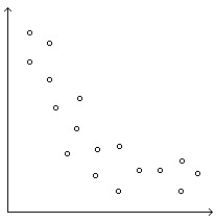
The relationship between two quantities x and y is examined,and the association is shown in the scatterplot below.  Describe the association between these variables shown in the scatterplot.
A)Fairly linear,weak relationship
B)Fairly exponential,strong relationship
C)Fairly linear,strong relationship
D)Fairly exponential,weak relationship
E)Fairly quadratic,weak relationship
Describe the association between these variables shown in the scatterplot.A)Fairly linear,weak relationship
B)Fairly exponential,strong relationship
C)Fairly linear,strong relationship
D)Fairly exponential,weak relationship
E)Fairly quadratic,weak relationship
Question
A forester would like to know how big a maple tree might be at age 50 years.She gathers data from some trees that have been cut down,and plots the diameters (in inches)of the trees against their ages (in years).First she makes a linear model.Describe the association shown in the scatterplot. 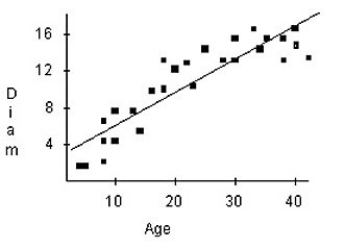
Question
The table shows the number of years of teaching experience for 9 certified high-school teachers and their weekly salaries (in dollars). 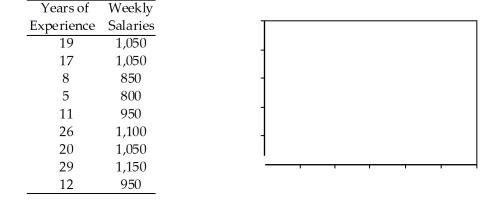
Question
The table contains the weights (in kg)and heights (in cm)of 9 randomly selected adults. 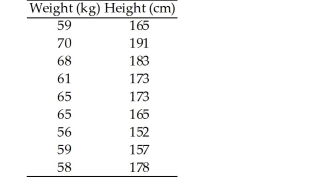
Question
A)Moderately strong association
B)Positive association,linear association
C)Positive association,moderately strong association
D)Negative association,linear association
E)Little or no association
Question
Owners of a new computer store tracked sales (in thousands)for the first 12 days,and displayed the data in a scatterplot.Make a histogram of the daily sales since the shop has been in business. 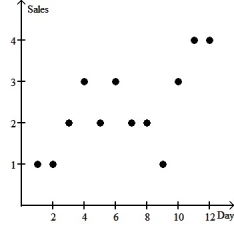
Question
The owner of a small manufacturing plant employs nine people.As part of their personnel file,he asked each one to record the distance,in km,they travel one way from home to work and the time it takes in minutes. 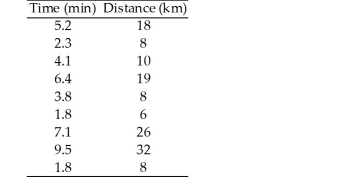
Question
A shop owner tries to predict heater sales by displaying the sales of hot chocolate and heaters on the following scatterplot.Does the scatterplot of hot chocolate sales and heater sales indicate that it is appropriate to calculate the correlation? 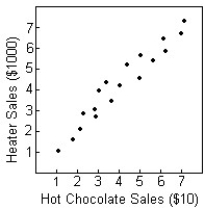
A)No: the relation must be linear.
B)Yes: the relation is strong.
C)Yes: the direction is positive.
D)Yes: the relation is linear.
E)Yes: the two variables are quantitative.
A)No: the relation must be linear.
B)Yes: the relation is strong.
C)Yes: the direction is positive.
D)Yes: the relation is linear.
E)Yes: the two variables are quantitative.
Question
Question
Question
Almost all of the acidity of soda pop comes from the phosphoric acid which is added to give them a sharper flavor.Is there a relation between the pH of the soda and the amount of phosphoric acid (in grams)? The pH and phosphoric acid content of 12 ounces of several brands of soda are shown on the following scatterplot.The correlation between pH and phosphoric acid is .Describe the association. 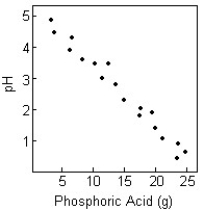
A)Strong relation in a negative direction
B)Weak linear relation in a negative direction
C)Strong linear relation in a positive direction
D)Very strong linear relation in a negative direction
E)No evidence of relation
A)Strong relation in a negative direction
B)Weak linear relation in a negative direction
C)Strong linear relation in a positive direction
D)Very strong linear relation in a negative direction
E)No evidence of relation
Question
A survey was conducted in 20 counties to determine the percentage of teenagers who had used marijuana and other drugs.Data shown on the following scatterplot indicate a correlation of 0.972 between the percent of teens who have used marijuana and the percent who have used other drugs.Describe the association. 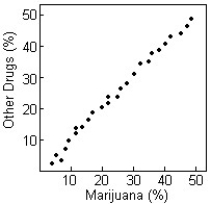
A)Strong curved relation in a positive direction
B)Weak linear relation in a positive direction
C)Strong linear relation in a positive direction
D)Strong nonlinear relation in a positive direction
E)No evidence of relation
A)Strong curved relation in a positive direction
B)Weak linear relation in a positive direction
C)Strong linear relation in a positive direction
D)Strong nonlinear relation in a positive direction
E)No evidence of relation
Question
Question
Question
Question
Question
Question
Question
Question
Question
Soda is often considered unhealthy because its content is high in both caffeine and refined sugar.But are the two related? Caffeine and refined sugar contents (in milligrams)of 12 ounces of several brands of soda are shown on the following scatterplot.The correlation between caffeine and refined sugar is 0.189.Describe the association. 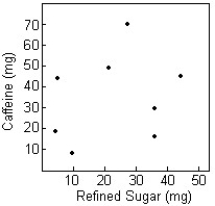
A)Weak linear relation in a positive direction
B)Weak nonlinear relation in a positive direction
C)Weak curved relation in a positive direction
D)No evidence of relation
E)Strong linear relation in a positive direction
A)Weak linear relation in a positive direction
B)Weak nonlinear relation in a positive direction
C)Weak curved relation in a positive direction
D)No evidence of relation
E)Strong linear relation in a positive direction
Question
Question
Question
Question
Question
Question
To get the best deal on a microwave oven,Amanda called six appliance stores and asked the cost and volume of several models.The prices and volumes she was quoted are listed below. 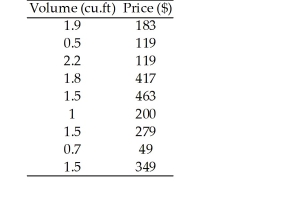
Question
Dioxins are a class of long-lived and highly toxic pollutants.The topsoil concentration of dioxins in parts per million (ppm)are shown in the table below as a function of the distance from the dump. 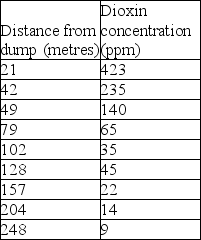 Re-express the dioxin concentration by taking the reciprocal square root of the data,then plot the re-expressed data as a scatterplot.
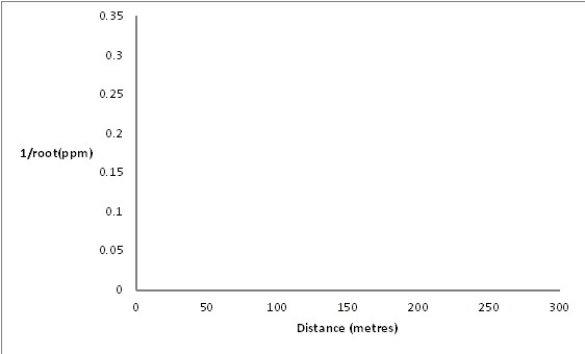
Re-express the dioxin concentration by taking the reciprocal square root of the data,then plot the re-expressed data as a scatterplot. Question
One of the important factors determining a car's fuel efficiency is its weight.This relationship is examined for 11 cars,and the association is shown in the scatterplot below. 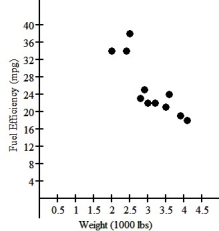 What re-expression of Y might be appropriate?
A)log y gallons per mile
B)100 ? gallons per 100 miles
C)-100 ? gallons per 100 miles
D)100 ? gallons per 100 miles
E)100 ? gallons per 100 miles
What re-expression of Y might be appropriate?A)log y gallons per mile
B)100 ? gallons per 100 miles
C)-100 ? gallons per 100 miles
D)100 ? gallons per 100 miles
E)100 ? gallons per 100 miles
Question
Question
Question
Data collected from students in Statistics classes included their heights (in inches)and weights (in pounds).For the and weights,the correlation is 0.653.Suppose the variable weight is recorded in kilograms rather than in pounds.What will be the correlation? 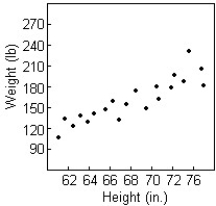
A)0.653 in./kg
B)-0.653
C)0.653 kg/in.
D)0.653
E)1.438 in./kg
A)0.653 in./kg
B)-0.653
C)0.653 kg/in.
D)0.653
E)1.438 in./kg
Question
A clothes shop owner tries to predict the winter collection sales by displaying the coats sales (in dollars)and the outside temperature (in degrees Fahrenheit)on the following scatterplot.He calculates that the correlation between coats sales and temperature is -0.737.Suppose the variable temperature is recorded in degrees Celsius rather than in degrees Fahrenheit.What will be the correlation? 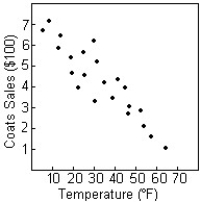
A)-0.737 F ? $
B)-18.187 F ? $
C)0.737
D)-0.737 F / $
E)-0.737
A)-0.737 F ? $
B)-18.187 F ? $
C)0.737
D)-0.737 F / $
E)-0.737
Question
A university radio station has been airing a public service announcement (PSA)that gives a telephone number students can call to get information on upcoming campus events.In order to determine the optimal number of times per day to run the PSA,the station has been counting the number of calls generated each day as a function of the number of times the PSA was aired.The results of the experiment are summarized in the table below. 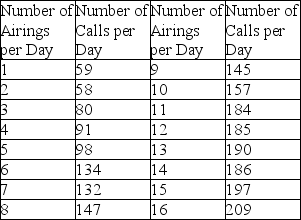 Re-express the data by squaring the number of calls per day,then plot the re-expressed data as a scatterplot.
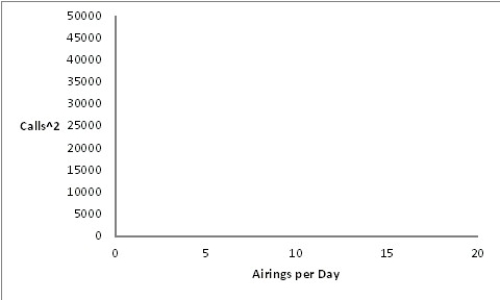
Re-express the data by squaring the number of calls per day,then plot the re-expressed data as a scatterplot. Question
Question
The relationship between two quantities X and Y is examined,and the association is shown in the scatterplot below. 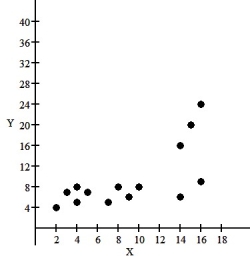 What re-expression of Y should be tried as a starting point?
A)log (Y)against X
B) against X
C) against X
D) against X
E) against X
What re-expression of Y should be tried as a starting point?A)log (Y)against X
B) against X
C) against X
D) against X
E) against X
Question
The relationship between two quantities X and Y is examined,and the association is shown in the scatterplot below.  Should you re-express these data before trying to fit a model? Explain.
A)Data should be re-expressed.Scatterplot shows upward curvature and increasing scatter as X increases.
B)Data should be re-expressed.Scatterplot shows linear relationship and uniform scatter.
C)Data does not need to be re-expressed.Scatterplot shows upward curvature and increasing scatter as X increases.
D)Data should be re-expressed.Scatterplot shows linear relationship.
E)Data does not need to be re-expressed.Scatterplot shows linear relationship.
Should you re-express these data before trying to fit a model? Explain.A)Data should be re-expressed.Scatterplot shows upward curvature and increasing scatter as X increases.
B)Data should be re-expressed.Scatterplot shows linear relationship and uniform scatter.
C)Data does not need to be re-expressed.Scatterplot shows upward curvature and increasing scatter as X increases.
D)Data should be re-expressed.Scatterplot shows linear relationship.
E)Data does not need to be re-expressed.Scatterplot shows linear relationship.
Question
Question
A psychology graduate student is studying the effect of alcohol intoxication on a person's ability to perform manual tasks.In a very simple experiment,a subject's blood alcohol level is brought to a certain level and then the subject is presented with 10 rope knots.The subject then attempts to untie as many knots as he or she can in 30 seconds.The results of the experiments are summarized in the table below. 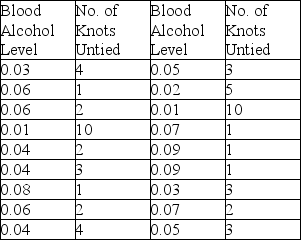 Re-express the number of knots untied by taking the inverse of each count,then plot the re-expressed data as a scatterplot.
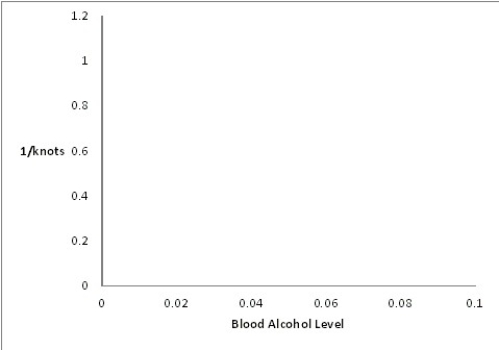
Re-express the number of knots untied by taking the inverse of each count,then plot the re-expressed data as a scatterplot. Question
Question
The consumer price index (CPI)is a measure of the relative cost of goods in a country for a particular year.The table below shows the CPI for various years beginning in 1940. 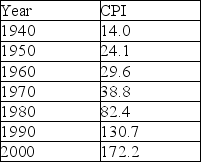 Re-express the CPI by taking the log of the data,then plot the re-expressed data as a scatterplot.
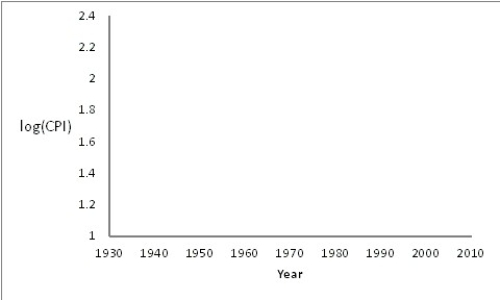
Re-express the CPI by taking the log of the data,then plot the re-expressed data as a scatterplot. Question
Question
Question
Question

Unlock Deck
Sign up to unlock the cards in this deck!
Unlock Deck
Unlock Deck
1/78
Play
Full screen (f)
Deck 6: Scatterplots, association, and Correlation
1
Teacher: weekly salary,teacher: years of experience
A)Teacher: weekly salary: response Teacher: years of experience: explanatory
B)Teacher: weekly salary: both Teacher: years of experience: explanatory
C)Teacher: weekly salary: explanatory Teacher: years of experience: response
D)Teacher: weekly salary: both Teacher: years of experience: both
E)Teacher: weekly salary: explanatory Teacher: years of experience: both
Teacher: weekly salary: response Teacher: years of experience: explanatory
2
Oranges: circumference (centimetres),oranges: weight (grams)
A)Oranges: circumference (centimetres): both Oranges: weight (grams): both
B)Oranges: circumference (centimetres): explanatory Oranges: weight (grams): both
C)Oranges: circumference (centimetres): explanatory Oranges: weight (grams): response
D)Oranges: circumference (centimetres): both Oranges: weight (grams): explanatory
E)Oranges: circumference (centimetres): response Oranges: weight (grams): explanatory
Oranges: circumference (centimetres): explanatory Oranges: weight (grams): response
3
Oranges: circumference (centimetres),oranges: weight (grams)
A)Negative,nonlinear,moderate
B)Negative,linear,moderate
C)Positive,linear,moderate
D)Positive,nonlinear,moderate
E)Positive,no form,strong
A)Negative,nonlinear,moderate
B)Negative,linear,moderate
C)Positive,linear,moderate
D)Positive,nonlinear,moderate
E)Positive,no form,strong
Positive,nonlinear,moderate
4
Litres remaining in a tank of gas,kilometres driven since filling up.
A)Negative,linear,moderate
B)Negative,nonlinear,strong
C)Negative,nonlinear,moderate
D)Positive,nonlinear,strong
E)Positive,linear,moderate
A)Negative,linear,moderate
B)Negative,nonlinear,strong
C)Negative,nonlinear,moderate
D)Positive,nonlinear,strong
E)Positive,linear,moderate
Unlock Deck
Unlock for access to all 78 flashcards in this deck.
Unlock Deck
k this deck
5
Adult weight (kg):,Adult height (m):
A)Adult weight (kg): both Adult height (m): both
B)Adult weight (kg): explanatory Adult height (m): response
C)Adult weight (kg): response Adult height (m): explanatory
D)Adult weight (kg): explanatory Adult height (m): both
E)Adult weight (kg): both Adult height (m): explanatory
A)Adult weight (kg): both Adult height (m): both
B)Adult weight (kg): explanatory Adult height (m): response
C)Adult weight (kg): response Adult height (m): explanatory
D)Adult weight (kg): explanatory Adult height (m): both
E)Adult weight (kg): both Adult height (m): explanatory
Unlock Deck
Unlock for access to all 78 flashcards in this deck.
Unlock Deck
k this deck
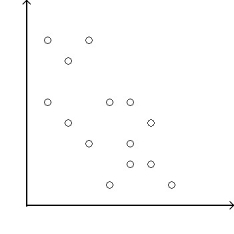
6
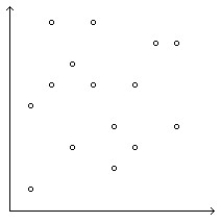
Student: grade point average,student: height (feet)
A)No direction,linear,moderate
B)No direction,no form,very weak
C)Positive,no form,very weak
D)Negative,linear,moderate
E)No direction,no form,strong
A)No direction,linear,moderate
B)No direction,no form,very weak
C)Positive,no form,very weak
D)Negative,linear,moderate
E)No direction,no form,strong
Unlock Deck
Unlock for access to all 78 flashcards in this deck.
Unlock Deck
k this deck
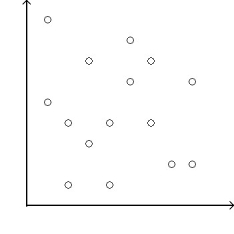
7
How tired you are,hours of sleep
A)Positive,linear,moderate
B)Positive,nonlinear,moderate
C)Negative,nonlinear,moderate
D)Negative,nonlinear,strong
E)Negative,linear,moderate
A)Positive,linear,moderate
B)Positive,nonlinear,moderate
C)Negative,nonlinear,moderate
D)Negative,nonlinear,strong
E)Negative,linear,moderate
Unlock Deck
Unlock for access to all 78 flashcards in this deck.
Unlock Deck
k this deck
8
A)Negative association
B)Moderately strong association
C)Linear association,moderately strong association
D)Negative association,linear association,moderate association
E)Little or no association
Unlock Deck
Unlock for access to all 78 flashcards in this deck.
Unlock Deck
k this deck
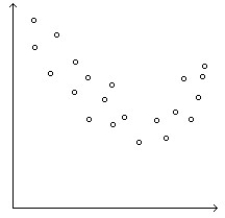
9
Cloudy days,rainy days
A)Negative,nonlinear,strong
B)Positive,nonlinear,moderate
C)Negative,linear,strong
D)Positive,nonlinear,strong
E)Positive,linear,moderate
A)Negative,nonlinear,strong
B)Positive,nonlinear,moderate
C)Negative,linear,strong
D)Positive,nonlinear,strong
E)Positive,linear,moderate
Unlock Deck
Unlock for access to all 78 flashcards in this deck.
Unlock Deck
k this deck
10
A)Negative association,linear association
B)Positive association,moderately strong association
C)Little or no association
D)Negative association,moderately strong association
E)Positive association,linear association
Unlock Deck
Unlock for access to all 78 flashcards in this deck.
Unlock Deck
k this deck
11
Year,results of race
A)Year: both Results of race: both
B)Year: both Results of race: explanatory
C)Year: explanatory Results of race: both
D)Year: explanatory Results of race: response
E)Year: response Results of race: explanatory
A)Year: both Results of race: both
B)Year: both Results of race: explanatory
C)Year: explanatory Results of race: both
D)Year: explanatory Results of race: response
E)Year: response Results of race: explanatory
Unlock Deck
Unlock for access to all 78 flashcards in this deck.
Unlock Deck
k this deck
12
A)Little or no association
B)Positive association,moderately strong association
C)Negative association,linear association
D)Moderately strong nonlinear association
E)Negative association,moderately strong association
Unlock Deck
Unlock for access to all 78 flashcards in this deck.
Unlock Deck
k this deck
13
A)Positive association,linear association
B)Positive association,moderately strong association
C)Positive association,linear association,very strong association
D)Linear association,very strong association
E)Linear association,moderately strong association
Unlock Deck
Unlock for access to all 78 flashcards in this deck.
Unlock Deck
k this deck
14
Oranges: weight (grams),oranges: weight (milligrams)
A)Oranges: weight (grams): both Oranges: weight (milligrams): both
B)Oranges: weight (grams): explanatory Oranges: weight (milligrams): response
C)Oranges: weight (grams): explanatory Oranges: weight (milligrams): both
D)Oranges: weight (grams): response Oranges: weight (milligrams): explanatory
E)Oranges: weight (grams): both Oranges: weight (milligrams): explanatory
Unlock Deck
Unlock for access to all 78 flashcards in this deck.
Unlock Deck
k this deck
15
A)Linear association,moderately strong association
B)Linear association,very strong association
C)Negative association,linear association,very strong association
D)Negative association,moderately strong association
E)Negative association,linear association
Unlock Deck
Unlock for access to all 78 flashcards in this deck.
Unlock Deck
k this deck
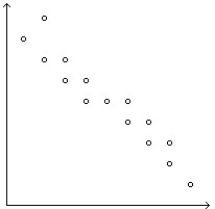
16
Air pressure,altitude
A)Positive,linear,strong
B)Positive,linear,moderate
C)Negative,nonlinear,strong
D)Negative,linear,moderate
E)Negative,linear,strong
A)Positive,linear,strong
B)Positive,linear,moderate
C)Negative,nonlinear,strong
D)Negative,linear,moderate
E)Negative,linear,strong
Unlock Deck
Unlock for access to all 78 flashcards in this deck.
Unlock Deck
k this deck
17
Air pressure,altitude
A)Air pressure: both Altitude: both
B)Air pressure: response Altitude: explanatory
C)Air pressure: explanatory Altitude: response
D)Air pressure: explanatory Altitude: both
E)Air pressure: both Altitude: explanatory
A)Air pressure: both Altitude: both
B)Air pressure: response Altitude: explanatory
C)Air pressure: explanatory Altitude: response
D)Air pressure: explanatory Altitude: both
E)Air pressure: both Altitude: explanatory
Unlock Deck
Unlock for access to all 78 flashcards in this deck.
Unlock Deck
k this deck
18
A)Positive association
B)Positive association,linear association,moderately strong association
C)Moderately strong association
D)Linear association,moderately strong association
E)Little or no association
Unlock Deck
Unlock for access to all 78 flashcards in this deck.
Unlock Deck
k this deck
19
A)Linear association,moderately strong association
B)Positive association
C)Linear association
D)Positive association,moderately strong association,linear association
E)Positive association,moderately strong association
Unlock Deck
Unlock for access to all 78 flashcards in this deck.
Unlock Deck
k this deck
20
Oranges: weight (ounces),oranges: weight (grams)
A)Positive,linear,strong
B)Positive,nonlinear,moderate
C)Negative,linear,moderate
D)Negative,nonlinear,moderate
E)Positive,no form,strong
A)Positive,linear,strong
B)Positive,nonlinear,moderate
C)Negative,linear,moderate
D)Negative,nonlinear,moderate
E)Positive,no form,strong
Unlock Deck
Unlock for access to all 78 flashcards in this deck.
Unlock Deck
k this deck
21
The following table gives the total sales (revenue)and profits for 8 retailers.
Unlock Deck
Unlock for access to all 78 flashcards in this deck.
Unlock Deck
k this deck
22
The table contains the daily study time for students from Statistics 101 and the grades on their quiz.
Unlock Deck
Unlock for access to all 78 flashcards in this deck.
Unlock Deck
k this deck
23
Owners of a new appliances store tracked sales (in thousands)for the first 10 days,and displayed the data in a scatterplot.Make a histogram of the daily sales since the shop has been in business.
Unlock Deck
Unlock for access to all 78 flashcards in this deck.
Unlock Deck
k this deck
24
Data collected from 20 students in Statistics classes included their heights (in inches)and weights (in pounds),and are displayed in the following scatterplot.Make a histogram of the weights of the children.
Unlock Deck
Unlock for access to all 78 flashcards in this deck.
Unlock Deck
k this deck
25
A ceramics factory can fire seven large batches of pottery per day.Sometimes in the process a few of the pieces break.In order to understand the problem better,the factory records the number of broken pieces in each batch for 3 days and then creates the scatterplot shown.Make a histogram showing the distribution of the number of broken pieces in the 21 batches of pottery examined.
Unlock Deck
Unlock for access to all 78 flashcards in this deck.
Unlock Deck
k this deck
26
Below are the Olympic gold medal performances in the men's high jump from 1960 to 1984.
Unlock Deck
Unlock for access to all 78 flashcards in this deck.
Unlock Deck
k this deck
27
The relationship between two quantities x and y is examined,and the association is shown in the scatterplot below. Describe the association between these variables shown in the scatterplot.
A)Fairly linear,negative,weak relationship
B)Fairly linear,negative,strong relationship
C)Fairly linear,positive,weak relationship
D)Fairly linear,positive,strong relationship
E)Fairly exponential,strong relationship
Describe the association between these variables shown in the scatterplot.A)Fairly linear,negative,weak relationship
B)Fairly linear,negative,strong relationship
C)Fairly linear,positive,weak relationship
D)Fairly linear,positive,strong relationship
E)Fairly exponential,strong relationship
Unlock Deck
Unlock for access to all 78 flashcards in this deck.
Unlock Deck
k this deck
28
One of the important factors determining a car's fuel efficiency is its weight.This relationship is examined for 11 cars,and the association is shown in the scatterplot below. Describe the association between these variables shown in the scatterplot.
A)Fairly Exponential,positive,strong relational
B)Fairly Quadratic,positive,weak relationship
C)Fairly linear,negative,strong relationship
D)Fairly linear,negative,weak relationship
E)Fairly linear,positive,strong relationship
Describe the association between these variables shown in the scatterplot.A)Fairly Exponential,positive,strong relational
B)Fairly Quadratic,positive,weak relationship
C)Fairly linear,negative,strong relationship
D)Fairly linear,negative,weak relationship
E)Fairly linear,positive,strong relationship
Unlock Deck
Unlock for access to all 78 flashcards in this deck.
Unlock Deck
k this deck
29
A)Linear association,moderately strong association
B)Positive association,linear association
C)Moderately strong association
D)Linear association
E)Little or no association
Unlock Deck
Unlock for access to all 78 flashcards in this deck.
Unlock Deck
k this deck
30
A)Linear association
B)Negative association,linear association
C)Little or no association
D)Moderately strong association
E)Linear association,moderately strong association
Unlock Deck
Unlock for access to all 78 flashcards in this deck.
Unlock Deck
k this deck
31
A survey was conducted in 26 counties to determine the percentage of teenagers who had used marijuana and other drugs.Data are displayed in the following scatterplot.Make a histogram of the other drugs.
Unlock Deck
Unlock for access to all 78 flashcards in this deck.
Unlock Deck
k this deck
32
A shop owner tries to predict the winter collection sales by displaying coat sales (in dollars)and the outside temperature (in degrees Fahrenheit)in the following scatterplot.Make a histogram of the coat sales.
Unlock Deck
Unlock for access to all 78 flashcards in this deck.
Unlock Deck
k this deck
33
A ceramics factory can fire six large batches of pottery per day.Sometimes in the process a few of the pieces break.In order to understand the problem better,the factory records the number of broken pieces in each batch for 4 days and then creates the scatterplot shown.Make a histogram showing the distribution of the number of broken pieces in the 24 batches of pottery examined.
Unlock Deck
Unlock for access to all 78 flashcards in this deck.
Unlock Deck
k this deck
34
The relationship between two quantities x and y is examined,and the association is shown in the scatterplot below. Describe the association between these variables shown in the scatterplot.
A)Fairly linear,weak relationship
B)Fairly exponential,strong relationship
C)Fairly linear,strong relationship
D)Fairly exponential,weak relationship
E)Fairly quadratic,weak relationship
Describe the association between these variables shown in the scatterplot.A)Fairly linear,weak relationship
B)Fairly exponential,strong relationship
C)Fairly linear,strong relationship
D)Fairly exponential,weak relationship
E)Fairly quadratic,weak relationship
Unlock Deck
Unlock for access to all 78 flashcards in this deck.
Unlock Deck
k this deck
35
A forester would like to know how big a maple tree might be at age 50 years.She gathers data from some trees that have been cut down,and plots the diameters (in inches)of the trees against their ages (in years).First she makes a linear model.Describe the association shown in the scatterplot.
Unlock Deck
Unlock for access to all 78 flashcards in this deck.
Unlock Deck
k this deck
36
The table shows the number of years of teaching experience for 9 certified high-school teachers and their weekly salaries (in dollars).
Unlock Deck
Unlock for access to all 78 flashcards in this deck.
Unlock Deck
k this deck
37
The table contains the weights (in kg)and heights (in cm)of 9 randomly selected adults.
Unlock Deck
Unlock for access to all 78 flashcards in this deck.
Unlock Deck
k this deck
38
A)Moderately strong association
B)Positive association,linear association
C)Positive association,moderately strong association
D)Negative association,linear association
E)Little or no association
Unlock Deck
Unlock for access to all 78 flashcards in this deck.
Unlock Deck
k this deck
39
Owners of a new computer store tracked sales (in thousands)for the first 12 days,and displayed the data in a scatterplot.Make a histogram of the daily sales since the shop has been in business.
Unlock Deck
Unlock for access to all 78 flashcards in this deck.
Unlock Deck
k this deck
40
The owner of a small manufacturing plant employs nine people.As part of their personnel file,he asked each one to record the distance,in km,they travel one way from home to work and the time it takes in minutes.
Unlock Deck
Unlock for access to all 78 flashcards in this deck.
Unlock Deck
k this deck
41
A shop owner tries to predict heater sales by displaying the sales of hot chocolate and heaters on the following scatterplot.Does the scatterplot of hot chocolate sales and heater sales indicate that it is appropriate to calculate the correlation?
A)No: the relation must be linear.
B)Yes: the relation is strong.
C)Yes: the direction is positive.
D)Yes: the relation is linear.
E)Yes: the two variables are quantitative.
A)No: the relation must be linear.
B)Yes: the relation is strong.
C)Yes: the direction is positive.
D)Yes: the relation is linear.
E)Yes: the two variables are quantitative.
Unlock Deck
Unlock for access to all 78 flashcards in this deck.
Unlock Deck
k this deck
42
A scientist collects data to predict the wheat yield (in bushels per acre)based on rainfall (in millimetres).The results are recorded in the table below.
A)0.932
B)0.943
C)0.952
D)0.942
E)0.941
A)0.932
B)0.943
C)0.952
D)0.942
E)0.941
Unlock Deck
Unlock for access to all 78 flashcards in this deck.
Unlock Deck
k this deck
43
The paired data below consist of the test scores of 6 randomly selected students and the number of hours they studied for the test.
A)0.678
B)-0.678
C)0.224
D)-0.224
E)0.157
A)0.678
B)-0.678
C)0.224
D)-0.224
E)0.157
Unlock Deck
Unlock for access to all 78 flashcards in this deck.
Unlock Deck
k this deck
44
Almost all of the acidity of soda pop comes from the phosphoric acid which is added to give them a sharper flavor.Is there a relation between the pH of the soda and the amount of phosphoric acid (in grams)? The pH and phosphoric acid content of 12 ounces of several brands of soda are shown on the following scatterplot.The correlation between pH and phosphoric acid is .Describe the association.
A)Strong relation in a negative direction
B)Weak linear relation in a negative direction
C)Strong linear relation in a positive direction
D)Very strong linear relation in a negative direction
E)No evidence of relation
A)Strong relation in a negative direction
B)Weak linear relation in a negative direction
C)Strong linear relation in a positive direction
D)Very strong linear relation in a negative direction
E)No evidence of relation
Unlock Deck
Unlock for access to all 78 flashcards in this deck.
Unlock Deck
k this deck
45
A survey was conducted in 20 counties to determine the percentage of teenagers who had used marijuana and other drugs.Data shown on the following scatterplot indicate a correlation of 0.972 between the percent of teens who have used marijuana and the percent who have used other drugs.Describe the association.
A)Strong curved relation in a positive direction
B)Weak linear relation in a positive direction
C)Strong linear relation in a positive direction
D)Strong nonlinear relation in a positive direction
E)No evidence of relation
A)Strong curved relation in a positive direction
B)Weak linear relation in a positive direction
C)Strong linear relation in a positive direction
D)Strong nonlinear relation in a positive direction
E)No evidence of relation
Unlock Deck
Unlock for access to all 78 flashcards in this deck.
Unlock Deck
k this deck
46
A study is conducted on the causes of flat feet,and shows a linear relation between age and having mechanical disturbances of the foot.The correlation between these two variables is 0.84.The report concludes that older people have greater chances to have flat feet.Is the calculation of the correlation appropriate?
A)No: having mechanical disturbances of the foot is a categorical variable.
B)Yes: the two variables are quantitative.
C)No: having mechanical disturbances of the foot is a response variable.
D)Yes: correlation is less than 1.
E)Yes: age is a quantitative variable.
A)No: having mechanical disturbances of the foot is a categorical variable.
B)Yes: the two variables are quantitative.
C)No: having mechanical disturbances of the foot is a response variable.
D)Yes: correlation is less than 1.
E)Yes: age is a quantitative variable.
Unlock Deck
Unlock for access to all 78 flashcards in this deck.
Unlock Deck
k this deck
47
A science instructor assigns a group of students to investigate the relationship between the pH of the water of a river and its water's hardness (measured in grains).Some students wrote these conclusions: "there was a very strong correlation of 1.35 between pH of the water and water's hardness." Is the calculation of the correlation appropriate?
A)Yes: correlation can be greater than 1.
B)Yes: the pH and the hardness of the water are data collected from the same river.
C)No: there is little or no association.
D)No: correlation cannot be greater than 1.
E)No: correlation must be equal to 1.
A)Yes: correlation can be greater than 1.
B)Yes: the pH and the hardness of the water are data collected from the same river.
C)No: there is little or no association.
D)No: correlation cannot be greater than 1.
E)No: correlation must be equal to 1.
Unlock Deck
Unlock for access to all 78 flashcards in this deck.
Unlock Deck
k this deck
48
A group of persons filled in a questionnaire their age and the number of countries they had visited in their lifetime.The results are recorded in the table below.
A)0.6
B)-1
C)-0.6
D)0.8
E)12
A)0.6
B)-1
C)-0.6
D)0.8
E)12
Unlock Deck
Unlock for access to all 78 flashcards in this deck.
Unlock Deck
k this deck
49
Owners of a small shop tracked the number of customers and the sales each hour for a 7 hour period.The results are recorded in the table below.
A)0.744
B)0.725
C)-0.763
D)0.763
E)0.801
A)0.744
B)0.725
C)-0.763
D)0.763
E)0.801
Unlock Deck
Unlock for access to all 78 flashcards in this deck.
Unlock Deck
k this deck
50
A reporter investigates speeding on roads in a county and finds a correlation of 0.961 between the number of speeding tickets and the numbers of kilometres of well-paved roads.Assuming that the relation is linear,does it mean that there are more speeding tickets on well-paved roads?
A)Yes: the relation is linear.
B)No: speeding is a categorical variable.
C)Yes: the two variables are quantitative.
D)No: the correlation does not imply causality.
E)Yes: the correlation is close to 1.
A)Yes: the relation is linear.
B)No: speeding is a categorical variable.
C)Yes: the two variables are quantitative.
D)No: the correlation does not imply causality.
E)Yes: the correlation is close to 1.
Unlock Deck
Unlock for access to all 78 flashcards in this deck.
Unlock Deck
k this deck
51
A Science instructor assigns a group of students to investigate the relationship between their grade point average and their consistency in studying.The correlation between GPA and studying consistency is 0.857.Assume that the relation is linear.Describe the association.
A)Strong linear relation in a negative direction
B)Strong curved relation in a positive direction
C)Weak linear relation in a positive direction
D)Strong linear relation in a positive direction
E)No evidence of relation
A)Strong linear relation in a negative direction
B)Strong curved relation in a positive direction
C)Weak linear relation in a positive direction
D)Strong linear relation in a positive direction
E)No evidence of relation
Unlock Deck
Unlock for access to all 78 flashcards in this deck.
Unlock Deck
k this deck
52
Adam would like to buy a used car,and collected several data to evaluate the best model (such as age,price,weight,etc.)Thanks to a scatterplot,he established that the relation between age and weight is somewhat linear.He calculated that the correlation between age and weight is 0.515.Describe the association.
A)Weak linear relation
B)No evidence of relation
C)Weak linear relation in a positive direction
D)Weak linear relation in a negative direction
E)Strong linear relation in a positive direction
A)Weak linear relation
B)No evidence of relation
C)Weak linear relation in a positive direction
D)Weak linear relation in a negative direction
E)Strong linear relation in a positive direction
Unlock Deck
Unlock for access to all 78 flashcards in this deck.
Unlock Deck
k this deck
53
A science instructor assigns a group of students to investigate the linear relationship between the pH of the water of a river and its water's hardness (measured in grains).Some students wrote these conclusions: "My correlation of -0.85 shows that there is almost no association between pH of the water and water's hardness." Is the interpretation of the correlation appropriate?
A)Yes: a correlation of -0.85 shows a weak relation in a negative direction.
B)No: correlation is always positive.
C)No: a correlation of -0.85 shows a strong relation in a negative direction.
D)Yes: pH and hardness of water do not have the same units.
E)No: the pH and the hardness of the water are data collected from the same river.
Unlock Deck
Unlock for access to all 78 flashcards in this deck.
Unlock Deck
k this deck
54
Soda is often considered unhealthy because its content is high in both caffeine and refined sugar.But are the two related? Caffeine and refined sugar contents (in milligrams)of 12 ounces of several brands of soda are shown on the following scatterplot.The correlation between caffeine and refined sugar is 0.189.Describe the association.
A)Weak linear relation in a positive direction
B)Weak nonlinear relation in a positive direction
C)Weak curved relation in a positive direction
D)No evidence of relation
E)Strong linear relation in a positive direction
A)Weak linear relation in a positive direction
B)Weak nonlinear relation in a positive direction
C)Weak curved relation in a positive direction
D)No evidence of relation
E)Strong linear relation in a positive direction
Unlock Deck
Unlock for access to all 78 flashcards in this deck.
Unlock Deck
k this deck
55
The paired data below consist of the height of children (in cm)and their reading scores.
A)0.933
B)0.883
C)0.988
D)0.978
E)0.982
A)0.933
B)0.883
C)0.988
D)0.978
E)0.982
Unlock Deck
Unlock for access to all 78 flashcards in this deck.
Unlock Deck
k this deck
56
Two different tests are designed to measure employee productivity and dexterity.Several employees are randomly selected and tested with these results. 36 75
A)-0.280
B)0.986
C)0.159
D)0.471
E)0.115
A)-0.280
B)0.986
C)0.159
D)0.471
E)0.115
Unlock Deck
Unlock for access to all 78 flashcards in this deck.
Unlock Deck
k this deck
57
A science instructor assigns a group of students to investigate the relationship between the pH of the water of a river and its water's hardness (measured in grains).Some students wrote these conclusions: "there was a very strong correlation of 0.902 grains between pH of the water and water's hardness." Is the calculation of the correlation appropriate?
A)No: there is little or no association.
B)Yes: the pH and the hardness of the water are data collected from the same river.
C)No: pH and hardness of water have different units.
D)Yes: correlation is less than 1.
E)No: correlation has no units.
A)No: there is little or no association.
B)Yes: the pH and the hardness of the water are data collected from the same river.
C)No: pH and hardness of water have different units.
D)Yes: correlation is less than 1.
E)No: correlation has no units.
Unlock Deck
Unlock for access to all 78 flashcards in this deck.
Unlock Deck
k this deck
58
A study is conducted on insects growth based on hydrometry.The correlation found between insects growth and hydrometry is 0.05.A journalist concludes that a low correlation between insects growth and hydrometry shows that insects can reproduce easily in a dry climate.Do you agree with this interpretation?
A)No: the correlation must be negative.
B)Yes: the correlation is close to 0.
C)Yes: the two variables are quantitative.
D)No: the relation must be linear.
E)Yes: the relation is linear.
A)No: the correlation must be negative.
B)Yes: the correlation is close to 0.
C)Yes: the two variables are quantitative.
D)No: the relation must be linear.
E)Yes: the relation is linear.
Unlock Deck
Unlock for access to all 78 flashcards in this deck.
Unlock Deck
k this deck
59
A study was conducted to compare the average time spent in the lab each week versus course grade for computer students.The results are recorded in the table below. Number of hours spent in lab Grade (percent)
10 96
11 51
16 62
9 58
7 89
15 81
16 46
10 51
A)-0.284
B)-0.335
C)0.371
D)0.462
E)0.017
10 96
11 51
16 62
9 58
7 89
15 81
16 46
10 51
A)-0.284
B)-0.335
C)0.371
D)0.462
E)0.017
Unlock Deck
Unlock for access to all 78 flashcards in this deck.
Unlock Deck
k this deck
60
To get the best deal on a microwave oven,Amanda called six appliance stores and asked the cost and volume of several models.The prices and volumes she was quoted are listed below.
Unlock Deck
Unlock for access to all 78 flashcards in this deck.
Unlock Deck
k this deck
61
Dioxins are a class of long-lived and highly toxic pollutants.The topsoil concentration of dioxins in parts per million (ppm)are shown in the table below as a function of the distance from the dump. Re-express the dioxin concentration by taking the reciprocal square root of the data,then plot the re-expressed data as a scatterplot.
Re-express the dioxin concentration by taking the reciprocal square root of the data,then plot the re-expressed data as a scatterplot. Unlock Deck
Unlock for access to all 78 flashcards in this deck.
Unlock Deck
k this deck
62
One of the important factors determining a car's fuel efficiency is its weight.This relationship is examined for 11 cars,and the association is shown in the scatterplot below. What re-expression of Y might be appropriate?
A)log y gallons per mile
B)100 ? gallons per 100 miles
C)-100 ? gallons per 100 miles
D)100 ? gallons per 100 miles
E)100 ? gallons per 100 miles
What re-expression of Y might be appropriate?A)log y gallons per mile
B)100 ? gallons per 100 miles
C)-100 ? gallons per 100 miles
D)100 ? gallons per 100 miles
E)100 ? gallons per 100 miles
Unlock Deck
Unlock for access to all 78 flashcards in this deck.
Unlock Deck
k this deck
63
Fast food is often considered unhealthy because much of it is high in both fat and calories.But are the two related? Here are the fat (in grams)and calories contents of several brands of burgers.If the fat was recorded in kilograms,how would this change the correlation? Suppose the relation is linear.
A)Yes: the two variables do not have the same units.
B)No: the relation is linear.
C)Yes: correlation changes with change of units.
D)No: correlation changes with change of units.
E)No: correlation does not change with change of units.
A)Yes: the two variables do not have the same units.
B)No: the relation is linear.
C)Yes: correlation changes with change of units.
D)No: correlation changes with change of units.
E)No: correlation does not change with change of units.
Unlock Deck
Unlock for access to all 78 flashcards in this deck.
Unlock Deck
k this deck
64
A teacher studied students' grades and established with a scatterplot a strong correlation between SAT scores and college grades.Find the lurking variable,if there is one.
A)College
B)High school
C)IQ
D)Attendance
E)No lurking variable
A)College
B)High school
C)IQ
D)Attendance
E)No lurking variable
Unlock Deck
Unlock for access to all 78 flashcards in this deck.
Unlock Deck
k this deck
65
Data collected from students in Statistics classes included their heights (in inches)and weights (in pounds).For the and weights,the correlation is 0.653.Suppose the variable weight is recorded in kilograms rather than in pounds.What will be the correlation?
A)0.653 in./kg
B)-0.653
C)0.653 kg/in.
D)0.653
E)1.438 in./kg
A)0.653 in./kg
B)-0.653
C)0.653 kg/in.
D)0.653
E)1.438 in./kg
Unlock Deck
Unlock for access to all 78 flashcards in this deck.
Unlock Deck
k this deck
66
A clothes shop owner tries to predict the winter collection sales by displaying the coats sales (in dollars)and the outside temperature (in degrees Fahrenheit)on the following scatterplot.He calculates that the correlation between coats sales and temperature is -0.737.Suppose the variable temperature is recorded in degrees Celsius rather than in degrees Fahrenheit.What will be the correlation?
A)-0.737 F ? $
B)-18.187 F ? $
C)0.737
D)-0.737 F / $
E)-0.737
A)-0.737 F ? $
B)-18.187 F ? $
C)0.737
D)-0.737 F / $
E)-0.737
Unlock Deck
Unlock for access to all 78 flashcards in this deck.
Unlock Deck
k this deck
67
A university radio station has been airing a public service announcement (PSA)that gives a telephone number students can call to get information on upcoming campus events.In order to determine the optimal number of times per day to run the PSA,the station has been counting the number of calls generated each day as a function of the number of times the PSA was aired.The results of the experiment are summarized in the table below. Re-express the data by squaring the number of calls per day,then plot the re-expressed data as a scatterplot.
Re-express the data by squaring the number of calls per day,then plot the re-expressed data as a scatterplot. Unlock Deck
Unlock for access to all 78 flashcards in this deck.
Unlock Deck
k this deck
68
An economist noticed that nations with more TV sets have higher life expectancies.He established with a scatterplot a high positive correlation between length of life and number of TV sets.Find the lurking variable,if there is one.
A)Sofa
B)TV sets brands
C)Popcorn
D)Wealth of the nation
E)No lurking variable
A)Sofa
B)TV sets brands
C)Popcorn
D)Wealth of the nation
E)No lurking variable
Unlock Deck
Unlock for access to all 78 flashcards in this deck.
Unlock Deck
k this deck
69
The relationship between two quantities X and Y is examined,and the association is shown in the scatterplot below. What re-expression of Y should be tried as a starting point?
A)log (Y)against X
B) against X
C) against X
D) against X
E) against X
What re-expression of Y should be tried as a starting point?A)log (Y)against X
B) against X
C) against X
D) against X
E) against X
Unlock Deck
Unlock for access to all 78 flashcards in this deck.
Unlock Deck
k this deck
70
The relationship between two quantities X and Y is examined,and the association is shown in the scatterplot below. Should you re-express these data before trying to fit a model? Explain.
A)Data should be re-expressed.Scatterplot shows upward curvature and increasing scatter as X increases.
B)Data should be re-expressed.Scatterplot shows linear relationship and uniform scatter.
C)Data does not need to be re-expressed.Scatterplot shows upward curvature and increasing scatter as X increases.
D)Data should be re-expressed.Scatterplot shows linear relationship.
E)Data does not need to be re-expressed.Scatterplot shows linear relationship.
Should you re-express these data before trying to fit a model? Explain.A)Data should be re-expressed.Scatterplot shows upward curvature and increasing scatter as X increases.
B)Data should be re-expressed.Scatterplot shows linear relationship and uniform scatter.
C)Data does not need to be re-expressed.Scatterplot shows upward curvature and increasing scatter as X increases.
D)Data should be re-expressed.Scatterplot shows linear relationship.
E)Data does not need to be re-expressed.Scatterplot shows linear relationship.
Unlock Deck
Unlock for access to all 78 flashcards in this deck.
Unlock Deck
k this deck
71
A study shows that the amount of chocolate consumed in Canada and the number of automobile accidents is positively related.Find the lurking variable,if there is one.
A)Vacation
B)Speed
C)Children
D)Population growth
E)No lurking variable
A)Vacation
B)Speed
C)Children
D)Population growth
E)No lurking variable
Unlock Deck
Unlock for access to all 78 flashcards in this deck.
Unlock Deck
k this deck
72
A psychology graduate student is studying the effect of alcohol intoxication on a person's ability to perform manual tasks.In a very simple experiment,a subject's blood alcohol level is brought to a certain level and then the subject is presented with 10 rope knots.The subject then attempts to untie as many knots as he or she can in 30 seconds.The results of the experiments are summarized in the table below. Re-express the number of knots untied by taking the inverse of each count,then plot the re-expressed data as a scatterplot.
Re-express the number of knots untied by taking the inverse of each count,then plot the re-expressed data as a scatterplot. Unlock Deck
Unlock for access to all 78 flashcards in this deck.
Unlock Deck
k this deck
73
A reporter studied the causes of a fire to a house,and established thanks to a scatterplot a strong correlation between the damages (in dollars)and the number of firefighters at the scene.Find the lurking variable,if there is one.
A)Size of the blaze
B)Size of the house
C)Weather
D)Firefighters
E)No lurking variable
A)Size of the blaze
B)Size of the house
C)Weather
D)Firefighters
E)No lurking variable
Unlock Deck
Unlock for access to all 78 flashcards in this deck.
Unlock Deck
k this deck
74
The consumer price index (CPI)is a measure of the relative cost of goods in a country for a particular year.The table below shows the CPI for various years beginning in 1940. Re-express the CPI by taking the log of the data,then plot the re-expressed data as a scatterplot.
Re-express the CPI by taking the log of the data,then plot the re-expressed data as a scatterplot. Unlock Deck
Unlock for access to all 78 flashcards in this deck.
Unlock Deck
k this deck
75
The paired data below consist of the height (in cm)of children and their reading scores.If the height was recorded in inches,what would be the correlation?
A)-0.983
B)0.387
C)1.567
D)2.497
E)0.982
A)-0.983
B)0.387
C)1.567
D)2.497
E)0.982
Unlock Deck
Unlock for access to all 78 flashcards in this deck.
Unlock Deck
k this deck
76
In a school,a scientist observed children during lunch time over several months to study how much they eat and for how many minutes.He evaluated in calories what each child ate each day for lunch.After careful observations,he found that the variables time and calories relate linearly,and that the correlation between those variables is 0.629.Suppose he was to record time in hours rather than in minutes.Would the correlation change?
A)No: correlation does not change with change of units.
B)Yes: correlation changes with change of units.
C)No: correlation changes with change of units.
D)No: the relation is linear.
E)Yes: the two variables do not have the same units.
A)No: correlation does not change with change of units.
B)Yes: correlation changes with change of units.
C)No: correlation changes with change of units.
D)No: the relation is linear.
E)Yes: the two variables do not have the same units.
Unlock Deck
Unlock for access to all 78 flashcards in this deck.
Unlock Deck
k this deck
77
A study of consumer behavior finds a positive correlation between sales of ice cream and sales of soda.What might explain the strong correlation?
A)Ice cream creates a thirst for beer
B)Outdoor temperature
C)People generally have ice cream for dessert if they have drunk soda with a meal.
D)Arithmetic mistake
E)No lurking variable
A)Ice cream creates a thirst for beer
B)Outdoor temperature
C)People generally have ice cream for dessert if they have drunk soda with a meal.
D)Arithmetic mistake
E)No lurking variable
Unlock Deck
Unlock for access to all 78 flashcards in this deck.
Unlock Deck
k this deck
78
A researcher studies children in elementary school and finds a strong positive linear association between shoe size and reading skills.Find the lurking variable,if there is one.
A)School
B)Grade of students
C)Shoe brand
D)Age
E)No lurking variable
A)School
B)Grade of students
C)Shoe brand
D)Age
E)No lurking variable
Unlock Deck
Unlock for access to all 78 flashcards in this deck.
Unlock Deck
k this deck
Unlock Deck
Unlock for access to all 78 flashcards in this deck.


