Exam 6: Scatterplots, association, and Correlation
Exam 1: Stats Starts Here33 Questions
Exam 2: Displaying and Describing Categorical Data70 Questions
Exam 3: Displaying and Summarizing Quantitative Data148 Questions
Exam 4: Understanding and Comparing Distributions46 Questions
Exam 5: The Standard Deviation As a Ruler and the Normal Model111 Questions
Exam 6: Scatterplots, association, and Correlation78 Questions
Exam 7: Linear Regression71 Questions
Exam 8: Regression Wisdom32 Questions
Exam 9: Understanding Randomness26 Questions
Exam 10: Sample Surveys64 Questions
Exam 11: Experiments and Observational Studies80 Questions
Exam 12: From Randomness to Probability69 Questions
Exam 13: Probability Rules95 Questions
Exam 14: Random Variables215 Questions
Exam 15: Sampling Distribution Models51 Questions
Exam 16: Confidence Intervals for Proportions71 Questions
Exam 17: Testing Hypotheses About Proportions44 Questions
Exam 18: More About Tests67 Questions
Exam 19: Comparing Two Proportions53 Questions
Exam 20: Inferences About Means123 Questions
Exam 21: Comparing Means50 Questions
Exam 22: Paired Samples and Blocks35 Questions
Exam 23: Comparing Counts76 Questions
Exam 24: Inferences for Regression57 Questions
Exam 25: Analysis of Variance39 Questions
Exam 26: Multifactor Analysis of Variance22 Questions
Exam 27: Multiple Regression22 Questions
Exam 28: Multiple Regression Wisdom21 Questions
Exam 29: Rank-Based Nonparametric Tests29 Questions
Exam 30: The Bootstrap27 Questions
Select questions type
A science instructor assigns a group of students to investigate the relationship between the pH of the water of a river and its water's hardness (measured in grains).Some students wrote these conclusions: "there was a very strong correlation of 0.902 grains between pH of the water and water's hardness." Is the calculation of the correlation appropriate?
Free
(Multiple Choice)
4.8/5  (32)
(32)
Correct Answer: Verified
E
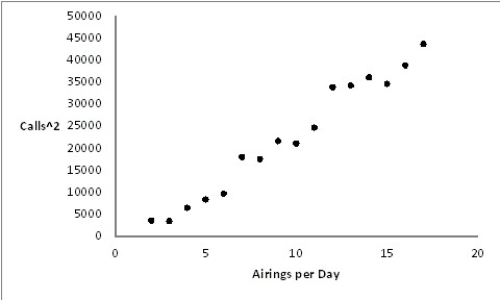
A university radio station has been airing a public service announcement (PSA)that gives a telephone number students can call to get information on upcoming campus events.In order to determine the optimal number of times per day to run the PSA,the station has been counting the number of calls generated each day as a function of the number of times the PSA was aired.The results of the experiment are summarized in the table below. number of number of number of number of airings calls per airings cakks per Per dat dat per day day 1 59 9 145 2 58 10 157 3 80 11 184 4 91 12 185 5 98 13 190 6 134 14 186 7 132 15 197 8 147 16 209 Re-express the data by squaring the number of calls per day,then plot the re-expressed data as a scatterplot. 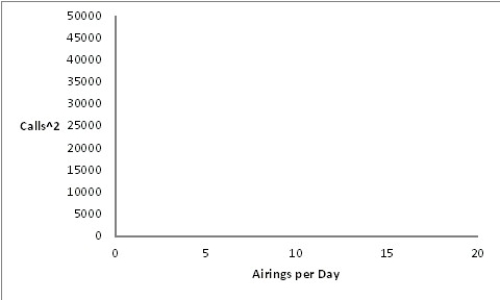
Free
(Essay)
4.9/5 (40)
Correct Answer:Verified
A science instructor assigns a group of students to investigate the linear relationship between the pH of the water of a river and its water's hardness (measured in grains).Some students wrote these conclusions: "My correlation of -0.85 shows that there is almost no association between pH of the water and water's hardness." Is the interpretation of the correlation appropriate?
Free
(Multiple Choice)
4.8/5 (37)
Correct Answer:Verified
C
A science instructor assigns a group of students to investigate the relationship between the pH of the water of a river and its water's hardness (measured in grains).Some students wrote these conclusions: "there was a very strong correlation of 1.35 between pH of the water and water's hardness." Is the calculation of the correlation appropriate?
(Multiple Choice)
4.9/5 (36)
A ceramics factory can fire seven large batches of pottery per day.Sometimes in the process a few of the pieces break.In order to understand the problem better,the factory records the number of broken pieces in each batch for 3 days and then creates the scatterplot shown.Make a histogram showing the distribution of the number of broken pieces in the 21 batches of pottery examined. 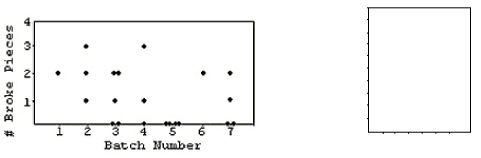
(Essay)
4.9/5 (26)
An economist noticed that nations with more TV sets have higher life expectancies.He established with a scatterplot a high positive correlation between length of life and number of TV sets.Find the lurking variable,if there is one.
(Multiple Choice)
4.9/5 (37)
The paired data below consist of the test scores of 6 randomly selected students and the number of hours they studied for the test. Hours Score 5 64 10 86 4 69 6 86 10 59 9 87
(Multiple Choice)
5.0/5 (36)
One of the important factors determining a car's fuel efficiency is its weight.This relationship is examined for 11 cars,and the association is shown in the scatterplot below. 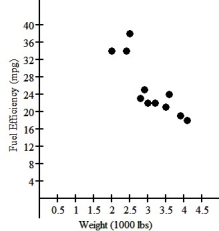 What re-expression of Y might be appropriate?
(Multiple Choice)
4.8/5 (32)
A group of persons filled in a questionnaire their age and the number of countries they had visited in their lifetime.The results are recorded in the table below. Age States Visited 26 8 27 25 26 20 43 8 34 10 59 40 54 17 60 35 44 25
(Multiple Choice)
4.8/5 (32)
The consumer price index (CPI)is a measure of the relative cost of goods in a country for a particular year.The table below shows the CPI for various years beginning in 1940. Year CPI 1940 14.0 1950 24.1 1960 29.6 1970 38.8 1980 82.4 1990 130.7 2000 172.2 Re-express the CPI by taking the log of the data,then plot the re-expressed data as a scatterplot. 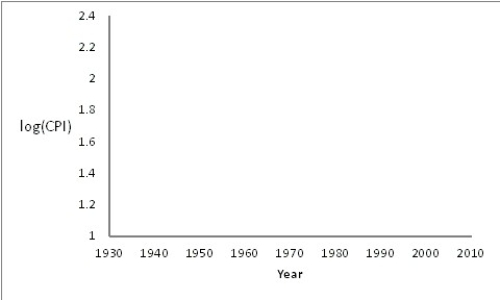
(Essay)
4.8/5 (39)
Soda is often considered unhealthy because its content is high in both caffeine and refined sugar.But are the two related? Caffeine and refined sugar contents (in milligrams)of 12 ounces of several brands of soda are shown on the following scatterplot.The correlation between caffeine and refined sugar is 0.189.Describe the association. 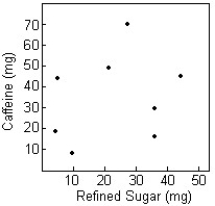
(Multiple Choice)
4.7/5 (37)
A psychology graduate student is studying the effect of alcohol intoxication on a person's ability to perform manual tasks.In a very simple experiment,a subject's blood alcohol level is brought to a certain level and then the subject is presented with 10 rope knots.The subject then attempts to untie as many knots as he or she can in 30 seconds.The results of the experiments are summarized in the table below. Blood No. of Blood No. of Alcohol Knots Alcohol Knots Level Untied Level Untied 0.03 4 0.05 3 0.06 1 0.02 5 0.06 2 0.01 10 0.01 10 0.07 1 0.04 2 0.09 1 0.04 3 0.09 1 0.08 1 0.03 3 0.06 2 0.07 2 0.04 4 0.05 3 Re-express the number of knots untied by taking the inverse of each count,then plot the re-expressed data as a scatterplot. 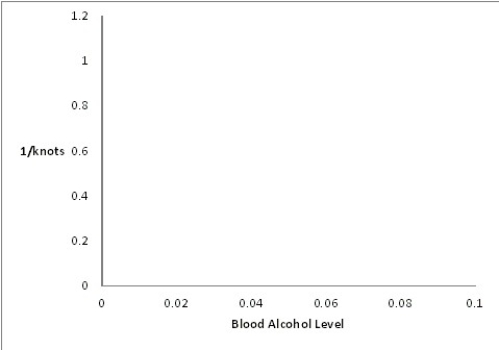
(Essay)
4.9/5 (33)
A study of consumer behavior finds a positive correlation between sales of ice cream and sales of soda.What might explain the strong correlation?
(Multiple Choice)
4.9/5 (29)
In a school,a scientist observed children during lunch time over several months to study how much they eat and for how many minutes.He evaluated in calories what each child ate each day for lunch.After careful observations,he found that the variables time and calories relate linearly,and that the correlation between those variables is 0.629.Suppose he was to record time in hours rather than in minutes.Would the correlation change?
(Multiple Choice)
4.9/5 (33)
Filters
- Essay(0)
- Multiple Choice(0)
- Short Answer(0)
- True False(0)
- Matching(0)