Deck 3: Descriptive Statistics
Full screen (f)
Question
Question
Question
Question
Question
Question
Question
Question
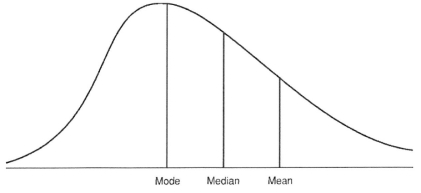
What does the vertical line in the normal distribution represent?
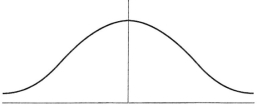
A)Median
B)Mode
C)Mean
D)Central tendency
A)Median
B)Mode
C)Mean
D)Central tendency
Question
Question
Question
Question
Question
Question
Question
Question
Question
Question
Question
Question
Question
Question
Question
Question
Question
Question
Using the bell curve below,answer the questions that follow.
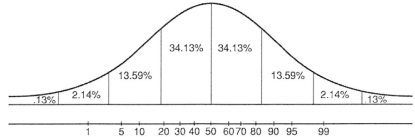
-Point b on the normal distribution represents the IQ cut-off score for which disability category?
A)Learning disability
B)Gifted
C)Mental retardation
D)Autism
-Point b on the normal distribution represents the IQ cut-off score for which disability category?
A)Learning disability
B)Gifted
C)Mental retardation
D)Autism
Question
Question
Question
Question
Using the bell curve below,answer the questions that follow.
-Point a on the normal distribution represents the IQ cut-off score for which disability category?
A)Learning disability
B)Gifted
C)Mental retardation
D)Autism
-Point a on the normal distribution represents the IQ cut-off score for which disability category?
A)Learning disability
B)Gifted
C)Mental retardation
D)Autism
Question
Question
Question
A graph of class data is below.What is this type of graph called?
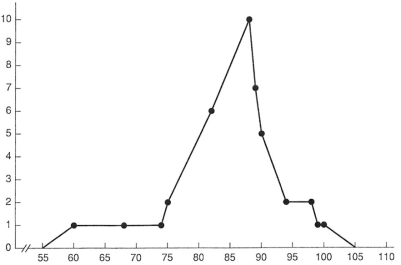
A)Frequency distribution
B)Normal distribution
C)Bell curve
D)Frequency polygon
A)Frequency distribution
B)Normal distribution
C)Bell curve
D)Frequency polygon
Question
Question
Question
Question
Question
What type of distribution is depicted below?
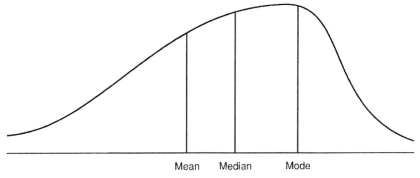
A)Positive skew-Large number of scores occur below the mean.
B)Positive skew-Large number of scores occur above the mean.
C)Negative skew-Large number of scores occur below the mean.
D)Negative skew-Large number of scores occur above the mean.
A)Positive skew-Large number of scores occur below the mean.
B)Positive skew-Large number of scores occur above the mean.
C)Negative skew-Large number of scores occur below the mean.
D)Negative skew-Large number of scores occur above the mean.
Question
What type of distribution is depicted below?
A)Positive skew-Large number of scores occur below the mean.
B)Positive skew-Large number of scores occur above the mean.
C)Negative skew-Large number of scores occur below the mean.
D)Negative skew-Large number of scores occur above the mean.
A)Positive skew-Large number of scores occur below the mean.
B)Positive skew-Large number of scores occur above the mean.
C)Negative skew-Large number of scores occur below the mean.
D)Negative skew-Large number of scores occur above the mean.
Question
Question
Question
Question
Question
Question
Question

Unlock Deck
Sign up to unlock the cards in this deck!
Unlock Deck
Unlock Deck
1/46
Play
Full screen (f)
Deck 3: Descriptive Statistics
1
Organizing data to see how the data cluster is called
A)Measures of Dispersion
B)Measures of Central Tendency
C)Frequency
D)Normal Distribution
A)Measures of Dispersion
B)Measures of Central Tendency
C)Frequency
D)Normal Distribution
B
2
This term is used when a national sample of students of the same age/grade take the same assessment and establish a mean and standard deviation.
A)Norm-referenced
B)Standardized
C)Derived scores
D)Measures of central tendency
A)Norm-referenced
B)Standardized
C)Derived scores
D)Measures of central tendency
A
3
Using the information below,answer the questions that follow.
Miss Bridget teaches in a small learning support class.The follow are the data from a recent math assessment from three of her students: 84,80,74.
What is the variance?
A)4.11
B)10
C)79.33
D)16.8889
Miss Bridget teaches in a small learning support class.The follow are the data from a recent math assessment from three of her students: 84,80,74.
What is the variance?
A)4.11
B)10
C)79.33
D)16.8889
D
4
In a normal distribution,most students' scores fall at the edges of the bell curve.
Unlock Deck
Unlock for access to all 46 flashcards in this deck.
Unlock Deck
k this deck
5
In order for a score to be considered significant it must be at least two standard deviations from the mean.
Unlock Deck
Unlock for access to all 46 flashcards in this deck.
Unlock Deck
k this deck
6
Median is another name for simple average.
Unlock Deck
Unlock for access to all 46 flashcards in this deck.
Unlock Deck
k this deck
7
The number of times a score occurs in a distribution can be determined by completing a frequency count.
Unlock Deck
Unlock for access to all 46 flashcards in this deck.
Unlock Deck
k this deck
8
What does the vertical line in the normal distribution represent?
A)Median
B)Mode
C)Mean
D)Central tendency
A)Median
B)Mode
C)Mean
D)Central tendency
Unlock Deck
Unlock for access to all 46 flashcards in this deck.
Unlock Deck
k this deck
9
This scale's numbers are used for identification that ranks greater or lesser quality or amount.The numbers are equidistant on the scale.
A)ratio
B)interval
C)ordinal
D)nominal
A)ratio
B)interval
C)ordinal
D)nominal
Unlock Deck
Unlock for access to all 46 flashcards in this deck.
Unlock Deck
k this deck
10
A multimodal distribution means that there are three or more modes.
Unlock Deck
Unlock for access to all 46 flashcards in this deck.
Unlock Deck
k this deck
11
Large sets of data are organized and understood through methods known as Measures of Central Tendency.
Unlock Deck
Unlock for access to all 46 flashcards in this deck.
Unlock Deck
k this deck
12
This scale is used for direct comparisons and mathematical manipulations.The numbers on the scale are equidistant from each other and have a true meaning of absolute zero.
A)ratio
B)interval
C)ordinal
D)nominal
A)ratio
B)interval
C)ordinal
D)nominal
Unlock Deck
Unlock for access to all 46 flashcards in this deck.
Unlock Deck
k this deck
13
When students enroll in school and are provided with an identification number-a combination of letters and numbers-this number is on the ___ scale.
A)ratio
B)interval
C)ordinal
D)nominal
A)ratio
B)interval
C)ordinal
D)nominal
Unlock Deck
Unlock for access to all 46 flashcards in this deck.
Unlock Deck
k this deck
14
The square root of the variance is the sum of squares.
Multiple Choice
Multiple Choice
Unlock Deck
Unlock for access to all 46 flashcards in this deck.
Unlock Deck
k this deck
15
Which number is representative of a raw score?
A)Total test items = 25
B)Correct answers = 20
C)Incorrect answers = 5
D)Ratio = 20/25
A)Total test items = 25
B)Correct answers = 20
C)Incorrect answers = 5
D)Ratio = 20/25
Unlock Deck
Unlock for access to all 46 flashcards in this deck.
Unlock Deck
k this deck
16
Derived scores allow professionals to compare how a student performed on a task in comparison with a larger group.
Unlock Deck
Unlock for access to all 46 flashcards in this deck.
Unlock Deck
k this deck
17
Variance is described as the degree or amount of dispersion in a data set.
Unlock Deck
Unlock for access to all 46 flashcards in this deck.
Unlock Deck
k this deck
18
It is possible for the mean score to become influenced by an extreme score in the data set.
Unlock Deck
Unlock for access to all 46 flashcards in this deck.
Unlock Deck
k this deck
19
Students who participated in the science fair were ranked by category and received first-,second-,and third-place ribbons.This is an example of what type of scale?
A)ratio
B)interval
C)ordinal
D)nominal
A)ratio
B)interval
C)ordinal
D)nominal
Unlock Deck
Unlock for access to all 46 flashcards in this deck.
Unlock Deck
k this deck
20
Organizing data to see how the data spread away from the mean is called
A)Measures of Dispersion
B)Measures of Central Tendency
C)Frequency
D)Normal Distribution
A)Measures of Dispersion
B)Measures of Central Tendency
C)Frequency
D)Normal Distribution
Unlock Deck
Unlock for access to all 46 flashcards in this deck.
Unlock Deck
k this deck
21
A person with an obtained IQ score of 115 would have a z score of:
A)+1
B)+2
C)0
D)-1
A)+1
B)+2
C)0
D)-1
Unlock Deck
Unlock for access to all 46 flashcards in this deck.
Unlock Deck
k this deck
22
Using the data set below,answer the questions that follow.
-What is the mean?
A)69
B)63
C)26
D)67
-What is the mean?
A)69
B)63
C)26
D)67
Unlock Deck
Unlock for access to all 46 flashcards in this deck.
Unlock Deck
k this deck
23
Using the data set below,answer the questions that follow.
-What is the range?
A)50
B)76
C)29
D)63
-What is the range?
A)50
B)76
C)29
D)63
Unlock Deck
Unlock for access to all 46 flashcards in this deck.
Unlock Deck
k this deck
24
Why should care be taken when interpreting results whose distributions are positively or negatively skewed?
Unlock Deck
Unlock for access to all 46 flashcards in this deck.
Unlock Deck
k this deck
25
Using the data set below,answer the questions that follow.
-What is the median?
A)69
B)76
C)26
D)67
-What is the median?
A)69
B)76
C)26
D)67
Unlock Deck
Unlock for access to all 46 flashcards in this deck.
Unlock Deck
k this deck
26
Using the bell curve below,answer the questions that follow.
-Point b on the normal distribution represents the IQ cut-off score for which disability category?
A)Learning disability
B)Gifted
C)Mental retardation
D)Autism
-Point b on the normal distribution represents the IQ cut-off score for which disability category?
A)Learning disability
B)Gifted
C)Mental retardation
D)Autism
Unlock Deck
Unlock for access to all 46 flashcards in this deck.
Unlock Deck
k this deck
27
Explain how a mean scores can be influenced by extreme scores in a data set.
Unlock Deck
Unlock for access to all 46 flashcards in this deck.
Unlock Deck
k this deck
28
When the mean score is represented as ± 2,what type of score is this?
A)Decile
B)T-score
C)Stanine
D)Z-score
A)Decile
B)T-score
C)Stanine
D)Z-score
Unlock Deck
Unlock for access to all 46 flashcards in this deck.
Unlock Deck
k this deck
29
What is a normal distribution and why is it important in understanding student performance?
Unlock Deck
Unlock for access to all 46 flashcards in this deck.
Unlock Deck
k this deck
30
Using the bell curve below,answer the questions that follow.
-Point a on the normal distribution represents the IQ cut-off score for which disability category?
A)Learning disability
B)Gifted
C)Mental retardation
D)Autism
-Point a on the normal distribution represents the IQ cut-off score for which disability category?
A)Learning disability
B)Gifted
C)Mental retardation
D)Autism
Unlock Deck
Unlock for access to all 46 flashcards in this deck.
Unlock Deck
k this deck
31
How are the measures of central tendency different than the measures of dispersion?
Unlock Deck
Unlock for access to all 46 flashcards in this deck.
Unlock Deck
k this deck
32
Discuss at least five different mistakes made by professionals in the identification process.
Unlock Deck
Unlock for access to all 46 flashcards in this deck.
Unlock Deck
k this deck
33
A graph of class data is below.What is this type of graph called?
A)Frequency distribution
B)Normal distribution
C)Bell curve
D)Frequency polygon
A)Frequency distribution
B)Normal distribution
C)Bell curve
D)Frequency polygon
Unlock Deck
Unlock for access to all 46 flashcards in this deck.
Unlock Deck
k this deck
34
What is the percentile rank that is equivalent to the mean?
A)20
B)50
C)80
D)90
A)20
B)50
C)80
D)90
Unlock Deck
Unlock for access to all 46 flashcards in this deck.
Unlock Deck
k this deck
35
Using the information below,answer the questions that follow.
Miss Bridget teaches in a small learning support class.The follow are the data from a recent math assessment from three of her students: 84,80,74.
What is the standard deviation?
A)4.11
B)10
C)79.33
D)16.8889
Miss Bridget teaches in a small learning support class.The follow are the data from a recent math assessment from three of her students: 84,80,74.
What is the standard deviation?
A)4.11
B)10
C)79.33
D)16.8889
Unlock Deck
Unlock for access to all 46 flashcards in this deck.
Unlock Deck
k this deck
36
A person who scores at the 85%tile scored as well or better than ___.
A)14% of the students in that age/grade.
B)84% of the students in that age/grade.
C)85% of the students in that age/grade.
D)15% of the students in that age/grade.
A)14% of the students in that age/grade.
B)84% of the students in that age/grade.
C)85% of the students in that age/grade.
D)15% of the students in that age/grade.
Unlock Deck
Unlock for access to all 46 flashcards in this deck.
Unlock Deck
k this deck
37
What type of score is derived when scores are divided into 10 groups,and each group represents 10% of the obtained scores?
A)Decile
B)T-score
C)Stanine
D)Z-score
A)Decile
B)T-score
C)Stanine
D)Z-score
Unlock Deck
Unlock for access to all 46 flashcards in this deck.
Unlock Deck
k this deck
38
What type of distribution is depicted below?
A)Positive skew-Large number of scores occur below the mean.
B)Positive skew-Large number of scores occur above the mean.
C)Negative skew-Large number of scores occur below the mean.
D)Negative skew-Large number of scores occur above the mean.
A)Positive skew-Large number of scores occur below the mean.
B)Positive skew-Large number of scores occur above the mean.
C)Negative skew-Large number of scores occur below the mean.
D)Negative skew-Large number of scores occur above the mean.
Unlock Deck
Unlock for access to all 46 flashcards in this deck.
Unlock Deck
k this deck
39
What type of distribution is depicted below?
A)Positive skew-Large number of scores occur below the mean.
B)Positive skew-Large number of scores occur above the mean.
C)Negative skew-Large number of scores occur below the mean.
D)Negative skew-Large number of scores occur above the mean.
A)Positive skew-Large number of scores occur below the mean.
B)Positive skew-Large number of scores occur above the mean.
C)Negative skew-Large number of scores occur below the mean.
D)Negative skew-Large number of scores occur above the mean.
Unlock Deck
Unlock for access to all 46 flashcards in this deck.
Unlock Deck
k this deck
40
Using the data set below,answer the questions that follow.
-What is the mode?
A)26
B)76
C)68
D)69
-What is the mode?
A)26
B)76
C)68
D)69
Unlock Deck
Unlock for access to all 46 flashcards in this deck.
Unlock Deck
k this deck
41
Define and provide an example of the four different numerical scales.
Unlock Deck
Unlock for access to all 46 flashcards in this deck.
Unlock Deck
k this deck
42
Explain why it is important to graph data.
Unlock Deck
Unlock for access to all 46 flashcards in this deck.
Unlock Deck
k this deck
43
What is a mean difference and why should members of the field be particularly interested in its effects.
Unlock Deck
Unlock for access to all 46 flashcards in this deck.
Unlock Deck
k this deck
44
What are the four steps required to calculating variance.
Unlock Deck
Unlock for access to all 46 flashcards in this deck.
Unlock Deck
k this deck
45
There is great debate in the field regarding the types of scores yielded from assessments.Which scores do you think will be most valuable to you? Why?
Unlock Deck
Unlock for access to all 46 flashcards in this deck.
Unlock Deck
k this deck
46
Why is it necessary to understand the average performance of students in a particular grade or age level?
Unlock Deck
Unlock for access to all 46 flashcards in this deck.
Unlock Deck
k this deck
Unlock Deck
Unlock for access to all 46 flashcards in this deck.


