Exam 3: Descriptive Statistics
Exam 1: An Introduction42 Questions
Exam 2: Laws, Ethics, and Issues47 Questions
Exam 3: Descriptive Statistics46 Questions
Exam 4: Reliability and Validity47 Questions
Exam 5: An Introduction to Norm-Referenced Assessment46 Questions
Exam 6: Curriculum-Based Assessment and Other Informal Measures43 Questions
Exam 7: Response to Intervention46 Questions
Exam 8: Academic Assessment45 Questions
Exam 9: Assessment of Behavior47 Questions
Exam 10: Measurement of Intelligence and Adaptive Behavior46 Questions
Exam 11: Special Considerations of Assessment in Early Childhood47 Questions
Exam 12: Special Considerations of Assessment in Transition34 Questions
Exam 13: Interpreting Assessment for Educational Intervention36 Questions
Select questions type
What is a normal distribution and why is it important in understanding student performance?
Free
(Essay)
4.8/5  (36)
(36)
Correct Answer: Verified
A normal distribution represents the way test scores would fall if a test was given to every single student of the same age or grade in the population.It is typically depicted by the bell curve.
It is important in understanding student performance because it can be used to show how students,as a group,performed on a measure indicating excellent,average,or poor performance.
Using the data set below,answer the questions that follow.
Score Tally Frequency 76 11111 5 72 1 1 69 1 1 68 11 2 67 1 1 52 1 1 51 1 1 50 1 1
-What is the median?
Free
(Multiple Choice)
4.8/5 (30)
Correct Answer:Verified
A
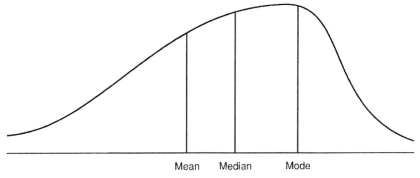
What type of distribution is depicted below?
Free
(Multiple Choice)
4.8/5 (38)
Correct Answer:Verified
C
When the mean score is represented as ± 2,what type of score is this?
(Multiple Choice)
4.8/5 (37)
How are the measures of central tendency different than the measures of dispersion?
(Essay)
4.9/5 (43)
This scale is used for direct comparisons and mathematical manipulations.The numbers on the scale are equidistant from each other and have a true meaning of absolute zero.
(Multiple Choice)
4.8/5 (38)
In a normal distribution,most students' scores fall at the edges of the bell curve.
(True/False)
4.8/5 (40)
The number of times a score occurs in a distribution can be determined by completing a frequency count.
(True/False)
4.9/5 (39)
What type of score is derived when scores are divided into 10 groups,and each group represents 10% of the obtained scores?
(Multiple Choice)
4.9/5 (30)
Using the information below,answer the questions that follow.
Miss Bridget teaches in a small learning support class.The follow are the data from a recent math assessment from three of her students: 84,80,74.
-What is the standard deviation?
(Multiple Choice)
4.8/5 (37)
This term is used when a national sample of students of the same age/grade take the same assessment and establish a mean and standard deviation.
(Multiple Choice)
4.8/5 (34)
Discuss at least five different mistakes made by professionals in the identification process.
(Essay)
4.9/5 (37)
Derived scores allow professionals to compare how a student performed on a task in comparison with a larger group.
(True/False)
4.8/5 (40)
What is the percentile rank that is equivalent to the mean?
(Multiple Choice)
4.8/5 (38)
Using the bell curve below,answer the questions that follow.
b. \downarrow a. \downarrow 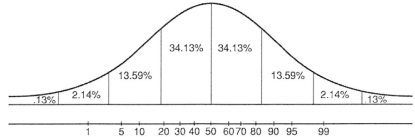 -Point a on the normal distribution represents the IQ cut-off score for which disability category?
(Multiple Choice)
4.9/5 (40)
In order for a score to be considered significant it must be at least two standard deviations from the mean.
(True/False)
4.9/5 (38)
Organizing data to see how the data spread away from the mean is called
(Multiple Choice)
4.8/5 (38)
Filters
- Essay(0)
- Multiple Choice(0)
- Short Answer(0)
- True False(0)
- Matching(0)