Deck 51: Population Ecology
Full screen (f)
Question
Question
Question
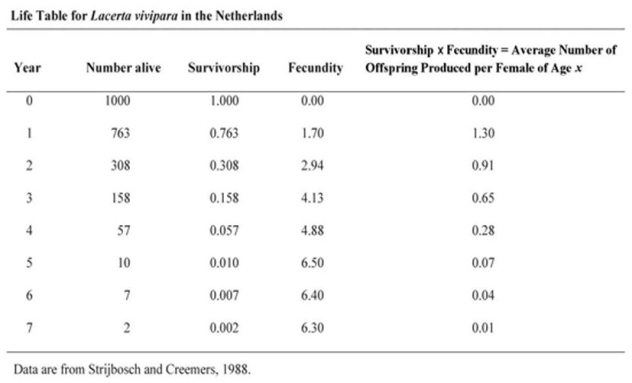
Using the accompanying life table, calculate the net reproductive rate (R0) for this population.
A) 2.00
B) 3.26
C) 1.30
D) 2.31
Question
Use the survivorship curves in the accompanying figure to answer the following questions. 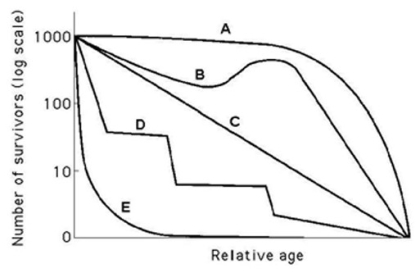 Referring to the figure, which curve best describes survivorship in elephants?
A) A
B) B
C) C
D) D
E) E
Referring to the figure, which curve best describes survivorship in elephants?A) A
B) B
C) C
D) D
E) E
Question
Using the life table, how would you describe the population dynamics of L. vivipara?
A) The population is increasing.
B) The population is decreasing.
C) The population is stable.
D) The figure does not provide this information.
Question
Question
Question
Question
Question
Question
In the figure, which of the following survivorship curves most applies to humans living in developed countries?
A) curve A
B) curve B
C) curve C
D) curve A or curve B
Question
Question
In the accompanying figure, which of the following survivorship curves implies that an animal may lay many eggs with the same probability of dying each year of life?
A) curve A
B) curve B
C) curve C
Question
Question
Question
Question
Question
Question
Using the life table, determine which age class year would hurt the population growth most if it were wiped out by disease.
A) age class year 1
B) age class year 2
C) age class year 3
D) age class year 4
E) age class year 5
Question
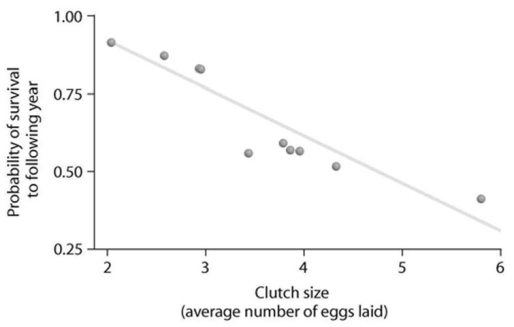 Looking at the data in the accompanying figure, what can be said about survival and clutch size?
A) Animals with low survival tend to have smaller clutch sizes.
B) Large clutch size correlates with low survival.
C) Animals with high survival tend to have larger clutch sizes.
D) Probability of survivorship does not correlate with clutch size.
Question
Question
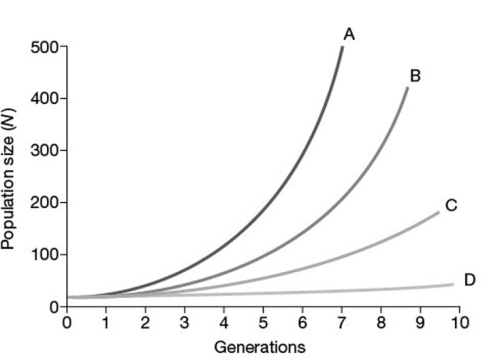
In the accompanying figure, which of the lines represents the highest per capita rate increase (r)?
A) line A
B) line B
C) line C
D) line D
Question
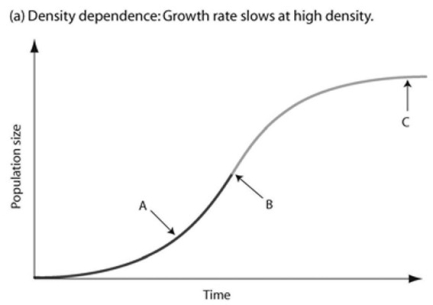
In the accompanying figure, which of the arrows represents the carrying capacity?
A) arrow A
B) arrow B
C) arrow C
D) Carrying capacity cannot be found in the figure because species under density-dependent control never reach carrying capacity.
Question
Question
Assuming that these populations are density dependent, what would be the likely outcome if the system depicted in the previous figure were allowed to continue?
A) Population growth would continue to be discontinuous.
B) Individual growth would continue to be indeterminate.
C) Population growth would likely decrease.
D) Populations would go extinct.
Question
In the accompanying figure, which of the lines represents exponential growth?
A) line A
B) line B
C) line C
D) line D
E) All of the lines represent exponential growth.
Question
Question
Question
Question
In the accompanying figure, which of the arrows represents the most rapid population growth?
A) arrow A
B) arrow B
C) arrow C
Question
Question
Question
Question
Which statements about K are correct?
I) K varies among populations.
II) K varies in space.
III) K varies in time.
IV) K is constant for any given species.
A) only I and III
B) only II and IV
C) only I, II, and III
D) only II, III, and IV
E) only I, II, and IV
Question
A population of ground squirrels has an annual per capita birth rate of 0.06 and an annual per capita death rate of 0.02. Calculate an estimate of the total number of individuals added to (or lost from) a population of 1000 individuals in one year.
A) 120 individuals added
B) 40 individuals added
C) 20 individuals added
D) 400 individuals added
E) 20 individuals lost
Question
Question
Question
Question
As N approaches K for a certain population, which of the following is predicted by the logistic equation?
A) The growth rate will not change.
B) The growth rate will approach zero.
C) The population will show an Allee effect.
D) The population will increase exponentially.
E) The carrying capacity of the environment will increase.
Question
According to the logistic growth equation,  = rmaxN
,
A) the number of individuals added per unit time is greatest when N is close to zero.
B) the per capita growth rate (r) increases as N approaches K.
C) population growth is zero when N equals K.
D) the population grows exponentially when K is small.
E) the birth rate (b) approaches zero as N approaches K.
= rmaxN ,
A) the number of individuals added per unit time is greatest when N is close to zero.
B) the per capita growth rate (r) increases as N approaches K.
C) population growth is zero when N equals K.
D) the population grows exponentially when K is small.
E) the birth rate (b) approaches zero as N approaches K.
Question
Question
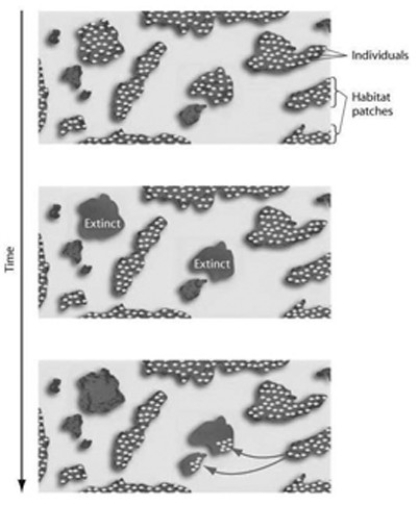 The figure shown here represents the dynamics of ________.
A) metapopulations
B) extinction
C) emigration
D) both metapopulations and extinction
E) both extinction and emigration
Question
Question
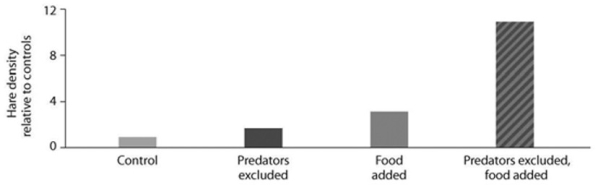 Looking at the data in the accompanying figure from the hare/lynx experiment, what conclusion can you draw?
I) Food is a factor in controlling hare population size.
II) Excluding lynx is a factor in controlling hare population size.
III) The effect of excluding predators and adding food in the same experiment is greater than the sum of excluding lynx alone plus adding food alone.
A) only I
B) only II
C) only III
D) only II and III
E) I, II, and III
Question
Question
Question
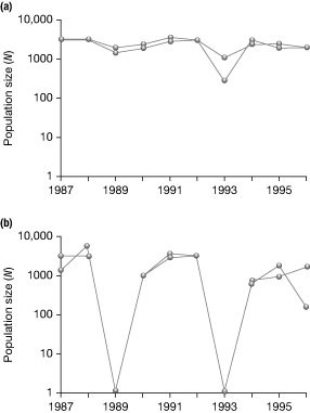 Graph (b) in the accompanying figure shows the normal fluctuations of a population of grouse. Assuming graph (a) in the figure is the result of some experimental treatment in the grouse population, what can be concluded?
A) The experimental treatment exacerbated the population cycling.
B) The experimental treatment did not affect population cycling in this species.
C) The experimental treatment has most likely identified the cause of population cycling.
D) None of the other responses is true.
Question
Question
Question
Question
Question
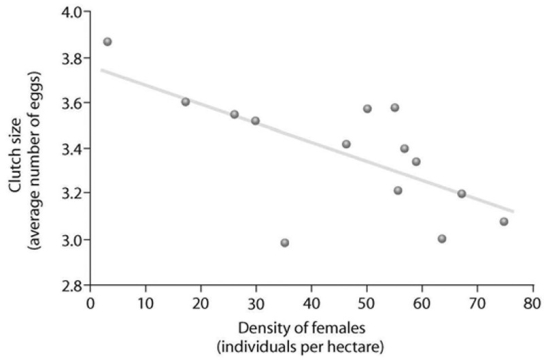 Based on the accompanying figure, which of the following statements correctly interprets the data?
A) As female density increases, clutch size increases.
B) As female density increases, survivorship decreases.
C) Clutch size decreases as female density increases.
Question
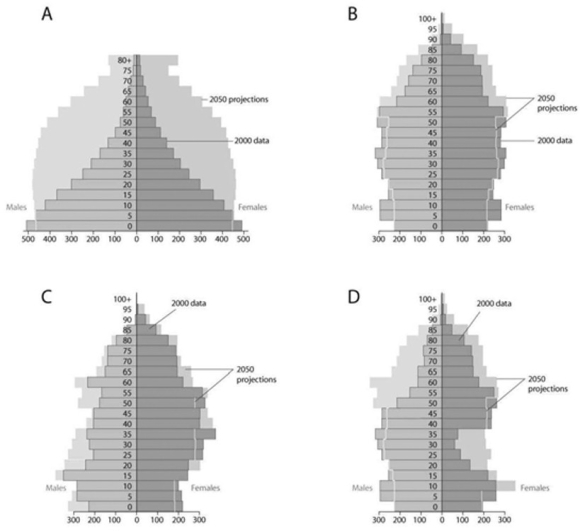 Based on the diagrams in the figure shown and on the large population of baby boomers in the United States, which graph best reflects U.S. population in 20 years?
A) A
B) B
C) C
D) D
Question
Often the growth cycle of one population has an effect on the cycle of another. As moose populations increase, for example, wolf populations also increase. Thus, if we are considering the logistic equation for the wolf population, ΔN/Δt = rN  , which of the factors accounts for the effect of the moose population?
A) r
B) N
C) rN
D) K
E) dt
, which of the factors accounts for the effect of the moose population?A) r
B) N
C) rN
D) K
E) dt
Question
Question
Question
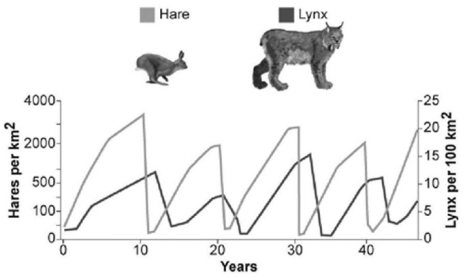 What conclusion can you draw from the accompanying figure?
A) Hares control lynx population size.
B) Lynx control hare population size.
C) Lynx and hare populations are independent of each other.
D) The relationship between the populations cannot be determined only from this graph.

Unlock Deck
Sign up to unlock the cards in this deck!
Unlock Deck
Unlock Deck
1/57
Play
Full screen (f)
Deck 51: Population Ecology
1
Which of the following groups would be most likely to exhibit uniform dispersion?
A) red squirrels, which actively defend territories
B) cattails, which grow primarily at edges of lakes and streams
C) dwarf mistletoes, which parasitize particular species of forest tree
D) moths, in a city at night
E) lake trout, which seek out cold, deep water high in dissolved oxygen
A) red squirrels, which actively defend territories
B) cattails, which grow primarily at edges of lakes and streams
C) dwarf mistletoes, which parasitize particular species of forest tree
D) moths, in a city at night
E) lake trout, which seek out cold, deep water high in dissolved oxygen
A
2
Why can't a female lizard have both high fecundity and high survival?
A) In only rare cases, do lizards have both high fecundity and high survival.
B) Female lizards are able to produce only one set of offspring.
C) Competition for resources prevents this.
D) The more energy the female devotes to offspring, the less that can be devoted to her survival.
E) The female is already maximizing the number of eggs she lays, and if she attempts to nest later in the season, there will not be enough food for her young.
D
3
Using the accompanying life table, calculate the net reproductive rate (R0) for this population.
A) 2.00
B) 3.26
C) 1.30
D) 2.31
B
4
Use the survivorship curves in the accompanying figure to answer the following questions. Referring to the figure, which curve best describes survivorship in elephants?
A) A
B) B
C) C
D) D
E) E
Referring to the figure, which curve best describes survivorship in elephants?A) A
B) B
C) C
D) D
E) E
Unlock Deck
Unlock for access to all 57 flashcards in this deck.
Unlock Deck
k this deck
5
Using the life table, how would you describe the population dynamics of L. vivipara?
A) The population is increasing.
B) The population is decreasing.
C) The population is stable.
D) The figure does not provide this information.
Unlock Deck
Unlock for access to all 57 flashcards in this deck.
Unlock Deck
k this deck
6
An ecologist recorded 12 white-tailed deer, Odocoileus virginianus, per square kilometer in one woodlot and 20 per square kilometer in another woodlot. What was the ecologist comparing?
A) density
B) dispersion
C) carrying capacity
D) cohorts
E) range
A) density
B) dispersion
C) carrying capacity
D) cohorts
E) range
Unlock Deck
Unlock for access to all 57 flashcards in this deck.
Unlock Deck
k this deck
7
A population is correctly defined as having which of the following characteristics?
I) inhabiting the same general area
II) belonging to the same species
III) possessing a constant and uniform density and dispersion
A) I only
B) III only
C) I and II only
D) II and III only
E) I, II, and III
I) inhabiting the same general area
II) belonging to the same species
III) possessing a constant and uniform density and dispersion
A) I only
B) III only
C) I and II only
D) II and III only
E) I, II, and III
Unlock Deck
Unlock for access to all 57 flashcards in this deck.
Unlock Deck
k this deck
8
Which of the following choices would most likely promote random distribution?
A) territorial species
B) species that secrete chemicals to attract or inhibit other individuals
C) flocking and schooling behaviors
D) spacing during the breeding season
E) homogeneous chemical and physical factors in the environment
A) territorial species
B) species that secrete chemicals to attract or inhibit other individuals
C) flocking and schooling behaviors
D) spacing during the breeding season
E) homogeneous chemical and physical factors in the environment
Unlock Deck
Unlock for access to all 57 flashcards in this deck.
Unlock Deck
k this deck
9
What is the primary limiting factor that determines why no female animal can produce a very large number of very large eggs?
A) Time is limited.
B) There are energy constraints.
C) Temperature constraints will prevent females from carrying too many eggs.
D) Male availability is limited.
E) There will be an increase in predation pressure if the females carry too many large eggs.
A) Time is limited.
B) There are energy constraints.
C) Temperature constraints will prevent females from carrying too many eggs.
D) Male availability is limited.
E) There will be an increase in predation pressure if the females carry too many large eggs.
Unlock Deck
Unlock for access to all 57 flashcards in this deck.
Unlock Deck
k this deck
10
Which of the following scenarios would provide the most relevant data on population density?
A) Count the number of nests of a particular species of songbird and multiply this by a factor that extrapolates these data to actual animals.
B) Count the number of pine trees in several randomly selected 10-meter-square plots and extrapolate this number to the fraction of the study area these plots represent.
C) Use the mark-recapture method to estimate the size of the population.
D) Calculate the difference between all of the immigrants and emigrants to see if the population is growing or shrinking.
E) Add the number of births and subtract the individuals that die to see if the population's density is increasing or decreasing.
Unlock Deck
Unlock for access to all 57 flashcards in this deck.
Unlock Deck
k this deck
11
In the figure, which of the following survivorship curves most applies to humans living in developed countries?
A) curve A
B) curve B
C) curve C
D) curve A or curve B
Unlock Deck
Unlock for access to all 57 flashcards in this deck.
Unlock Deck
k this deck
12
Random spacing patterns in plants such as the creosote bush are most often associated with ________.
A) chance
B) patterns of high humidity
C) the random distribution of seeds
D) competitive interaction between individuals of the same population
E) the concentration of nutrients within the population's range
A) chance
B) patterns of high humidity
C) the random distribution of seeds
D) competitive interaction between individuals of the same population
E) the concentration of nutrients within the population's range
Unlock Deck
Unlock for access to all 57 flashcards in this deck.
Unlock Deck
k this deck
13
In the accompanying figure, which of the following survivorship curves implies that an animal may lay many eggs with the same probability of dying each year of life?
A) curve A
B) curve B
C) curve C
Unlock Deck
Unlock for access to all 57 flashcards in this deck.
Unlock Deck
k this deck
14
Suppose researchers marked 800 turtles and later were able to trap a total of 300 individuals in that population, of which 150 were marked. What is the estimate for total population size?
A) 200
B) 1050
C) 1600
D) 2100
A) 200
B) 1050
C) 1600
D) 2100
Unlock Deck
Unlock for access to all 57 flashcards in this deck.
Unlock Deck
k this deck
15
Which of the following examples would most accurately measure the density of the population being studied?
A) counting the number of prairie dog burrows per hectare
B) counting the number of times a 1-kilometer transect is intersected by tracks of red squirrels after a snowfall
C) counting the number of coyote droppings per hectare
D) counting the number of moss plants in 1-square-meter quadrants
E) counting the number of zebras from airplane census observations.
Unlock Deck
Unlock for access to all 57 flashcards in this deck.
Unlock Deck
k this deck
16
To measure the population of lake trout in a 250-hectare lake, 400 individual trout were netted and marked with a fin clip, then returned to the lake. The next week, the lake was netted again, and out of the 200 lake trout that were caught, 50 had fin clips. Using the mark-recapture estimate, the lake trout population size could be closest to which of the following?
A) 160
B) 200
C) 400
D) 1600
E) 80,000
A) 160
B) 200
C) 400
D) 1600
E) 80,000
Unlock Deck
Unlock for access to all 57 flashcards in this deck.
Unlock Deck
k this deck
17
You observe two female fish of the same species breeding. One female lays 100 eggs and the other female lays 1000 eggs. Which one of the following is LEAST likely given the limits of fitness trade-offs?
A) The female laying 100 eggs breeds more often than the female laying 1000 eggs.
B) The female laying 100 eggs lives longer than the female laying 1000 eggs.
C) The eggs from the female laying 1000 eggs have larger yolks than the yolks of the eggs from the female laying 100 eggs.
D) The female laying 1000 eggs is larger than the female laying 100 eggs.
Unlock Deck
Unlock for access to all 57 flashcards in this deck.
Unlock Deck
k this deck
18
Which of the following is the most important assumption for the mark-recapture method to estimate the size of wildlife populations?
A) All females in the population have the same litter size.
B) More individuals emigrate from, as opposed to immigrate into, a population.
C) Over 50% of the marked individuals need to be trapped during the recapture phase.
D) There is a 50:50 ratio of males to females in the population before and after trapping and recapture.
E) Marked individuals have the same probability of being recaptured as unmarked individuals during the recapture phase.
Unlock Deck
Unlock for access to all 57 flashcards in this deck.
Unlock Deck
k this deck
19
Using the life table, determine which age class year would hurt the population growth most if it were wiped out by disease.
A) age class year 1
B) age class year 2
C) age class year 3
D) age class year 4
E) age class year 5
Unlock Deck
Unlock for access to all 57 flashcards in this deck.
Unlock Deck
k this deck
20
Looking at the data in the accompanying figure, what can be said about survival and clutch size?A) Animals with low survival tend to have smaller clutch sizes.
B) Large clutch size correlates with low survival.
C) Animals with high survival tend to have larger clutch sizes.
D) Probability of survivorship does not correlate with clutch size.
Unlock Deck
Unlock for access to all 57 flashcards in this deck.
Unlock Deck
k this deck
21
Natural selection involves energetic trade-offs between ________.
A) choosing how many offspring to produce over the course of a lifetime and how long to live
B) producing large numbers of gametes when employing internal fertilization versus fewer numbers of gametes when employing external fertilization
C) the emigration of individuals when they are no longer reproductively capable or committing suicide
D) increasing the number of individuals produced during each reproductive episode and a corresponding decrease in parental care
E) high survival rates of offspring and the cost of parental care
Unlock Deck
Unlock for access to all 57 flashcards in this deck.
Unlock Deck
k this deck
22
In the accompanying figure, which of the lines represents the highest per capita rate increase (r)?
A) line A
B) line B
C) line C
D) line D
Unlock Deck
Unlock for access to all 57 flashcards in this deck.
Unlock Deck
k this deck
23
In the accompanying figure, which of the arrows represents the carrying capacity?
A) arrow A
B) arrow B
C) arrow C
D) Carrying capacity cannot be found in the figure because species under density-dependent control never reach carrying capacity.
Unlock Deck
Unlock for access to all 57 flashcards in this deck.
Unlock Deck
k this deck
24
If 60 snow geese were alive in 1926 and 856 existed in 2001, what is r?
A) 0.070
B) 0.035
C) 0.094
A) 0.070
B) 0.035
C) 0.094
Unlock Deck
Unlock for access to all 57 flashcards in this deck.
Unlock Deck
k this deck
25
Assuming that these populations are density dependent, what would be the likely outcome if the system depicted in the previous figure were allowed to continue?
A) Population growth would continue to be discontinuous.
B) Individual growth would continue to be indeterminate.
C) Population growth would likely decrease.
D) Populations would go extinct.
Unlock Deck
Unlock for access to all 57 flashcards in this deck.
Unlock Deck
k this deck
26
In the accompanying figure, which of the lines represents exponential growth?
A) line A
B) line B
C) line C
D) line D
E) All of the lines represent exponential growth.
Unlock Deck
Unlock for access to all 57 flashcards in this deck.
Unlock Deck
k this deck
27
During exponential growth, a population always ________.
A) grows by thousands of individuals
B) grows at its maximum per capita rate
C) quickly reaches its carrying capacity
D) cycles through time
E) loses some individuals to emigration
A) grows by thousands of individuals
B) grows at its maximum per capita rate
C) quickly reaches its carrying capacity
D) cycles through time
E) loses some individuals to emigration
Unlock Deck
Unlock for access to all 57 flashcards in this deck.
Unlock Deck
k this deck
28
Which of the following best defines a cohort?
A) a group of individuals that inhabits a small isolated region within the range for the species
B) all of the individuals that are annually added to a population by birth and immigration
C) the reproductive males and females within the population
D) a group of individuals from the same age group, from birth until they are all dead
E) the number of individuals that annually die or emigrate out of a population
Unlock Deck
Unlock for access to all 57 flashcards in this deck.
Unlock Deck
k this deck
29
The definition of a generation is ________.
A) 20 years
B) the average time between a mother's first offspring and her daughter's first offspring
C) the average time between a father's first offspring and his son's first offspring
D) the average time between parents' first offspring and their child's first offspring
A) 20 years
B) the average time between a mother's first offspring and her daughter's first offspring
C) the average time between a father's first offspring and his son's first offspring
D) the average time between parents' first offspring and their child's first offspring
Unlock Deck
Unlock for access to all 57 flashcards in this deck.
Unlock Deck
k this deck
30
In the accompanying figure, which of the arrows represents the most rapid population growth?
A) arrow A
B) arrow B
C) arrow C
Unlock Deck
Unlock for access to all 57 flashcards in this deck.
Unlock Deck
k this deck
31
Carrying capacity is ________.
A) seldom reached by marine producers and consumers because of the vast resources of the ocean
B) the maximum population size that a particular environment can support
C) fixed for most species over most of their range most of the time
D) determined by density and dispersion data
E) the term used to describe the stress a population undergoes due to limited resources
Unlock Deck
Unlock for access to all 57 flashcards in this deck.
Unlock Deck
k this deck
32
The study of factors that determine the size and structure of populations through time is called ________.
A) community ecology
B) immigration biology
C) demography
D) logistic growth
A) community ecology
B) immigration biology
C) demography
D) logistic growth
Unlock Deck
Unlock for access to all 57 flashcards in this deck.
Unlock Deck
k this deck
33
A population's carrying capacity ________.
A) may change as environmental conditions change
B) can be accurately calculated using the logistic growth model
C) generally remains constant over time
D) increases as the per capita growth rate (r) decreases
E) can never be exceeded
A) may change as environmental conditions change
B) can be accurately calculated using the logistic growth model
C) generally remains constant over time
D) increases as the per capita growth rate (r) decreases
E) can never be exceeded
Unlock Deck
Unlock for access to all 57 flashcards in this deck.
Unlock Deck
k this deck
34
Which statements about K are correct?
I) K varies among populations.
II) K varies in space.
III) K varies in time.
IV) K is constant for any given species.
A) only I and III
B) only II and IV
C) only I, II, and III
D) only II, III, and IV
E) only I, II, and IV
Unlock Deck
Unlock for access to all 57 flashcards in this deck.
Unlock Deck
k this deck
35
A population of ground squirrels has an annual per capita birth rate of 0.06 and an annual per capita death rate of 0.02. Calculate an estimate of the total number of individuals added to (or lost from) a population of 1000 individuals in one year.
A) 120 individuals added
B) 40 individuals added
C) 20 individuals added
D) 400 individuals added
E) 20 individuals lost
Unlock Deck
Unlock for access to all 57 flashcards in this deck.
Unlock Deck
k this deck
36
Why do populations grow more slowly as they approach their carrying capacity?
A) Density-dependent factors lead to fewer births and increased mortality.
B) Density-independent factors lead to fewer births and increased mortality.
C) Hormonal changes promote higher death rates in crowded populations.
D) Individuals voluntarily stop mating so that overcrowding does not occur.
E) The incoming energy decreases in populations experiencing a high rate of increase.
Unlock Deck
Unlock for access to all 57 flashcards in this deck.
Unlock Deck
k this deck
37
Which of the following terms defines how the individual organism allocates resources to growth, reproduction, and activities or structures related to survival?
A) survivorship
B) life history
C) energy budget
D) demography
A) survivorship
B) life history
C) energy budget
D) demography
Unlock Deck
Unlock for access to all 57 flashcards in this deck.
Unlock Deck
k this deck
38
In models of logistic population growth, ________.
A) the population growth rate slows dramatically as N approaches K
B) new individuals are added to the population most rapidly at the beginning of the population's growth
C) new individuals are added to the population as N approaches K
D) only density-dependent factors affect the rate of population growth
E) carrying capacity is never reached
Unlock Deck
Unlock for access to all 57 flashcards in this deck.
Unlock Deck
k this deck
39
As N approaches K for a certain population, which of the following is predicted by the logistic equation?
A) The growth rate will not change.
B) The growth rate will approach zero.
C) The population will show an Allee effect.
D) The population will increase exponentially.
E) The carrying capacity of the environment will increase.
Unlock Deck
Unlock for access to all 57 flashcards in this deck.
Unlock Deck
k this deck
40
According to the logistic growth equation, = rmaxN
,
A) the number of individuals added per unit time is greatest when N is close to zero.
B) the per capita growth rate (r) increases as N approaches K.
C) population growth is zero when N equals K.
D) the population grows exponentially when K is small.
E) the birth rate (b) approaches zero as N approaches K.
= rmaxN ,
A) the number of individuals added per unit time is greatest when N is close to zero.
B) the per capita growth rate (r) increases as N approaches K.
C) population growth is zero when N equals K.
D) the population grows exponentially when K is small.
E) the birth rate (b) approaches zero as N approaches K.
Unlock Deck
Unlock for access to all 57 flashcards in this deck.
Unlock Deck
k this deck
41
Which of the following statements regarding the future of populations in developing countries are correct?
I) The fecundity is predicted to increase.
II) Survivorship will increase.
III) Overall population size will increase dramatically.
IV) The number of offspring each year is predicted to remain high.
A) only I and III
B) only II and IV
C) only I, II, and IV
D) only II, III, and IV
E) only I, II, and III
Unlock Deck
Unlock for access to all 57 flashcards in this deck.
Unlock Deck
k this deck
42
The figure shown here represents the dynamics of ________.A) metapopulations
B) extinction
C) emigration
D) both metapopulations and extinction
E) both extinction and emigration
Unlock Deck
Unlock for access to all 57 flashcards in this deck.
Unlock Deck
k this deck
43
Which of the following could be a density-independent factor limiting human population growth?
A) Ebola infections
B) earthquakes
C) epidemic of measles
D) famines
A) Ebola infections
B) earthquakes
C) epidemic of measles
D) famines
Unlock Deck
Unlock for access to all 57 flashcards in this deck.
Unlock Deck
k this deck
44
Looking at the data in the accompanying figure from the hare/lynx experiment, what conclusion can you draw?I) Food is a factor in controlling hare population size.
II) Excluding lynx is a factor in controlling hare population size.
III) The effect of excluding predators and adding food in the same experiment is greater than the sum of excluding lynx alone plus adding food alone.
A) only I
B) only II
C) only III
D) only II and III
E) I, II, and III
Unlock Deck
Unlock for access to all 57 flashcards in this deck.
Unlock Deck
k this deck
45
Imagine that you are managing a large game ranch. You know from historical accounts that a species of deer used to live there, but they have been extirpated. After doing some research to determine what might be an appropriately sized founding population, you reintroduce them. You then watch the population increase for several generations, and graph the number of individuals (vertical axis) against the number of generations (horizontal axis). With no natural predators impacting the population, the graph will likely appear as ________.
A) a diagonal line, getting higher with each generation
B) an "S" that ends with a vertical line
C) an upside-down "U"
D) a "J," increasing with each generation
A) a diagonal line, getting higher with each generation
B) an "S" that ends with a vertical line
C) an upside-down "U"
D) a "J," increasing with each generation
Unlock Deck
Unlock for access to all 57 flashcards in this deck.
Unlock Deck
k this deck
46
Conservationists will take snow geese off the endangered species list when the population hits 10,000. If populations are sustaining growth at r = 0.088 and the population in 2001 is 3000 individuals, in what year will snow geese be taken off the endangered species list?
A) between 2106 and 2109
B) between 2009 and 2012
C) between 2012 and 2015
D) between 2015 and 2018
A) between 2106 and 2109
B) between 2009 and 2012
C) between 2012 and 2015
D) between 2015 and 2018
Unlock Deck
Unlock for access to all 57 flashcards in this deck.
Unlock Deck
k this deck
47
Graph (b) in the accompanying figure shows the normal fluctuations of a population of grouse. Assuming graph (a) in the figure is the result of some experimental treatment in the grouse population, what can be concluded?A) The experimental treatment exacerbated the population cycling.
B) The experimental treatment did not affect population cycling in this species.
C) The experimental treatment has most likely identified the cause of population cycling.
D) None of the other responses is true.
Unlock Deck
Unlock for access to all 57 flashcards in this deck.
Unlock Deck
k this deck
48
What cannot be determined from examining age pyramids of human populations?
A) the future population size
B) the age structure of the population
C) the success of future generations
D) the fecundity of a future population
A) the future population size
B) the age structure of the population
C) the success of future generations
D) the fecundity of a future population
Unlock Deck
Unlock for access to all 57 flashcards in this deck.
Unlock Deck
k this deck
49
Use the following abstract from Theoretical Population Biology to answer the question.
Abstract:
We derive measures for assessing the value of an individual habitat fragment for the dynamics and persistence of a metapopulation living in a network of many fragments. We demonstrate that the most appropriate measure of fragment value depends on the question asked. Specifically, we analyze four alternative measures: the contribution of a fragment to the metapopulation capacity of the network, to the equilibrium metapopulation size, to the expected time to metapopulation extinction and the long-term contribution of a fragment to colonization events in the network. The latter measure is comparable to density-dependent measures in general matrix population theory, though some differences are introduced by the fact that "density dependence" is spatially localized in the metapopulation context. We show that the value of a fragment depends not only on the properties of the landscape but also on the properties of the species. Most importantly, variation in fragment values between the habitat fragments is greatest in the case of rare species that occur close to the extinction threshold, as these species are likely to be restricted to the most favorable parts of the landscape. We expect that the measures of habitat fragment described and analyzed here have applications in landscape ecology and in conservation biology.
Copyright © 2003 Elsevier Inc. All rights reserved. (Otso Ovaskainen and Ilkka Hanski. 2003. How much does an individual habitat fragment contribute to metapopulation dynamics and persistence? Theoretical Population Biology 64:481-95.)
One measure for the value of the patch was given by the long-term contribution of a fragment to colonization events in the network. How do the properties of a landscape and the properties of a species affect the value of a patch? The value of the fragment depends ________.
A) on the properties of the landscape and the properties of the species
B) only on the properties of the landscape and not on the properties of the species
C) not on the properties of the landscape but only on the properties of the species
D) on neither the properties of the landscape nor on the properties of the species
Unlock Deck
Unlock for access to all 57 flashcards in this deck.
Unlock Deck
k this deck
50
It is estimated that a flock of wood buffalo crane should be able to sustain an r of 0.085 for the foreseeable future. If the flock currently contains 350 individuals, how long will it take for that population to double?
A) between 7.0 and 9.0 years
B) between 9.0 and 11.0 years
C) between 11.0 and 13.0 years
D) less than 7 years
E) more than 13 years
A) between 7.0 and 9.0 years
B) between 9.0 and 11.0 years
C) between 11.0 and 13.0 years
D) less than 7 years
E) more than 13 years
Unlock Deck
Unlock for access to all 57 flashcards in this deck.
Unlock Deck
k this deck
51
Which statement is TRUE with regard to human population growth?
A) It is at a zero reproduction rate.
B) Its rate of increase continues to grow at an exponential rate.
C) Its rate of growth is slowing.
D) Its rate of growth is increasing.
E) There is no scientific prediction that can be made about human population growth.
A) It is at a zero reproduction rate.
B) Its rate of increase continues to grow at an exponential rate.
C) Its rate of growth is slowing.
D) Its rate of growth is increasing.
E) There is no scientific prediction that can be made about human population growth.
Unlock Deck
Unlock for access to all 57 flashcards in this deck.
Unlock Deck
k this deck
52
Based on the accompanying figure, which of the following statements correctly interprets the data?A) As female density increases, clutch size increases.
B) As female density increases, survivorship decreases.
C) Clutch size decreases as female density increases.
Unlock Deck
Unlock for access to all 57 flashcards in this deck.
Unlock Deck
k this deck
53
Based on the diagrams in the figure shown and on the large population of baby boomers in the United States, which graph best reflects U.S. population in 20 years?A) A
B) B
C) C
D) D
Unlock Deck
Unlock for access to all 57 flashcards in this deck.
Unlock Deck
k this deck
54
Often the growth cycle of one population has an effect on the cycle of another. As moose populations increase, for example, wolf populations also increase. Thus, if we are considering the logistic equation for the wolf population, ΔN/Δt = rN , which of the factors accounts for the effect of the moose population?
A) r
B) N
C) rN
D) K
E) dt
, which of the factors accounts for the effect of the moose population?A) r
B) N
C) rN
D) K
E) dt
Unlock Deck
Unlock for access to all 57 flashcards in this deck.
Unlock Deck
k this deck
55
The regular fluctuations in size of animal populations are termed ________.
I) population cycles
II) population dynamics
III) growth factors
A) only I
B) only II
C) only III
D) only II and III
E) I, II, and III
I) population cycles
II) population dynamics
III) growth factors
A) only I
B) only II
C) only III
D) only II and III
E) I, II, and III
Unlock Deck
Unlock for access to all 57 flashcards in this deck.
Unlock Deck
k this deck
56
When the birth rate is equal to each woman producing exactly enough offspring to replace herself and her offspring's father, and the birth rate is sustained for a generation, then ________.
A) r = 0 and there is zero population growth
B) 0 < r < 1
C) r = 1
D) r > 1
E) population size is at carrying capacity
A) r = 0 and there is zero population growth
B) 0 < r < 1
C) r = 1
D) r > 1
E) population size is at carrying capacity
Unlock Deck
Unlock for access to all 57 flashcards in this deck.
Unlock Deck
k this deck
57
What conclusion can you draw from the accompanying figure?A) Hares control lynx population size.
B) Lynx control hare population size.
C) Lynx and hare populations are independent of each other.
D) The relationship between the populations cannot be determined only from this graph.
Unlock Deck
Unlock for access to all 57 flashcards in this deck.
Unlock Deck
k this deck
Unlock Deck
Unlock for access to all 57 flashcards in this deck.


