Exam 51: Population Ecology
Exam 1: Biology and the Tree of Life37 Questions
Exam 2: Water and Carbon: the Chemical Basis of Life59 Questions
Exam 3: Protein Structure and Function59 Questions
Exam 4: Nucleic Acids and the Rna World43 Questions
Exam 5: An Introduction to Carbohydrates44 Questions
Exam 53: Ecosystems and Global Ecology57 Questions
Exam 6: Lipids, Membranes, and the First Cells59 Questions
Exam 7: Inside the Cell60 Questions
Exam 8: Energy and Enzymes: an Introduction to Metabolism60 Questions
Exam 9: Cellular Respiration and Fermentation61 Questions
Exam 10: Photosynthesis58 Questions
Exam 11: Cellcell Interactions52 Questions
Exam 12: The Cell Cycle59 Questions
Exam 13: Meiosis63 Questions
Exam 14: Mendel and the Gene60 Questions
Exam 15: Dna and the Gene: Synthesis and Repair51 Questions
Exam 16: How Genes Work48 Questions
Exam 17: Transcription, Rna Processing, and Translation58 Questions
Exam 18: Control of Gene Expression in Bacteria29 Questions
Exam 19: Control of Gene Expression in Eukaryotes56 Questions
Exam 20: The Molecular Revolution: Biotechnology and Beyond70 Questions
Exam 21: Genes, Development, and Evolution38 Questions
Exam 22: Evolution by Natural Selection38 Questions
Exam 23: Evolutionary Processes37 Questions
Exam 24: Speciation56 Questions
Exam 25: Phylogenies and the History of Life63 Questions
Exam 26: Bacteria and Archaea38 Questions
Exam 27: Protists37 Questions
Exam 28: Green Algae and Land Plants59 Questions
Exam 29: Fungi47 Questions
Exam 30: An Introduction to Animals48 Questions
Exam 31: Protostome Animals54 Questions
Exam 32: Deuterostome Animals60 Questions
Exam 33: Viruses44 Questions
Exam 34: Plant Form and Function46 Questions
Exam 35: Water and Sugar Transport in Plants47 Questions
Exam 36: Plant Nutrition54 Questions
Exam 37: Plant Sensory Systems, Signals, and Responses48 Questions
Exam 38: Plant Reproduction and Development51 Questions
Exam 39: Animal Form and Function53 Questions
Exam 40: Water and Electrolyte Balance in Animals60 Questions
Exam 41: Animal Nutrition94 Questions
Exam 42: Gas Exchange and Circulation93 Questions
Exam 43: Animal Nervous Systems100 Questions
Exam 44: Animal Sensory Systems50 Questions
Exam 45: Animal Movement40 Questions
Exam 46: Chemical Signals in Animals59 Questions
Exam 47: Animal Reproduction and Development104 Questions
Exam 48: The Immune System in Animals77 Questions
Exam 49: An Introduction to Ecology40 Questions
Exam 50: Behavioral Ecology40 Questions
Exam 51: Population Ecology57 Questions
Exam 52: Community Ecology55 Questions
Exam 54: Biodiversity and Conservation Biology43 Questions
Select questions type
Which of the following is the most important assumption for the mark-recapture method to estimate the size of wildlife populations?
Free
(Multiple Choice)
4.8/5  (36)
(36)
Correct Answer: Verified
E
The regular fluctuations in size of animal populations are termed ________.
I. population cycles
II. population dynamics
III. growth factors
Free
(Multiple Choice)
4.9/5 (29)
Correct Answer:Verified
A
To measure the population of lake trout in a 250-hectare lake, 400 individual trout were netted and marked with a fin clip, then returned to the lake. The next week, the lake was netted again, and out of the 200 lake trout that were caught, 50 had fin clips. Using the mark-recapture estimate, the lake trout population size could be closest to which of the following?
Free
(Multiple Choice)
4.8/5 (36)
Correct Answer:Verified
D
 -As N approaches K for a certain population, which of the following is predicted by the logistic equation?
(Multiple Choice)
4.7/5 (39)
It is estimated that a flock of wood buffalo crane should be able to sustain an r of 0.085 for the foreseeable future. If the flock currently contains 350 individuals, how long will it take for that population to double?
(Multiple Choice)
4.9/5 (42)
Use the following abstract from Theoretical Population Biology to answer the question.
Abstract:
We derive measures for assessing the value of an individual habitat fragment for the dynamics and persistence of a metapopulation living in a network of many fragments. We demonstrate that the most appropriate measure of fragment value depends on the question asked. Specifically, we analyze four alternative measures: the contribution of a fragment to the metapopulation capacity of the network, to the equilibrium metapopulation size, to the expected time to metapopulation extinction and the long-term contribution of a fragment to colonization events in the network. The latter measure is comparable to density-dependent measures in general matrix population theory, though some differences are introduced by the fact that "density dependence" is spatially localized in the metapopulation context. We show that the value of a fragment depends not only on the properties of the landscape but also on the properties of the species. Most importantly, variation in fragment values between the habitat fragments is greatest in the case of rare species that occur close to the extinction threshold, as these species are likely to be restricted to the most favorable parts of the landscape. We expect that the measures of habitat fragment described and analyzed here have applications in landscape ecology and in conservation biology.
Copyright © 2003 Elsevier Inc. All rights reserved. (Otso Ovaskainen and Ilkka Hanski. 2003. How much does an individual habitat fragment contribute to metapopulation dynamics and persistence? Theoretical Population Biology 64:481-95.)
One measure for the value of the patch was given by the long-term contribution of a fragment to colonization events in the network. How do the properties of a landscape and the properties of a species affect the value of a patch? The value of the fragment depends ________.
(Multiple Choice)
4.9/5 (24)
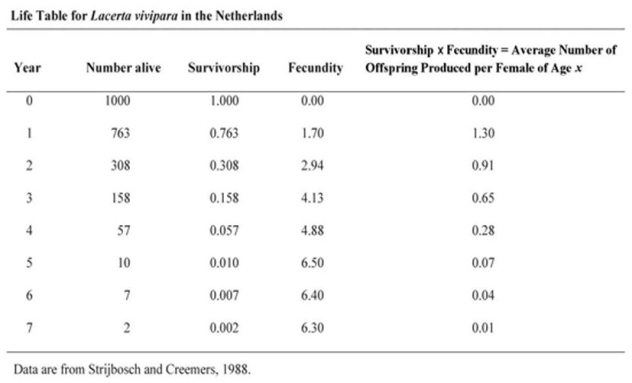 -Using the life table, determine which age class year would hurt the population growth most if it were wiped out by disease.
(Multiple Choice)
4.9/5 (37)
Which of the following examples would most accurately measure the density of the population being studied?
(Multiple Choice)
4.8/5 (35)
-Which statements about K are correct?
I. K varies among populations.
II. K varies in space.
III. K varies in time.
IV. K is constant for any given species.
(Multiple Choice)
4.9/5 (31)
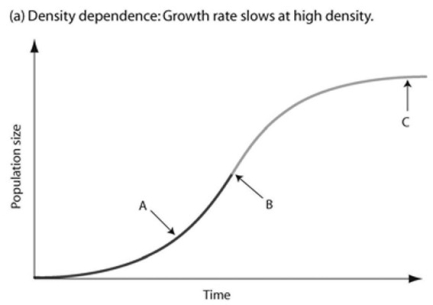
-In the accompanying figure, which of the arrows represents the carrying capacity?
(Multiple Choice)
4.8/5 (32)
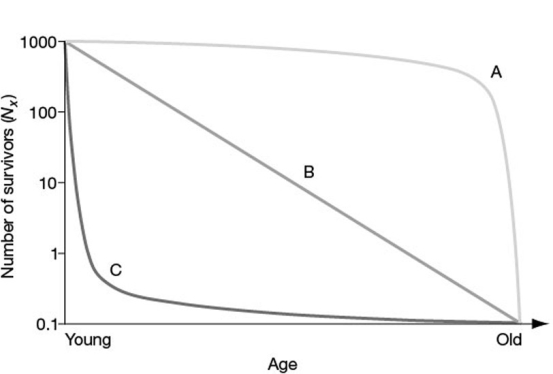 -In the figure, which of the following survivorship curves most applies to humans living in developed countries?
(Multiple Choice)
4.9/5 (36)
-In the accompanying figure, which of the arrows represents the most rapid population growth?
(Multiple Choice)
4.9/5 (33)
Why can't a female lizard have both high fecundity and high survival?
(Multiple Choice)
4.9/5 (36)
Random spacing patterns in plants such as the creosote bush are most often associated with ________.
(Multiple Choice)
4.7/5 (37)
The study of factors that determine the size and structure of populations through time is called ________.
(Multiple Choice)
4.8/5 (26)
Which statement is TRUE with regard to human population growth?
(Multiple Choice)
4.9/5 (32)
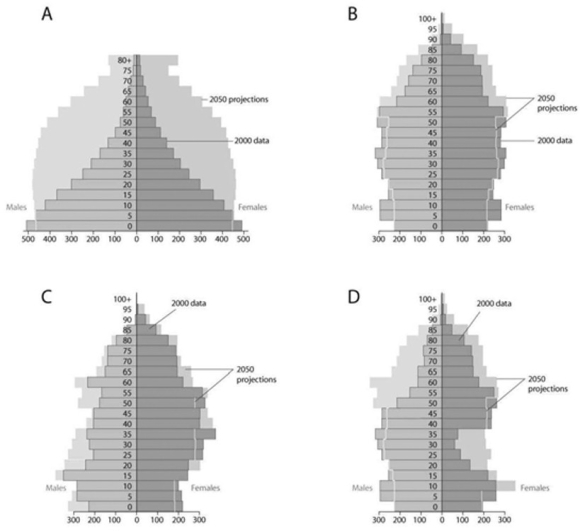 Based on the diagrams in the figure shown and on the large population of baby boomers in the United States, which graph best reflects U.S. population in 20 years?
(Multiple Choice)
4.8/5 (46)
-Using the accompanying life table, calculate the net reproductive rate (R0) for this population.
(Multiple Choice)
4.8/5 (40)
-A population of ground squirrels has an annual per capita birth rate of 0.06 and an annual per capita death rate of 0.02. Calculate an estimate of the total number of individuals added to (or lost from) a population of 1000 individuals in one year.
(Multiple Choice)
4.8/5 (30)
Filters
- Essay(0)
- Multiple Choice(0)
- Short Answer(0)
- True False(0)
- Matching(0)