Deck 11: The Is Curve
Full screen (f)
Question
Question
Question
Question
Question
Question
Question
Question
Question
Question
Question
Question
Question
Question
Question
Question
Question
Question
Question
Question
Question
Question
Refer to the following figure when answering
Figure 11.4: IS Curve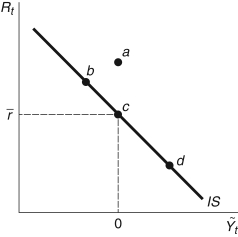
-In Figure 11.4, the economy is in its long-run equilibrium at point:
A) b
B) a
C) c
D) d
E) Not enough information is given.
Figure 11.4: IS Curve
-In Figure 11.4, the economy is in its long-run equilibrium at point:
A) b
B) a
C) c
D) d
E) Not enough information is given.
Question
Refer to the following figure when answering
Figure 11.2: Growth Rates of Investment and GDP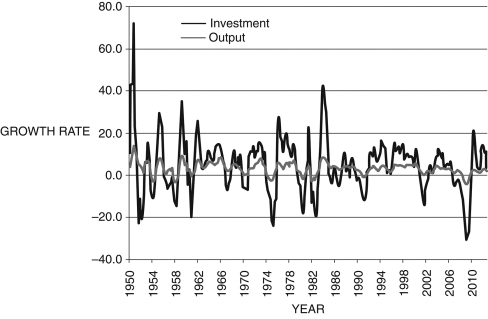 (Source: U.S. Bureau of Economic Analysis)
-Consider Figure 11.2. How does the investment function describe why investment is more volatile than the real GDP?
A) unpredictable firms
B) differences in expectations across firms
C) differences in expenditure shares
D) the inclusion of interest rates in the investment function
E) changes in business taxes
Figure 11.2: Growth Rates of Investment and GDP
(Source: U.S. Bureau of Economic Analysis)-Consider Figure 11.2. How does the investment function describe why investment is more volatile than the real GDP?
A) unpredictable firms
B) differences in expectations across firms
C) differences in expenditure shares
D) the inclusion of interest rates in the investment function
E) changes in business taxes
Question
Refer to the following figure when answering
Figure 11.2: Growth Rates of Investment and GDP (Source: U.S. Bureau of Economic Analysis)
-Consider Figure 11.2. How does the investment function describe why investment is more volatile than the real GDP?
A) Firms are unpredictable.
B) Investment does not include household residential expenditures.
C) Inventories do not adjust to changes in business cycles.
D) Firms do not have very good information.
E) The marginal product of capital is included in the investment function.
Figure 11.2: Growth Rates of Investment and GDP
(Source: U.S. Bureau of Economic Analysis)-Consider Figure 11.2. How does the investment function describe why investment is more volatile than the real GDP?
A) Firms are unpredictable.
B) Investment does not include household residential expenditures.
C) Inventories do not adjust to changes in business cycles.
D) Firms do not have very good information.
E) The marginal product of capital is included in the investment function.
Question
Question
Question
Question
Refer to the following figure when answering
Figure 11.3: IS Curve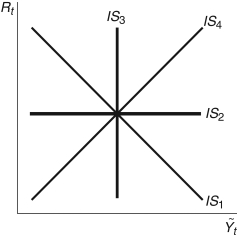
-Consider Figure 11.3. If investment is interest rate sensitive, but not infinitely interest rate sensitive, the economy would be best characterized by:
A) IS4
B) IS2
C) IS3
D) IS1
E) Not enough information is given.
Figure 11.3: IS Curve
-Consider Figure 11.3. If investment is interest rate sensitive, but not infinitely interest rate sensitive, the economy would be best characterized by:
A) IS4
B) IS2
C) IS3
D) IS1
E) Not enough information is given.
Question
Question
Refer to the following figure when answering
Figure 11.4: IS Curve
-In Figure 11.4, the economy deviates from its long-run equilibrium at point(s):
A) a
B) b
C) d
D) c
E) a, b, and d
Figure 11.4: IS Curve
-In Figure 11.4, the economy deviates from its long-run equilibrium at point(s):
A) a
B) b
C) d
D) c
E) a, b, and d
Question
Question
Question
Question
Question
Refer to the following figure when answering
Figure 11.1: Growth rates of real investment and consumption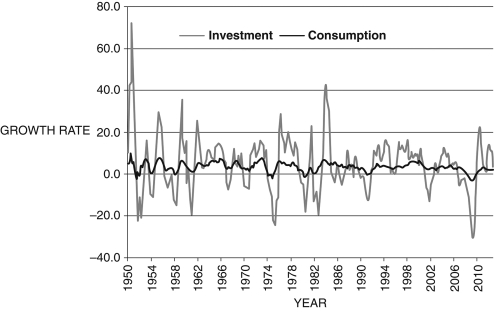 (Source: U.S. Bureau of Economic Analysis)
-Consider Figure 11.1. What explains the difference in the volatility of each series?
A) Firms are predictable.
B) differences in expectations across firms
C) differences in expenditure shares
D) Firms do not make investment decisions based on interest rates.
E) Households consumption-smooth.
Figure 11.1: Growth rates of real investment and consumption
(Source: U.S. Bureau of Economic Analysis)-Consider Figure 11.1. What explains the difference in the volatility of each series?
A) Firms are predictable.
B) differences in expectations across firms
C) differences in expenditure shares
D) Firms do not make investment decisions based on interest rates.
E) Households consumption-smooth.
Question
Refer to the following figure when answering
Figure 11.1: Growth rates of real investment and consumption (Source: U.S. Bureau of Economic Analysis)
-Consider Figure 11.1. What explains the difference in the volatility of each series?
A) Firms adjust investment to fluctuations in the stock market.
B) Households base their consumption on permanent income.
C) differences in expenditure shares
D) Firms do not make investment decisions based on interest rates.
E) Households are very sensitive to interest rate changes.
Figure 11.1: Growth rates of real investment and consumption
(Source: U.S. Bureau of Economic Analysis)-Consider Figure 11.1. What explains the difference in the volatility of each series?
A) Firms adjust investment to fluctuations in the stock market.
B) Households base their consumption on permanent income.
C) differences in expenditure shares
D) Firms do not make investment decisions based on interest rates.
E) Households are very sensitive to interest rate changes.
Question
Question
Question
Refer to the following figure when answering
Figure 11.3: IS Curve
-Consider Figure 11.3. If investment is infinitely interest rate sensitive, the economy would be characterized by:
A) IS1
B) IS3
C) IS2
D) IS4
E) Not enough information is given.
Figure 11.3: IS Curve
-Consider Figure 11.3. If investment is infinitely interest rate sensitive, the economy would be characterized by:
A) IS1
B) IS3
C) IS2
D) IS4
E) Not enough information is given.
Question
Refer to the following figure when answering
Figure 11.3: IS Curve
-Consider Figure 11.3. If investment is interest rate insensitive, the economy would be characterized by:
A) IS2
B) IS3
C) IS1
D) IS4
E) Not enough information is given.
Figure 11.3: IS Curve
-Consider Figure 11.3. If investment is interest rate insensitive, the economy would be characterized by:
A) IS2
B) IS3
C) IS1
D) IS4
E) Not enough information is given.
Question
Question
Question
Refer to the following figure when answering
Figure 11.6: IS Curve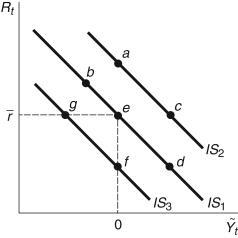
-Consider the IS curve in Figure 11.6. If the interest rate decreases and there is a negative aggregate demand shock, the economy will move to:
A) point b
B) point c
C) point d
D) point f
E) Not enough information is given.
Figure 11.6: IS Curve
-Consider the IS curve in Figure 11.6. If the interest rate decreases and there is a negative aggregate demand shock, the economy will move to:
A) point b
B) point c
C) point d
D) point f
E) Not enough information is given.
Question
Question
Question
Question
Refer to the following figure when answering
Figure 11.5: IS Curve
-Consider Figure 11.5. If the economy initially is at its long-run equilibrium and the real interest rate decreases, the economy:
A) moves from point b to point a
B) moves from point d to point a
C) moves from point d to point c
D) moves from point c to point d
E) moves from point d to point b
Question
Refer to the following figure when answering
Figure 11.6: IS Curve
-Consider the IS curve in Figure 11.6. Holding the real interest rate constant, beginning at point e, if there is an aggregate demand shock:
A) the IS curve shifts right to point c
B) the IS curve shifts right to point a
C) the IS curve shifts left to point g
D) there is a movement along the IS curve to point d
E) Not enough information is given.
Question
Question
Refer to the following figure when answering
Figure 11.6: IS Curve
-Consider the IS curve in Figure 11.6. If the interest rate increases and there is a positive aggregate demand shock, the economy would move from point e to:
A) point d
B) point c
C) point a
D) point b
E) point f
Figure 11.6: IS Curve
-Consider the IS curve in Figure 11.6. If the interest rate increases and there is a positive aggregate demand shock, the economy would move from point e to:
A) point d
B) point c
C) point a
D) point b
E) point f
Question
Question
Question
Question
Question
Question
Refer to the following figure when answering
Figure 11.5: IS Curve
-Consider Figure 11.5. If the economy initially is at its long-run equilibrium and the real interest rate increases, the economy:
A) moves from point b to point a
B) moves from point d to point a
C) moves from point d to point b
D) moves from point a to point d
E) moves from point d to point c
Question
Question
Question
Refer to the following figure when answering
Figure 11.6: IS Curve
-Consider the IS curve in Figure 11.6. If there is a positive aggregate demand shock and interest rates remain constant, the economy will move from point e to:
A) point a
B) point c
C) point d
D) point b
E) point f
Figure 11.6: IS Curve
-Consider the IS curve in Figure 11.6. If there is a positive aggregate demand shock and interest rates remain constant, the economy will move from point e to:
A) point a
B) point c
C) point d
D) point b
E) point f
Question
Question
Refer to the following figure when answering the next three questions.
Figure 11.7: Life Cycle Hypothesis
Consider Figure 11.7 of the life-cycle hypothesis. Area(s) ________ are periods of ________, and area(s) ________ are periods of ________.
A) A; borrowing; C; dissaving
B) A; borrowing; C; saving
C) B; dissaving; A and C; saving
D) A and C; dissaving; B; saving
E) A; saving; B; borrowing
Question
Question
Question
Question
Refer to the following figure when answering the next three questions.
Figure 11.7: Life Cycle Hypothesis
Consider Figure 11.7 of the life-cycle hypothesis. Area(s) ________ are periods of ________, and area(s) ________ are periods of ________.
A) A; borrowing; B; dissaving
B) A; saving; B; borrowing
C) B; dissaving; A and C; borrowing
D) A and C; dissaving; B; borrowing
E) None of these answers are correct.
Question
Question
Question
Question
Question
Question
Question
Question
Question
Question
Refer to the following figure when answering the next three questions.
Figure 11.7: Life Cycle Hypothesis
Consider Figure 11.7 of the life-cycle hypothesis. Area(s) ________ are periods of ________, and area(s) ________ are periods of ________.
A) A; dissaving; C; saving
B) C; dissaving; B; saving
C) B; dissaving; A and C; saving
D) A and C; dissaving; B; saving
E) Not enough information is given.
Question
Question
Question
Question
Question

Unlock Deck
Sign up to unlock the cards in this deck!
Unlock Deck
Unlock Deck
1/122
Play
Full screen (f)
Deck 11: The Is Curve
1
In the simple IS curve analysis, which of the following includes both the real interest rate and the potential output?
A) exports
B) consumption
C) government expenditures
D) investment
E) imports
A) exports
B) consumption
C) government expenditures
D) investment
E) imports
D
2
In the long run:
A) the federal funds rate equals the 10-year bond rate
B) the marginal product of capital is greater than the real interest rate
C) the marginal product of capital equals the nominal interest rate
D) the marginal product of capital equals the real interest rate
E) the marginal product of capital is less than the real interest rate
D
3
Refer to the following table when answering
Table 11.1: Real Growth Rates: 1950-2012
-You are given the data in Table 11.1, which covers the period 1950-2012. "Mean" is the average growth over the period and "St Dev" is the standard deviation of the growth (a measure of volatility) of real output, consumption, investment, and government expenditures. From this information, you conclude that:
A) households smooth their consumption more than other sectors
B) firms do not base their decisions on more than the potential GDP
C) foreigners are fickle consumers
D) government expenditures are zero
E) government expenditures are constant
households smooth their consumption more than other sectors
4
Every six to eight weeks, or so, the Federal Reserve meets to set the:
A) discount rate
B) mortgage rate
C) federal funds rate
D) 10-year bond rate
E) tax rate
A) discount rate
B) mortgage rate
C) federal funds rate
D) 10-year bond rate
E) tax rate
Unlock Deck
Unlock for access to all 122 flashcards in this deck.
Unlock Deck
k this deck
5
In the IS curve, consumption, government expenditure, exports, and imports are a function of:
A) expectations
B) current output
C) potential output
D) the interest rate
E) output fluctuations
A) expectations
B) current output
C) potential output
D) the interest rate
E) output fluctuations
Unlock Deck
Unlock for access to all 122 flashcards in this deck.
Unlock Deck
k this deck
6
Which of the following describes the investment function in the IS curve?
A)
B)
C)
D)
E)
A)
B)
C)
D)
E)
Unlock Deck
Unlock for access to all 122 flashcards in this deck.
Unlock Deck
k this deck
7
In the equation , if
Is close to zero, investment:
A) is not very sensitive to real interest rate changes
B) is very sensitive to changes in the marginal product of capital
C) is very sensitive to real interest rate changes
D) is sensitive to tax rate changes
E) does not depend upon the real interest rate
Is close to zero, investment:
A) is not very sensitive to real interest rate changes
B) is very sensitive to changes in the marginal product of capital
C) is very sensitive to real interest rate changes
D) is sensitive to tax rate changes
E) does not depend upon the real interest rate
Unlock Deck
Unlock for access to all 122 flashcards in this deck.
Unlock Deck
k this deck
8
In the short run, if the Federal Reserve reduces interest rates, firms:
A) do not change their capital stock
B) buy less capital and the marginal product of capital falls
C) allow their capital to fully depreciate
D) accumulate more inventory
E) buy more capital and the marginal product of capital falls
A) do not change their capital stock
B) buy less capital and the marginal product of capital falls
C) allow their capital to fully depreciate
D) accumulate more inventory
E) buy more capital and the marginal product of capital falls
Unlock Deck
Unlock for access to all 122 flashcards in this deck.
Unlock Deck
k this deck
9
In the long run, if the marginal product of capital equals the real interest rate, investment is given by:
A)
B)
C)
D)
E)
A)
B)
C)
D)
E)
Unlock Deck
Unlock for access to all 122 flashcards in this deck.
Unlock Deck
k this deck
10
If the real interest rate is less than the marginal product of capital, firms are better off:
A) producing at a loss
B) saving their earnings in an economywide financial market
C) accumulating more inventory
D) borrowing in financial markets and buying more capital
E) using more imported intermediate goods
A) producing at a loss
B) saving their earnings in an economywide financial market
C) accumulating more inventory
D) borrowing in financial markets and buying more capital
E) using more imported intermediate goods
Unlock Deck
Unlock for access to all 122 flashcards in this deck.
Unlock Deck
k this deck
11
In the equation , if
Equals zero, investment:
A) is sensitive to tax rate changes
B) is extremely sensitive to changes in the marginal product of capital
C) is not very sensitive to real interest rate changes
D) is insensitive to real interest rate changes
E) equals zero
Equals zero, investment:
A) is sensitive to tax rate changes
B) is extremely sensitive to changes in the marginal product of capital
C) is not very sensitive to real interest rate changes
D) is insensitive to real interest rate changes
E) equals zero
Unlock Deck
Unlock for access to all 122 flashcards in this deck.
Unlock Deck
k this deck
12
The IS curve describes the ________ relationship between ________ and ________.
A) negative; tax rate; investment
B) positive; interest rate; output
C) positive; tax rate; government expenditure
D) negative; interest rate; output
E) negative; interest rate; money supply
A) negative; tax rate; investment
B) positive; interest rate; output
C) positive; tax rate; government expenditure
D) negative; interest rate; output
E) negative; interest rate; money supply
Unlock Deck
Unlock for access to all 122 flashcards in this deck.
Unlock Deck
k this deck
13
In the IS curve, consumption is represented as a constant fraction of ________, and, therefore, is ________ than current output.
A) potential output; more volatile
B) potential output; smoother
C) short-run fluctuations; smoother
D) short-run fluctuations; more volatile
E) the interest rate differential; smoother
A) potential output; more volatile
B) potential output; smoother
C) short-run fluctuations; smoother
D) short-run fluctuations; more volatile
E) the interest rate differential; smoother
Unlock Deck
Unlock for access to all 122 flashcards in this deck.
Unlock Deck
k this deck
14
Which of the following describes the consumption function in the IS curve?
A)
B)
C)
D)
E)
A)
B)
C)
D)
E)
Unlock Deck
Unlock for access to all 122 flashcards in this deck.
Unlock Deck
k this deck
15
The foundation of the IS curve is the equation ________, which is the ________.
A) ; national income identity
B) ; national income identity
C) ; national income identity
D) ; current account
E) ; current account
A) ; national income identity
B) ; national income identity
C) ; national income identity
D) ; current account
E) ; current account
Unlock Deck
Unlock for access to all 122 flashcards in this deck.
Unlock Deck
k this deck
16
In the equation , if
Is close to infinity:
A) investment is extremely sensitive to real interest rate changes
B) investment is somewhat sensitive to changes in the marginal product of capital
C) investment is not very sensitive to real interest rate changes
D) investment is sensitive to tax rate changes
E) the output gap is zero
Unlock Deck
Unlock for access to all 122 flashcards in this deck.
Unlock Deck
k this deck
17
In the short run, because financial markets do not respond immediately to interest rate changes:
A) prices are very volatile
B) the marginal product of capital always is greater than the real interest rate
C) the marginal product of capital never deviates to the real interest rate
D) the marginal product of capital deviates from the real interest rate
E) investment is less volatile than output
A) prices are very volatile
B) the marginal product of capital always is greater than the real interest rate
C) the marginal product of capital never deviates to the real interest rate
D) the marginal product of capital deviates from the real interest rate
E) investment is less volatile than output
Unlock Deck
Unlock for access to all 122 flashcards in this deck.
Unlock Deck
k this deck
18
According to the IS curve, when interest rates rise, ________ and ________.
A) governments borrow less; firms produce less
B) firms and households borrow more; firms produce less
C) firms and households borrow less; firms produce less
D) firms and households borrow more; firms produce more
E) firms and households borrow more; governments produce more
A) governments borrow less; firms produce less
B) firms and households borrow more; firms produce less
C) firms and households borrow less; firms produce less
D) firms and households borrow more; firms produce more
E) firms and households borrow more; governments produce more
Unlock Deck
Unlock for access to all 122 flashcards in this deck.
Unlock Deck
k this deck
19
The IS curve describes short-run movements in an economy via which of the following?
A)
B)
C)
D)
E)
A)
B)
C)
D)
E)
Unlock Deck
Unlock for access to all 122 flashcards in this deck.
Unlock Deck
k this deck
20
The I in the IS curve stands for ________ and S denotes ________.
A) investment; sales
B) interest rate; savings
C) investment; savings
D) inventory; sales
E) interest rate; sales
A) investment; sales
B) interest rate; savings
C) investment; savings
D) inventory; sales
E) interest rate; sales
Unlock Deck
Unlock for access to all 122 flashcards in this deck.
Unlock Deck
k this deck
21
Refer to the following table when answering
Table 11.1: Real Growth Rates: 1950-2012
-You are given the data in Table 11.1, which covers the period 1950-2012. "Mean" is the average growth over the period and "St Dev" is the standard deviation of the growth (a measure of volatility) of real output, consumption, investment, and government expenditures. From this information, you conclude that:
A) households base their consumption on permanent income
B) households do not consumption-smooth
C) firms rely solely on "animal spirits" when considering new investment
D) government expenditures are always greater than household expenditures
E) households base their consumption patterns on interest rates only
Unlock Deck
Unlock for access to all 122 flashcards in this deck.
Unlock Deck
k this deck
22
Refer to the following figure when answering
Figure 11.4: IS Curve
-In Figure 11.4, the economy is in its long-run equilibrium at point:
A) b
B) a
C) c
D) d
E) Not enough information is given.
Figure 11.4: IS Curve
-In Figure 11.4, the economy is in its long-run equilibrium at point:
A) b
B) a
C) c
D) d
E) Not enough information is given.
Unlock Deck
Unlock for access to all 122 flashcards in this deck.
Unlock Deck
k this deck
23
Refer to the following figure when answering
Figure 11.2: Growth Rates of Investment and GDP (Source: U.S. Bureau of Economic Analysis)
-Consider Figure 11.2. How does the investment function describe why investment is more volatile than the real GDP?
A) unpredictable firms
B) differences in expectations across firms
C) differences in expenditure shares
D) the inclusion of interest rates in the investment function
E) changes in business taxes
Figure 11.2: Growth Rates of Investment and GDP
(Source: U.S. Bureau of Economic Analysis)-Consider Figure 11.2. How does the investment function describe why investment is more volatile than the real GDP?
A) unpredictable firms
B) differences in expectations across firms
C) differences in expenditure shares
D) the inclusion of interest rates in the investment function
E) changes in business taxes
Unlock Deck
Unlock for access to all 122 flashcards in this deck.
Unlock Deck
k this deck
24
Refer to the following figure when answering
Figure 11.2: Growth Rates of Investment and GDP (Source: U.S. Bureau of Economic Analysis)
-Consider Figure 11.2. How does the investment function describe why investment is more volatile than the real GDP?
A) Firms are unpredictable.
B) Investment does not include household residential expenditures.
C) Inventories do not adjust to changes in business cycles.
D) Firms do not have very good information.
E) The marginal product of capital is included in the investment function.
Figure 11.2: Growth Rates of Investment and GDP
(Source: U.S. Bureau of Economic Analysis)-Consider Figure 11.2. How does the investment function describe why investment is more volatile than the real GDP?
A) Firms are unpredictable.
B) Investment does not include household residential expenditures.
C) Inventories do not adjust to changes in business cycles.
D) Firms do not have very good information.
E) The marginal product of capital is included in the investment function.
Unlock Deck
Unlock for access to all 122 flashcards in this deck.
Unlock Deck
k this deck
25
Consider the following model of the IS curve without an international sector:
Consumption:
Investment:
Government expenditure:
With this formulation the IS curve is:
A) horizontal
B) less steeply sloped than the "standard" IS curve
C) vertical
D) more steeply sloped than the "standard" IS curve
E) Not enough information is given.
Consumption:
Investment:
Government expenditure:
With this formulation the IS curve is:
A) horizontal
B) less steeply sloped than the "standard" IS curve
C) vertical
D) more steeply sloped than the "standard" IS curve
E) Not enough information is given.
Unlock Deck
Unlock for access to all 122 flashcards in this deck.
Unlock Deck
k this deck
26
Using the IS curve , in the long run,
________ and ________, so that ________.
A) equals one; ; the economy is in recession
B) is greater than one; ; the economy is at its long-run equilibrium
C) equals zero; ; the economy is at its long-run equilibrium
D) equals one; ; the economy is expanding
E) equals one; ; the economy is in recession
Unlock Deck
Unlock for access to all 122 flashcards in this deck.
Unlock Deck
k this deck
27
In the IS curve , the term
Is called:
A) the tax rate
B) the elasticity of output with respect to the interest rate
C) a consumption expenditure shock
D) the deviation of the real interest rate to the marginal product of capital
E) an aggregate demand shock
Is called:
A) the tax rate
B) the elasticity of output with respect to the interest rate
C) a consumption expenditure shock
D) the deviation of the real interest rate to the marginal product of capital
E) an aggregate demand shock
Unlock Deck
Unlock for access to all 122 flashcards in this deck.
Unlock Deck
k this deck
28
Refer to the following figure when answering
Figure 11.3: IS Curve
-Consider Figure 11.3. If investment is interest rate sensitive, but not infinitely interest rate sensitive, the economy would be best characterized by:
A) IS4
B) IS2
C) IS3
D) IS1
E) Not enough information is given.
Figure 11.3: IS Curve
-Consider Figure 11.3. If investment is interest rate sensitive, but not infinitely interest rate sensitive, the economy would be best characterized by:
A) IS4
B) IS2
C) IS3
D) IS1
E) Not enough information is given.
Unlock Deck
Unlock for access to all 122 flashcards in this deck.
Unlock Deck
k this deck
29
In the equation , the left-hand side is called:
A) investment
B) private saving
C) total saving
D) government debt
E) public saving
A) investment
B) private saving
C) total saving
D) government debt
E) public saving
Unlock Deck
Unlock for access to all 122 flashcards in this deck.
Unlock Deck
k this deck
30
Refer to the following figure when answering
Figure 11.4: IS Curve
-In Figure 11.4, the economy deviates from its long-run equilibrium at point(s):
A) a
B) b
C) d
D) c
E) a, b, and d
Figure 11.4: IS Curve
-In Figure 11.4, the economy deviates from its long-run equilibrium at point(s):
A) a
B) b
C) d
D) c
E) a, b, and d
Unlock Deck
Unlock for access to all 122 flashcards in this deck.
Unlock Deck
k this deck
31
In the IS curve, represents:
A) potential output
B) total real output
C) short-run fluctuations in output
D) the real interest rate
E) None of these answers are correct.
A) potential output
B) total real output
C) short-run fluctuations in output
D) the real interest rate
E) None of these answers are correct.
Unlock Deck
Unlock for access to all 122 flashcards in this deck.
Unlock Deck
k this deck
32
Using the IS curve , in the long run,
________ and ________, so that
________.
A) equals one; ; equals zero
B) is greater than one; ; is greater than zero
C) equals zero; ; equals zero
D) equals one; ; equals zero
E) equals one; ; equals one
________ and ________, so that
________.
A) equals one; ; equals zero
B) is greater than one; ; is greater than zero
C) equals zero; ; equals zero
D) equals one; ; equals zero
E) equals one; ; equals one
Unlock Deck
Unlock for access to all 122 flashcards in this deck.
Unlock Deck
k this deck
33
In the IS curve, is given by ________, where
Is current output and Is potential output.
A)
B)
C)
D)
E)
Is current output and Is potential output.
A)
B)
C)
D)
E)
Unlock Deck
Unlock for access to all 122 flashcards in this deck.
Unlock Deck
k this deck
34
In the IS curve is equal to:
A) one
B)
C)
D)
E) zero
A) one
B)
C)
D)
E) zero
Unlock Deck
Unlock for access to all 122 flashcards in this deck.
Unlock Deck
k this deck
35
Refer to the following figure when answering
Figure 11.1: Growth rates of real investment and consumption (Source: U.S. Bureau of Economic Analysis)
-Consider Figure 11.1. What explains the difference in the volatility of each series?
A) Firms are predictable.
B) differences in expectations across firms
C) differences in expenditure shares
D) Firms do not make investment decisions based on interest rates.
E) Households consumption-smooth.
Figure 11.1: Growth rates of real investment and consumption
(Source: U.S. Bureau of Economic Analysis)-Consider Figure 11.1. What explains the difference in the volatility of each series?
A) Firms are predictable.
B) differences in expectations across firms
C) differences in expenditure shares
D) Firms do not make investment decisions based on interest rates.
E) Households consumption-smooth.
Unlock Deck
Unlock for access to all 122 flashcards in this deck.
Unlock Deck
k this deck
36
Refer to the following figure when answering
Figure 11.1: Growth rates of real investment and consumption (Source: U.S. Bureau of Economic Analysis)
-Consider Figure 11.1. What explains the difference in the volatility of each series?
A) Firms adjust investment to fluctuations in the stock market.
B) Households base their consumption on permanent income.
C) differences in expenditure shares
D) Firms do not make investment decisions based on interest rates.
E) Households are very sensitive to interest rate changes.
Figure 11.1: Growth rates of real investment and consumption
(Source: U.S. Bureau of Economic Analysis)-Consider Figure 11.1. What explains the difference in the volatility of each series?
A) Firms adjust investment to fluctuations in the stock market.
B) Households base their consumption on permanent income.
C) differences in expenditure shares
D) Firms do not make investment decisions based on interest rates.
E) Households are very sensitive to interest rate changes.
Unlock Deck
Unlock for access to all 122 flashcards in this deck.
Unlock Deck
k this deck
37
In the equation , the term Is ________ and Is ________.
A) aggregate saving; tax revenues
B) private saving; government saving
C) foreign saving; private saving
D) the government debt; investment
E) the trade balance; the financial account
A) aggregate saving; tax revenues
B) private saving; government saving
C) foreign saving; private saving
D) the government debt; investment
E) the trade balance; the financial account
Unlock Deck
Unlock for access to all 122 flashcards in this deck.
Unlock Deck
k this deck
38
Suppose , , , , and ) For any given Equals ________ and the economy ________.
A) 0; is in its long-run equilibrium
B) 0.90; has experienced a positive aggregate demand shock
C) 0.30; has experienced a positive aggregate demand shock
D) -0.10; has experienced a negative aggregate demand shock
E) 1.00; is in its long-run equilibrium
A) 0; is in its long-run equilibrium
B) 0.90; has experienced a positive aggregate demand shock
C) 0.30; has experienced a positive aggregate demand shock
D) -0.10; has experienced a negative aggregate demand shock
E) 1.00; is in its long-run equilibrium
Unlock Deck
Unlock for access to all 122 flashcards in this deck.
Unlock Deck
k this deck
39
Refer to the following figure when answering
Figure 11.3: IS Curve
-Consider Figure 11.3. If investment is infinitely interest rate sensitive, the economy would be characterized by:
A) IS1
B) IS3
C) IS2
D) IS4
E) Not enough information is given.
Figure 11.3: IS Curve
-Consider Figure 11.3. If investment is infinitely interest rate sensitive, the economy would be characterized by:
A) IS1
B) IS3
C) IS2
D) IS4
E) Not enough information is given.
Unlock Deck
Unlock for access to all 122 flashcards in this deck.
Unlock Deck
k this deck
40
Refer to the following figure when answering
Figure 11.3: IS Curve
-Consider Figure 11.3. If investment is interest rate insensitive, the economy would be characterized by:
A) IS2
B) IS3
C) IS1
D) IS4
E) Not enough information is given.
Figure 11.3: IS Curve
-Consider Figure 11.3. If investment is interest rate insensitive, the economy would be characterized by:
A) IS2
B) IS3
C) IS1
D) IS4
E) Not enough information is given.
Unlock Deck
Unlock for access to all 122 flashcards in this deck.
Unlock Deck
k this deck
41
Suppose we assume that initially if
Rises 2 percent and the real interest rate rises 2 percent, short-run output:
A) rises 2 percent
B) rises 1 percent
C) falls 2 percent
D) rises 4 percent
E) does not change
Rises 2 percent and the real interest rate rises 2 percent, short-run output:
A) rises 2 percent
B) rises 1 percent
C) falls 2 percent
D) rises 4 percent
E) does not change
Unlock Deck
Unlock for access to all 122 flashcards in this deck.
Unlock Deck
k this deck
42
You hear that the Federal Reserve is raising interest rates. From this new information, you conclude that:
A) short-run output will fall along the IS curve, possibly pushing the economy toward recession
B) short-run output will rise along the IS curve, possibly pushing the economy toward expansion
C) short-run output will fall as the IS curve shifts left, possibly pushing the economy toward recession
D) the federal government will lower taxes
E) there will be no change in short-run output
Unlock Deck
Unlock for access to all 122 flashcards in this deck.
Unlock Deck
k this deck
43
Refer to the following figure when answering
Figure 11.6: IS Curve
-Consider the IS curve in Figure 11.6. If the interest rate decreases and there is a negative aggregate demand shock, the economy will move to:
A) point b
B) point c
C) point d
D) point f
E) Not enough information is given.
Figure 11.6: IS Curve
-Consider the IS curve in Figure 11.6. If the interest rate decreases and there is a negative aggregate demand shock, the economy will move to:
A) point b
B) point c
C) point d
D) point f
E) Not enough information is given.
Unlock Deck
Unlock for access to all 122 flashcards in this deck.
Unlock Deck
k this deck
44
Suppose , , , , and ) For any given Equals ________ and the economy ________.
A) 0; is in its long-run equilibrium
B) 1.05; has experienced a positive aggregate demand shock
C) 0.45; has experienced a positive aggregate demand shock
D) -0.15; has experienced a negative aggregate demand shock
E) 0.05; has experienced a positive aggregate demand shock
A) 0; is in its long-run equilibrium
B) 1.05; has experienced a positive aggregate demand shock
C) 0.45; has experienced a positive aggregate demand shock
D) -0.15; has experienced a negative aggregate demand shock
E) 0.05; has experienced a positive aggregate demand shock
Unlock Deck
Unlock for access to all 122 flashcards in this deck.
Unlock Deck
k this deck
45
An increase in consumer expenditures during the holiday season, a decrease in purchases of U.S. goods by foreigners, a tax increase, and a decline in new home starts are examples of:
A) a monetary policy
B) an aggregate supply shock
C) an aggregate demand shock
D) expectations
E) Ricardian equivalence
A) a monetary policy
B) an aggregate supply shock
C) an aggregate demand shock
D) expectations
E) Ricardian equivalence
Unlock Deck
Unlock for access to all 122 flashcards in this deck.
Unlock Deck
k this deck
46
Consider two economies with the following IS curves, denoted 1 and 2:
IS1:
IS2:
Given these two curves, the economies are identical except that they respond to interest rate changes differently. Suppose we assume ) If the real interest rate in each economy falls to
Then:
A) Country 1 will move from its long-run equilibrium to 1 percent above its potential and Country 2 will move from its long-run equilibrium to 0.5 percent above its potential
B) Country 1 will move from its long-run equilibrium to 1 percent above its potential and Country 2 will move from its long-run equilibrium to -0.5 percent below its potential
C) Country 1 will move from its long-run equilibrium to -1 percent below its potential and Country 2 will move from its long-run equilibrium to 0.5 percent above its potential
D) Country 1 will move from 0.5 percent below its potential to its long-run equilibrium and Country 2 will move from its long-run equilibrium to 2 percent above its potential
E) neither country will move away from its long-run equilibrium
Unlock Deck
Unlock for access to all 122 flashcards in this deck.
Unlock Deck
k this deck
47
Refer to the following figure when answering
Figure 11.5: IS Curve
-Consider Figure 11.5. If the economy initially is at its long-run equilibrium and the real interest rate decreases, the economy:
A) moves from point b to point a
B) moves from point d to point a
C) moves from point d to point c
D) moves from point c to point d
E) moves from point d to point b
Unlock Deck
Unlock for access to all 122 flashcards in this deck.
Unlock Deck
k this deck
48
Refer to the following figure when answering
Figure 11.6: IS Curve
-Consider the IS curve in Figure 11.6. Holding the real interest rate constant, beginning at point e, if there is an aggregate demand shock:
A) the IS curve shifts right to point c
B) the IS curve shifts right to point a
C) the IS curve shifts left to point g
D) there is a movement along the IS curve to point d
E) Not enough information is given.
Unlock Deck
Unlock for access to all 122 flashcards in this deck.
Unlock Deck
k this deck
49
Suppose we assume , and the real interest rate rises to ) In this scenario of the IS curve the economy would, in the short run:
A) remain at its long-run equilibrium
B) move from 1 percent below its potential to its long-run equilibrium
C) move from its long-run equilibrium to 1 percent above its potential
D) move from its long-run equilibrium to 1 percent below its potential
E) have increased output
A) remain at its long-run equilibrium
B) move from 1 percent below its potential to its long-run equilibrium
C) move from its long-run equilibrium to 1 percent above its potential
D) move from its long-run equilibrium to 1 percent below its potential
E) have increased output
Unlock Deck
Unlock for access to all 122 flashcards in this deck.
Unlock Deck
k this deck
50
Refer to the following figure when answering
Figure 11.6: IS Curve
-Consider the IS curve in Figure 11.6. If the interest rate increases and there is a positive aggregate demand shock, the economy would move from point e to:
A) point d
B) point c
C) point a
D) point b
E) point f
Figure 11.6: IS Curve
-Consider the IS curve in Figure 11.6. If the interest rate increases and there is a positive aggregate demand shock, the economy would move from point e to:
A) point d
B) point c
C) point a
D) point b
E) point f
Unlock Deck
Unlock for access to all 122 flashcards in this deck.
Unlock Deck
k this deck
51
Suppose we assume that initially if
Rises 2 percent and the real interest rate falls 2 percent, short-run output:
A) falls 2 percent
B) rises 1 percent
C) rises 3 percent
D) falls 1 percent
E) does not change
Rises 2 percent and the real interest rate falls 2 percent, short-run output:
A) falls 2 percent
B) rises 1 percent
C) rises 3 percent
D) falls 1 percent
E) does not change
Unlock Deck
Unlock for access to all 122 flashcards in this deck.
Unlock Deck
k this deck
52
Which of the following is an example of an IS shock?
I) a change in interest rates
Ii) a change in tax policy
Iii) a natural disaster
Iv) a change in the price of oil
A) i
B) ii
C) iii
D) iv
E) i and ii
I) a change in interest rates
Ii) a change in tax policy
Iii) a natural disaster
Iv) a change in the price of oil
A) i
B) ii
C) iii
D) iv
E) i and ii
Unlock Deck
Unlock for access to all 122 flashcards in this deck.
Unlock Deck
k this deck
53
Suppose we assume , and the real interest rate falls to ) In this scenario of the IS curve the economy would, in the short run:
A) remain at its long-run equilibrium
B) have reduced output
C) move from 1 percent below its potential to its long-run equilibrium
D) move from its long-run equilibrium to 1 percent above its potential
E) move from its long-run equilibrium to 1 percent below its potential
A) remain at its long-run equilibrium
B) have reduced output
C) move from 1 percent below its potential to its long-run equilibrium
D) move from its long-run equilibrium to 1 percent above its potential
E) move from its long-run equilibrium to 1 percent below its potential
Unlock Deck
Unlock for access to all 122 flashcards in this deck.
Unlock Deck
k this deck
54
Suppose , , , , and ) For any given Equals ________ and the economy ________.
A) 0; is in its long-run equilibrium
B) 0.05; has experienced a positive aggregate demand shock
C) 1.05; has experienced a positive aggregate demand shock
D) 0.45; has experienced a positive aggregate demand shock
E) -0.15; has experienced a negative aggregate demand shock
A) 0; is in its long-run equilibrium
B) 0.05; has experienced a positive aggregate demand shock
C) 1.05; has experienced a positive aggregate demand shock
D) 0.45; has experienced a positive aggregate demand shock
E) -0.15; has experienced a negative aggregate demand shock
Unlock Deck
Unlock for access to all 122 flashcards in this deck.
Unlock Deck
k this deck
55
If there is an aggregate demand shock:
A) the IS curve shifts to the right
B) the IS curve shifts to the left
C) there is rightward movement along the IS curve
D) there is leftward movement along the IS curve
E) Not enough information is given.
A) the IS curve shifts to the right
B) the IS curve shifts to the left
C) there is rightward movement along the IS curve
D) there is leftward movement along the IS curve
E) Not enough information is given.
Unlock Deck
Unlock for access to all 122 flashcards in this deck.
Unlock Deck
k this deck
56
Refer to the following figure when answering
Figure 11.5: IS Curve
-Consider Figure 11.5. If the economy initially is at its long-run equilibrium and the real interest rate increases, the economy:
A) moves from point b to point a
B) moves from point d to point a
C) moves from point d to point b
D) moves from point a to point d
E) moves from point d to point c
Unlock Deck
Unlock for access to all 122 flashcards in this deck.
Unlock Deck
k this deck
57
Which of the following is NOT an example of an IS shock?
I) a change in interest rates
Ii) a change in tax policy
Iii) a natural disaster
Iv) a change in the price of oil
A) i
B) ii
C) iii
D) iv
E) i and iii
I) a change in interest rates
Ii) a change in tax policy
Iii) a natural disaster
Iv) a change in the price of oil
A) i
B) ii
C) iii
D) iv
E) i and iii
Unlock Deck
Unlock for access to all 122 flashcards in this deck.
Unlock Deck
k this deck
58
Over the past few years, the Chinese have bought billions of dollars of U.S. bonds, pushing down U.S. interest rates. From this, you conclude that:
A) short-run output will rise along the IS curve, possibly pushing the economy toward expansion
B) short-run output will fall along the IS curve, possibly pushing the economy toward recession
C) short-run output will fall as the IS curve shifts left, possibly pushing the economy toward recession
D) the federal government will lower taxes
E) there will be no change in short-run output
Unlock Deck
Unlock for access to all 122 flashcards in this deck.
Unlock Deck
k this deck
59
Refer to the following figure when answering
Figure 11.6: IS Curve
-Consider the IS curve in Figure 11.6. If there is a positive aggregate demand shock and interest rates remain constant, the economy will move from point e to:
A) point a
B) point c
C) point d
D) point b
E) point f
Figure 11.6: IS Curve
-Consider the IS curve in Figure 11.6. If there is a positive aggregate demand shock and interest rates remain constant, the economy will move from point e to:
A) point a
B) point c
C) point d
D) point b
E) point f
Unlock Deck
Unlock for access to all 122 flashcards in this deck.
Unlock Deck
k this deck
60
Suppose we assume that initially if
Rises 2 percent and the real interest rate falls 4 percent, short-run output:
A) rises 2 percent
B) rises 6 percent
C) falls 2 percent
D) rises 4 percent
E) does not change
Rises 2 percent and the real interest rate falls 4 percent, short-run output:
A) rises 2 percent
B) rises 6 percent
C) falls 2 percent
D) rises 4 percent
E) does not change
Unlock Deck
Unlock for access to all 122 flashcards in this deck.
Unlock Deck
k this deck
61
Refer to the following figure when answering the next three questions.
Figure 11.7: Life Cycle Hypothesis
Consider Figure 11.7 of the life-cycle hypothesis. Area(s) ________ are periods of ________, and area(s) ________ are periods of ________.
A) A; borrowing; C; dissaving
B) A; borrowing; C; saving
C) B; dissaving; A and C; saving
D) A and C; dissaving; B; saving
E) A; saving; B; borrowing
Unlock Deck
Unlock for access to all 122 flashcards in this deck.
Unlock Deck
k this deck
62
The life-cycle hypothesis suggests that people base their consumption on their:
A) current incomes
B) average lifetime incomes rather than their current incomes
C) temporary incomes
D) future incomes
E) past incomes
A) current incomes
B) average lifetime incomes rather than their current incomes
C) temporary incomes
D) future incomes
E) past incomes
Unlock Deck
Unlock for access to all 122 flashcards in this deck.
Unlock Deck
k this deck
63
In the late 1970s, the United States experienced a productivity slowdown that decreased the marginal product capital. This caused:
A) a shift in the aggregate supply curve
B) a leftward shift of the IS curve
C) a decline in inflation expectations
D) a rightward movement along the IS curve
E) rising nominal interest rates
A) a shift in the aggregate supply curve
B) a leftward shift of the IS curve
C) a decline in inflation expectations
D) a rightward movement along the IS curve
E) rising nominal interest rates
Unlock Deck
Unlock for access to all 122 flashcards in this deck.
Unlock Deck
k this deck
64
Consider the following model of the IS curve without an international sector:
Consumption: ; Investment: Government expenditure: With this formulation, the IS curve is:
A) horizontal
B) vertical
C) less steeply sloped than the "standard" IS curve
D) more steeply sloped than the "standard" IS curve
E) Not enough information is given.
Consumption: ; Investment: Government expenditure: With this formulation, the IS curve is:
A) horizontal
B) vertical
C) less steeply sloped than the "standard" IS curve
D) more steeply sloped than the "standard" IS curve
E) Not enough information is given.
Unlock Deck
Unlock for access to all 122 flashcards in this deck.
Unlock Deck
k this deck
65
Refer to the following figure when answering the next three questions.
Figure 11.7: Life Cycle Hypothesis
Consider Figure 11.7 of the life-cycle hypothesis. Area(s) ________ are periods of ________, and area(s) ________ are periods of ________.
A) A; borrowing; B; dissaving
B) A; saving; B; borrowing
C) B; dissaving; A and C; borrowing
D) A and C; dissaving; B; borrowing
E) None of these answers are correct.
Unlock Deck
Unlock for access to all 122 flashcards in this deck.
Unlock Deck
k this deck
66
The basic IS model embodies the life-cycle and permanent-income hypotheses by:
A) setting consumption proportional to potential output
B) keeping consumption growth zero
C) setting consumption proportional to the real interest rate
D) setting consumption equal to past income
E) incorporating the interest rate
A) setting consumption proportional to potential output
B) keeping consumption growth zero
C) setting consumption proportional to the real interest rate
D) setting consumption equal to past income
E) incorporating the interest rate
Unlock Deck
Unlock for access to all 122 flashcards in this deck.
Unlock Deck
k this deck
67
The fundamental lesson of the life-cycle and permanent-income hypotheses is that:
A) individuals smooth their consumption patterns over their lifetimes
B) individuals vary their consumption patterns over their lifetimes
C) individuals' consumption patterns vary as their incomes change
D) individuals' consumption changes with changes in their temporary incomes
E) taxes are ineffectual
Unlock Deck
Unlock for access to all 122 flashcards in this deck.
Unlock Deck
k this deck
68
In the late 1990s, the United States experienced a significant productivity shock that increased the marginal product capital. This caused:
A) a shift in the aggregate supply curve
B) a leftward movement along the IS curve
C) a rightward shift of the IS curve
D) a rightward movement along the IS curve
E) no change in the IS curve
A) a shift in the aggregate supply curve
B) a leftward movement along the IS curve
C) a rightward shift of the IS curve
D) a rightward movement along the IS curve
E) no change in the IS curve
Unlock Deck
Unlock for access to all 122 flashcards in this deck.
Unlock Deck
k this deck
69
If we write the consumption function as , if
, the IS curve is given by:
A)
B)
C)
D)
E)
, the IS curve is given by:
A)
B)
C)
D)
E)
Unlock Deck
Unlock for access to all 122 flashcards in this deck.
Unlock Deck
k this deck
70
When the multiplier is included in the IS curve:
A) a demand shock has a larger impact on short-run fluctuations than with the standard IS curve
B) it has no impact on potential output
C) a demand shock has a smaller impact on short-run fluctuations than with the standard IS curve
D) a change in taxes has no impact on short-run output
E) None of these answers are correct.
Unlock Deck
Unlock for access to all 122 flashcards in this deck.
Unlock Deck
k this deck
71
If all the economies of the European Union experience a recession, the United States experiences ________ and the IS curve ________.
A) no change; stays constant
B) a positive aggregate demand shock; shifts right
C) a negative aggregate demand shock; shifts left
D) no change; shifts right
E) Not enough information is given.
A) no change; stays constant
B) a positive aggregate demand shock; shifts right
C) a negative aggregate demand shock; shifts left
D) no change; shifts right
E) Not enough information is given.
Unlock Deck
Unlock for access to all 122 flashcards in this deck.
Unlock Deck
k this deck
72
Recently, Toyota took over the position of the world's largest automobile manufacturer from GM. This is an example of ________ in the United States.
A) a positive aggregate demand shock
B) a negative aggregate demand shock
C) a rightward movement along the IS curve
D) a positive aggregate supply shock
E) Not enough information is given.
A) a positive aggregate demand shock
B) a negative aggregate demand shock
C) a rightward movement along the IS curve
D) a positive aggregate supply shock
E) Not enough information is given.
Unlock Deck
Unlock for access to all 122 flashcards in this deck.
Unlock Deck
k this deck
73
According to the life-cycle and permanent-income hypotheses, if future income rises permanently, current consumption:
A) falls
B) rises
C) does not change
D) changes in proportion to interest rate changes
E) Not enough information is given.
A) falls
B) rises
C) does not change
D) changes in proportion to interest rate changes
E) Not enough information is given.
Unlock Deck
Unlock for access to all 122 flashcards in this deck.
Unlock Deck
k this deck
74
Consider the consumption function . If
, a 2 percent demand shock:
A) raises short-run output by 1 percent
B) raises short-run output by 0.5 percent
C) raises short-run output by 4 percent
D) reduces short-run output by 4 percent
E) has no impact on short-run output
, a 2 percent demand shock:
A) raises short-run output by 1 percent
B) raises short-run output by 0.5 percent
C) raises short-run output by 4 percent
D) reduces short-run output by 4 percent
E) has no impact on short-run output
Unlock Deck
Unlock for access to all 122 flashcards in this deck.
Unlock Deck
k this deck
75
Refer to the following figure when answering the next three questions.
Figure 11.7: Life Cycle Hypothesis
Consider Figure 11.7 of the life-cycle hypothesis. Area(s) ________ are periods of ________, and area(s) ________ are periods of ________.
A) A; dissaving; C; saving
B) C; dissaving; B; saving
C) B; dissaving; A and C; saving
D) A and C; dissaving; B; saving
E) Not enough information is given.
Unlock Deck
Unlock for access to all 122 flashcards in this deck.
Unlock Deck
k this deck
76
Consider the IS curve . If there is no demand shock and And , a 1 percent increase in the real interest rate causes short-run output to:
A) fall by 2 percent
B) rise by 4 percent
C) fall by 4 percent
D) fall by 0.5 percent
E) Not enough information is given.
A) fall by 2 percent
B) rise by 4 percent
C) fall by 4 percent
D) fall by 0.5 percent
E) Not enough information is given.
Unlock Deck
Unlock for access to all 122 flashcards in this deck.
Unlock Deck
k this deck
77
When the multiplier is included in the IS curve:
A) a demand shock has a larger impact on short-run fluctuations than with the standard IS curve
B) a change in the real interest rate has a smaller impact on short-run fluctuations than with the standard IS curve
C) a demand shock has a smaller impact on short-run fluctuations than with the standard IS curve
D) a change in taxes has no impact on short-run output
E) a change in the marginal product of capital has a smaller effect on short-run fluctuations in output than with the standard IS curve
Unlock Deck
Unlock for access to all 122 flashcards in this deck.
Unlock Deck
k this deck
78
According to the permanent-income and life cycle hypotheses, if we wish to smooth consumption over our lifetimes we can:
A) get higher paying jobs
B) borrow and lend to ourselves over our lifetimes
C) set consumption proportional to the real interest rate
D) never change our spending patterns
E) always save 15 percent of our incomes
A) get higher paying jobs
B) borrow and lend to ourselves over our lifetimes
C) set consumption proportional to the real interest rate
D) never change our spending patterns
E) always save 15 percent of our incomes
Unlock Deck
Unlock for access to all 122 flashcards in this deck.
Unlock Deck
k this deck
79
During the 2000s, Americans dramatically increased their personal debt. This is an example of:
A) a negative aggregate demand shock
B) a positive aggregate demand shock
C) a rightward movement along the IS curve
D) a positive aggregate supply shock
E) Not enough information is given.
A) a negative aggregate demand shock
B) a positive aggregate demand shock
C) a rightward movement along the IS curve
D) a positive aggregate supply shock
E) Not enough information is given.
Unlock Deck
Unlock for access to all 122 flashcards in this deck.
Unlock Deck
k this deck
80
The permanent-income hypothesis suggests that people will base their consumption on their:
A) permanent incomes only
B) temporary incomes more than their permanent incomes
C) permanent incomes more than their temporary incomes
D) temporary incomes only
E) future incomes
A) permanent incomes only
B) temporary incomes more than their permanent incomes
C) permanent incomes more than their temporary incomes
D) temporary incomes only
E) future incomes
Unlock Deck
Unlock for access to all 122 flashcards in this deck.
Unlock Deck
k this deck
Unlock Deck
Unlock for access to all 122 flashcards in this deck.


