Exam 11: The Is Curve
Exam 1: Introduction to Macroeconomics35 Questions
Exam 2: Measuring the Macroeconomy111 Questions
Exam 3: An Overview of Long-Run Economic Growth106 Questions
Exam 4: A Model of Production128 Questions
Exam 5: The Solow Growth Model125 Questions
Exam 6: Growth and Ideas114 Questions
Exam 7: The Labor Market, Wages, and Unemployment114 Questions
Exam 8: Inflation111 Questions
Exam 9: An Introduction to the Short Run105 Questions
Exam 10: The Great Recession: a First Look104 Questions
Exam 11: The Is Curve122 Questions
Exam 12: Monetary Policy and the Phillips Curve132 Questions
Exam 13: Stabilization Policy and the Asad Framework109 Questions
Exam 14: The Great Recession and the Short-Run Model104 Questions
Exam 15: Dsge Models: the Frontier of Business Cycle Research114 Questions
Exam 16: Consumption104 Questions
Exam 17: Investment111 Questions
Exam 18: The Government and the Macroeconomy115 Questions
Exam 19: International Trade103 Questions
Exam 20: Exchange Rates and International Finance129 Questions
Exam 21: Parting Thoughts35 Questions
Select questions type
Refer to the following figure when answering
Figure 11.2: Growth Rates of Investment and GDP 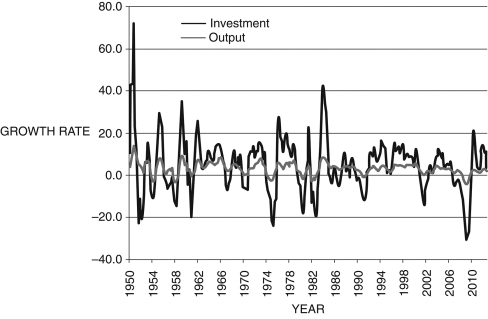 (Source: U.S. Bureau of Economic Analysis)
-Consider Figure 11.2. How does the investment function describe why investment is more volatile than the real GDP?
(Source: U.S. Bureau of Economic Analysis)
-Consider Figure 11.2. How does the investment function describe why investment is more volatile than the real GDP?
Free
(Multiple Choice)
4.9/5  (33)
(33)
Correct Answer: Verified
E
Derive Hicks's IS relationship beginning with the national income identity.
Free
(Essay)
4.9/5 (36)
Correct Answer:Verified
Begin with Y = C + I + G + EX - IM and do some algebra:
Y = C + I + G + EX - IM
Y - C - G + (IM - EX) = I ,
where PV T is private savings; GOV is government savings; FOR is foreign savings; and S = PV T + GOV + FOR is overall savings.
What is the relationship between the real interest rate and the output gap in the IS curve? Explain.
Free
(Essay)
4.9/5 (26)
Correct Answer:Verified
There is an inverse relationship between the interest rate and the output gap,
The investment function is proportional to potential output only.
(True/False)
4.8/5 (34)
The basic IS model embodies the life-cycle and permanent-income hypotheses by:
(Multiple Choice)
4.8/5 (31)
In the IS curve, consumption, government expenditure, exports, and imports are a function of:
(Multiple Choice)
4.8/5 (33)
The deepest the output gap was during the Great Recession was -7.46 percent in July of 2009. Many believe that the multiplier used was 1.5. If this is true, what is
? What is
if the multiplier used was 1.25? What would the percent change in government expenditure be to close this gap assuming monetary policy is NOT being used?
(Essay)
4.7/5 (41)
In the late 1970s, the United States experienced a productivity slowdown that decreased the marginal product capital. This caused:
(Multiple Choice)
4.8/5 (34)
The I in the IS curve stands for ________ and S denotes ________.
(Multiple Choice)
4.9/5 (34)
Refer to the following figure when answering the next three questions.
Figure 11.7: Life Cycle Hypothesis  -Consider Figure 11.7 of the life-cycle hypothesis. Area(s) ________ are periods of ________, and area(s) ________ are periods of ________.
(Multiple Choice)
4.8/5 (34)
Which of the following is an example of an IS shock?
i. a change in interest rates
ii. a change in tax policy
iii. a natural disaster
iv. a change in the price of oil
(Multiple Choice)
4.8/5 (26)
You hear that the Federal Reserve is raising interest rates. From this new information, you conclude that:
(Multiple Choice)
5.0/5 (32)
Refer to the following table when answering
Table 11.1: Real Growth Rates: 1950-2012
Mean St Dev Output 3.26 2.71 Household Consumption 3.37 2.15 Firm Investment 4.60 12.72 Government Expenditures 2.76 6.15
-You are given the data in Table 11.1, which covers the period 1950-2012. "Mean" is the average growth over the period and "St Dev" is the standard deviation of the growth (a measure of volatility) of real output, consumption, investment, and government expenditures. From this information, you conclude that:
(Multiple Choice)
4.7/5 (40)
According to the permanent-income and life cycle hypotheses, if we wish to smooth consumption over our lifetimes we can:
(Multiple Choice)
4.8/5 (43)
Defense spending in Afghanistan and Iraq is an example of a negative aggregate demand shock.
(True/False)
4.8/5 (39)
Which of the following describes the consumption function in the IS curve?
(Multiple Choice)
4.9/5 (41)
When there is a change to potential output, the IS curve shifts.
(True/False)
4.7/5 (35)
An increase in consumer expenditures during the holiday season, a decrease in purchases of U.S. goods by foreigners, a tax increase, and a decline in new home starts are examples of:
(Multiple Choice)
4.9/5 (34)
Filters
- Essay(0)
- Multiple Choice(0)
- Short Answer(0)
- True False(0)
- Matching(0)