Deck 18: Time Series and Forecasting
Full screen (f)
Question
Question
Question
Question
Question
Question
Question
Question
Question
When the decomposition model, 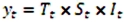 ,is applied,forecasts are made as
  ,where
  represents the estimated trend for seasonally adjusted time series for period t,and
  is the seasonal index for period t.
,is applied,forecasts are made as ,where represents the estimated trend for seasonally adjusted time series for period t,and is the seasonal index for period t. Question
When the exponential trend model is used to make forecasts,it is preferable to round the estimates b0,b1 and se in the equation 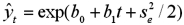 .
.
. Question
Question
Question
Question
Question
Question
Question
Question
Question
Question
Question
Question
Exhibit 18.2.The following table includes the information about a monthly time series.  Refer to Exhibit 18.2.When the exponential smoothing method with α = 0.1 is applied,what is the mean square error (MSE)?
A)20.796
B)31.2336
C)12.6736
D)10.41
Refer to Exhibit 18.2.When the exponential smoothing method with α = 0.1 is applied,what is the mean square error (MSE)?A)20.796
B)31.2336
C)12.6736
D)10.41
Question
Exhibit 18.2.The following table includes the information about a monthly time series.  Refer to Exhibit 18.2.What is the forecast for May using the exponential smoothing method with α = 0.1?
A)20.796
B)21.000
C)20.600
D)20.440
Refer to Exhibit 18.2.What is the forecast for May using the exponential smoothing method with α = 0.1?A)20.796
B)21.000
C)20.600
D)20.440
Question
Question
Question
Question
Exhibit 18.2.The following table includes the information about a monthly time series.  Refer to Exhibit 18.2.When a forecast is made by the three-month moving average method,all three monthly observations used to make this forecast are treated equally in the sense that each of them has the same weight of 1/3.What is the forecast for May when the three-month weighted moving average method is applied with the weights: 1/6,2/6,and 3/6? Assign the smallest weight to the oldest data and the largest weight to the most recent data.
A)19.00
B)24.00
C)18.67
D)21.17
Refer to Exhibit 18.2.When a forecast is made by the three-month moving average method,all three monthly observations used to make this forecast are treated equally in the sense that each of them has the same weight of 1/3.What is the forecast for May when the three-month weighted moving average method is applied with the weights: 1/6,2/6,and 3/6? Assign the smallest weight to the oldest data and the largest weight to the most recent data.A)19.00
B)24.00
C)18.67
D)21.17
Question
Exhibit 18.1.The past monthly demands are shown below.The naive method,that is,the one-period moving average method,is applied to make forecasts.  Refer to Exhibit 18.1.What is the mean absolute deviation (MAD)of the forecasts?
A)-1.67
B)25.00
C)91.67
D)8.33
Refer to Exhibit 18.1.What is the mean absolute deviation (MAD)of the forecasts?A)-1.67
B)25.00
C)91.67
D)8.33
Question
Question
Question
Question
In the exponential smoothing formula for updating the level of the series, 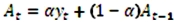 ,what does α represent?
A)The weighted average of the exponentially declining weights.
B)The speed of decline in the weights of older observations.
C)The initial value of the time series.
D)The last value of the time series.
,what does α represent?A)The weighted average of the exponentially declining weights.
B)The speed of decline in the weights of older observations.
C)The initial value of the time series.
D)The last value of the time series.
Question
Question
Exhibit 18.1.The past monthly demands are shown below.The naïve method,that is,the one-period moving average method,is applied to make forecasts. 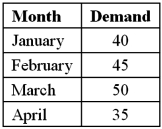 Refer to Exhibit 18.1.If May's demand appears to be 35,what is the residual (error)for May?
A)35
B)0
C)68.75
D)6.25
Refer to Exhibit 18.1.If May's demand appears to be 35,what is the residual (error)for May?A)35
B)0
C)68.75
D)6.25
Question
Exhibit 18.1.The past monthly demands are shown below.The naïve method,that is,the one-period moving average method,is applied to make forecasts.  Refer to Exhibit 18.1.What is the mean square error (MSE)of the forecasts?
A)-1.67
B)275.00
C)91.67
D)8.33
Refer to Exhibit 18.1.What is the mean square error (MSE)of the forecasts?A)-1.67
B)275.00
C)91.67
D)8.33
Question
Question
Exhibit 18.2.The following table includes the information about a monthly time series.  Refer to Exhibit 18.2.When the exponential smoothing method with α = 0.1 is applied,what is the mean absolute deviation (MAD)?
A)20.796
B)9.16
C)3.05
D)3.56
Refer to Exhibit 18.2.When the exponential smoothing method with α = 0.1 is applied,what is the mean absolute deviation (MAD)?A)20.796
B)9.16
C)3.05
D)3.56
Question
Exhibit 18.2.The following table includes the information about a monthly time series.  Refer to Exhibit 18.2.What is the forecast for May when the three-month moving average method is applied?
A)19
B)5
C)20
D)21
Refer to Exhibit 18.2.What is the forecast for May when the three-month moving average method is applied?A)19
B)5
C)20
D)21
Question
Question
Question
Question
Exhibit 18.3.The following table shows the annual revenues (in millions of dollars)of a pharmaceutical company over the period 1990-2011. 
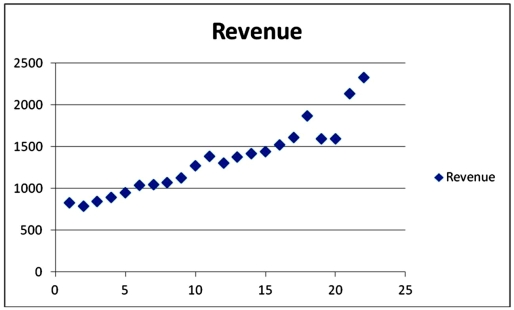 Excel scatterplot shown above indicates that the annual revenues have an increasing trend.Therefore,linear,exponential,quadratic and cubic models were used to fit the trend,and the following relevant information became available after applying linear regression.
  Refer to Exhibit 18.3.What is the revenue forecast for 2012 found by the linear trend equation?
A)About 2 billion 149 million dollars
B)About 2 billion and 189 million dollars
C)About 2 billion and 334 million dollars
D)About 2 billion and 34 million dollars
Excel scatterplot shown above indicates that the annual revenues have an increasing trend.Therefore,linear,exponential,quadratic and cubic models were used to fit the trend,and the following relevant information became available after applying linear regression. Refer to Exhibit 18.3.What is the revenue forecast for 2012 found by the linear trend equation?A)About 2 billion 149 million dollars
B)About 2 billion and 189 million dollars
C)About 2 billion and 334 million dollars
D)About 2 billion and 34 million dollars
Question
In the quadratic trend model, 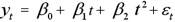 ,which coefficient determines if the trend is going to be U-shaped or inverted U-shaped?
A)
B)
C)
D)
,which coefficient determines if the trend is going to be U-shaped or inverted U-shaped?A)
B)
C)
D)
Question
Exhibit 18.3.The following table shows the annual revenues (in millions of dollars)of a pharmaceutical company over the period 1990-2011. 
 Excel scatterplot shown above indicates that the annual revenues have an increasing trend.Therefore,linear,exponential,quadratic and cubic models were used to fit the trend,and the following relevant information became available after applying linear regression.
  Refer to Exhibit 18.3.Using the linear trend equation,one can say that the predicted revenue increases by
A)642,792,000 a year.
B)$604,930,000 a year.
C)$60,493,000 a year.
D)$6,049,300 a year.
Excel scatterplot shown above indicates that the annual revenues have an increasing trend.Therefore,linear,exponential,quadratic and cubic models were used to fit the trend,and the following relevant information became available after applying linear regression. Refer to Exhibit 18.3.Using the linear trend equation,one can say that the predicted revenue increases byA)642,792,000 a year.
B)$604,930,000 a year.
C)$60,493,000 a year.
D)$6,049,300 a year.
Question
Question
Exhibit 18.2.The following table includes the information about a monthly time series.  Refer to Exhibit 18.2.When the exponential smoothing method with α = 0.1 and α = 0.5 is applied,what is the speed of decline for which the mean absolute deviation (MAD)is better? What is this mean?
A)α = 0.1 and MAD = 3.05
B)α = 0.1 and MAD = 3.00
C)α = 0.5 and MAD = 3.00
D)α = 0.5 and MAD = 3.05
Refer to Exhibit 18.2.When the exponential smoothing method with α = 0.1 and α = 0.5 is applied,what is the speed of decline for which the mean absolute deviation (MAD)is better? What is this mean?A)α = 0.1 and MAD = 3.05
B)α = 0.1 and MAD = 3.00
C)α = 0.5 and MAD = 3.00
D)α = 0.5 and MAD = 3.05
Question
Exhibit 18.3.The following table shows the annual revenues (in millions of dollars)of a pharmaceutical company over the period 1990-2011. 
 Excel scatterplot shown above indicates that the annual revenues have an increasing trend.Therefore,linear,exponential,quadratic and cubic models were used to fit the trend,and the following relevant information became available after applying linear regression.
  Refer to Exhibit 18.3.What is a revenue forecast for 2012 found by the exponential trend equation?
A)About 2 billion and 334 million dollars
B)About 2 billion and 189 million dollars
C)About 2 billion and 149 million dollars
D)About 2 billion and 34 million dollars
Excel scatterplot shown above indicates that the annual revenues have an increasing trend.Therefore,linear,exponential,quadratic and cubic models were used to fit the trend,and the following relevant information became available after applying linear regression. Refer to Exhibit 18.3.What is a revenue forecast for 2012 found by the exponential trend equation?A)About 2 billion and 334 million dollars
B)About 2 billion and 189 million dollars
C)About 2 billion and 149 million dollars
D)About 2 billion and 34 million dollars
Question
Exhibit 18.2.The following table includes the information about a monthly time series.  Refer to Exhibit 18.2.When the exponential smoothing method with α = 0.1 and α = 0.5 is applied,what is the speed of decline for which the mean square error (MSE)is better? What is this mean?
A)α = 0.5 and MSE = 13.67
B)α = 0.1 and MSE = 13.67
C)α = 0.5 and MSE = 10.41
D)α = 0.1 and MSE = 10.41
Refer to Exhibit 18.2.When the exponential smoothing method with α = 0.1 and α = 0.5 is applied,what is the speed of decline for which the mean square error (MSE)is better? What is this mean?A)α = 0.5 and MSE = 13.67
B)α = 0.1 and MSE = 13.67
C)α = 0.5 and MSE = 10.41
D)α = 0.1 and MSE = 10.41
Question
In comparison with the linear trend model,which of the following is not true of the cubic trend model?
A)It has always better MSE.
B)Two additional variables, and
and
 ,are defined in the cubic model.
C)Only one change in the direction of a series can be modeled.
D)It may have better or worse adjusted R2.
A)It has always better MSE.
B)Two additional variables,
and ,are defined in the cubic model.C)Only one change in the direction of a series can be modeled.
D)It may have better or worse adjusted R2.
Question
Question
Exhibit 18.3.The following table shows the annual revenues (in millions of dollars)of a pharmaceutical company over the period 1990-2011. 
 Excel scatterplot shown above indicates that the annual revenues have an increasing trend.Therefore,linear,exponential,quadratic and cubic models were used to fit the trend,and the following relevant information became available after applying linear regression.
  Refer to Exhibit 18.3.When three polynomial trend equations are compared,which of them provides the best fit?
A)linear
B)exponential
C)quadratic
D)cubic
Excel scatterplot shown above indicates that the annual revenues have an increasing trend.Therefore,linear,exponential,quadratic and cubic models were used to fit the trend,and the following relevant information became available after applying linear regression. Refer to Exhibit 18.3.When three polynomial trend equations are compared,which of them provides the best fit?A)linear
B)exponential
C)quadratic
D)cubic
Question
Question
Which of the following formulas is used to make forecasts using the exponential trend model?
A)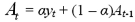
B)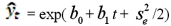
C)
D)
A)
B)
C)
D)
Question
Exhibit 18.2.The following table includes the information about a monthly time series.  Refer to Exhibit 18.2.When the exponential smoothing method with α = 0.1 is applied,what is the mean absolute deviation (MAD)?
A)21.5
B)3.00
C)5.00
D)9.00
Refer to Exhibit 18.2.When the exponential smoothing method with α = 0.1 is applied,what is the mean absolute deviation (MAD)?A)21.5
B)3.00
C)5.00
D)9.00
Question
Exhibit 18.3.The following table shows the annual revenues (in millions of dollars)of a pharmaceutical company over the period 1990-2011. 
 Excel scatterplot shown above indicates that the annual revenues have an increasing trend.Therefore,linear,exponential,quadratic and cubic models were used to fit the trend,and the following relevant information became available after applying linear regression.
 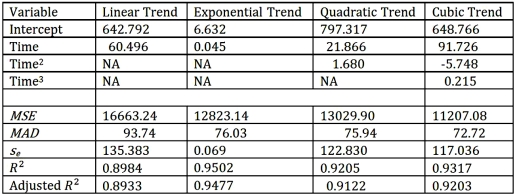 Refer to Exhibit 18.3.What is an exponential trend equation?
A)
B)
C)
D)
Excel scatterplot shown above indicates that the annual revenues have an increasing trend.Therefore,linear,exponential,quadratic and cubic models were used to fit the trend,and the following relevant information became available after applying linear regression. Refer to Exhibit 18.3.What is an exponential trend equation?A)
B)
C)
D)
Question
Question
When comparing which of the following trend models is the adjusted  not used?
A)Linear versus quadratic
B)Linear versus cubic
C)Quadratic versus cubic
D)Linear versus exponential
not used?A)Linear versus quadratic
B)Linear versus cubic
C)Quadratic versus cubic
D)Linear versus exponential
Question
Exhibit 18.2.The following table includes the information about a monthly time series. 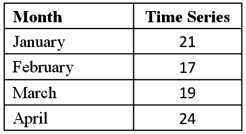 Refer to Exhibit 18.2.When the exponential smoothing method with α = 0.5 is applied,what is the mean square error (MSE)?
A)21.5
B)25
C)41
D)13.67
Refer to Exhibit 18.2.When the exponential smoothing method with α = 0.5 is applied,what is the mean square error (MSE)?A)21.5
B)25
C)41
D)13.67
Question
Exhibit 18.3.The following table shows the annual revenues (in millions of dollars)of a pharmaceutical company over the period 1990-2011. 
 Excel scatterplot shown above indicates that the annual revenues have an increasing trend.Therefore,linear,exponential,quadratic and cubic models were used to fit the trend,and the following relevant information became available after applying linear regression.
 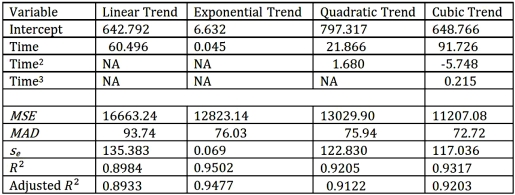 Refer to Exhibit 18.3.What is a linear trend equation?
A)
B)
C)
D)
Excel scatterplot shown above indicates that the annual revenues have an increasing trend.Therefore,linear,exponential,quadratic and cubic models were used to fit the trend,and the following relevant information became available after applying linear regression. Refer to Exhibit 18.3.What is a linear trend equation?A)
B)
C)
D)
Question
Exhibit 18.2.The following table includes the information about a monthly time series.  Refer to Exhibit 18.2.What is the forecast for May using the exponential smoothing method with α = 0.5?
A)21
B)21.5
C)19
D)19.5
Refer to Exhibit 18.2.What is the forecast for May using the exponential smoothing method with α = 0.5?A)21
B)21.5
C)19
D)19.5
Question
Question
Exhibit 18.4.The following ratio-to-moving averages for the seasonally adjusted series were found by the decomposition method applied on a time series representing quarterly sales for the last four years:  Refer to Exhibit 18.4.What is the seasonal index for the fourth quarter?
A)1.3300
B)1.3571
C)1.3842
D)1.2942
Refer to Exhibit 18.4.What is the seasonal index for the fourth quarter?A)1.3300
B)1.3571
C)1.3842
D)1.2942
Question
The linear trend,  for seasonally adjusted monthly sales was estimated using a time series with monthly data from the last five years.Furthermore,the seasonal index for October was found to be 0.92.What is the forecast for the month of October of this year?
A)1639.44
B)1545.60
C)1656.00
D)1800.00
for seasonally adjusted monthly sales was estimated using a time series with monthly data from the last five years.Furthermore,the seasonal index for October was found to be 0.92.What is the forecast for the month of October of this year?A)1639.44
B)1545.60
C)1656.00
D)1800.00
Question
Question
When a time series is analyzed by the model  and the trend component Tt is set to be the centered moving average
  ,which of the following remains to be estimated?
A)
B)
C)
D)
and the trend component Tt is set to be the centered moving average ,which of the following remains to be estimated?A)
B)
C)
D)
Question
Exhibit 18.3.The following table shows the annual revenues (in millions of dollars)of a pharmaceutical company over the period 1990-2011. 
 Excel scatterplot shown above indicates that the annual revenues have an increasing trend.Therefore,linear,exponential,quadratic and cubic models were used to fit the trend,and the following relevant information became available after applying linear regression.
  Refer to Exhibit 18.3.What is the revenue forecast for 2013 found by the trend regression equation with the best fit?
A)About 2 billion and 512 million dollars
B)About 2 billion and 95 million dollars
C)About 2 billion and 248 million dollars
D)About 2 billion and 290 million dollars
Excel scatterplot shown above indicates that the annual revenues have an increasing trend.Therefore,linear,exponential,quadratic and cubic models were used to fit the trend,and the following relevant information became available after applying linear regression. Refer to Exhibit 18.3.What is the revenue forecast for 2013 found by the trend regression equation with the best fit?A)About 2 billion and 512 million dollars
B)About 2 billion and 95 million dollars
C)About 2 billion and 248 million dollars
D)About 2 billion and 290 million dollars
Question
Exhibit 18.4.The following ratio-to-moving averages for the seasonally adjusted series were found by the decomposition method applied on a time series representing quarterly sales for the last four years: 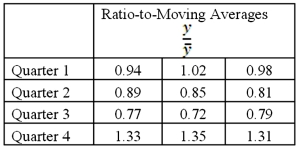 Refer to Exhibit 18.4.By how many percent the sales in Quarter 4 exceed the average quarterly sales?
A)34.20%
B)38.41%
C)33.00%
D)35.71%
Refer to Exhibit 18.4.By how many percent the sales in Quarter 4 exceed the average quarterly sales?A)34.20%
B)38.41%
C)33.00%
D)35.71%
Question
Question
Using the decomposition model 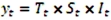 ,forecasts are made by _______,where
  and
and  represent the estimated trend and the (adjusted)seasonal index for period t,respectively.
A)
B)
C)
D)
,forecasts are made by _______,where and represent the estimated trend and the (adjusted)seasonal index for period t,respectively.A)
B)
C)
D)
Question
Exhibit 18.4.The following ratio-to-moving averages for the seasonally adjusted series were found by the decomposition method applied on a time series representing quarterly sales for the last four years:  Refer to Exhibit 18.4.If the trend is described by the trend line
 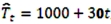 ,what is the forecast for the fourth quarter of this year?
A)2049.22
B)1519.95
C)1600.00
D)2171.36
Refer to Exhibit 18.4.If the trend is described by the trend line ,what is the forecast for the fourth quarter of this year?A)2049.22
B)1519.95
C)1600.00
D)2171.36
Question
Which model is considered for a quarterly time series that seems to change on average by a fixed amount and seems to have seasonality?
A)
B)
C)
D)
A)
B)
C)
D)
Question
When the model 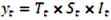 is assumed,to identify the _______,we have to find the seasonally adjusted series.
A)random component
B)seasonality
C)residuals
D)trend
is assumed,to identify the _______,we have to find the seasonally adjusted series.A)random component
B)seasonality
C)residuals
D)trend
Question
Exhibit 18.3.The following table shows the annual revenues (in millions of dollars)of a pharmaceutical company over the period 1990-2011. 
 Excel scatterplot shown above indicates that the annual revenues have an increasing trend.Therefore,linear,exponential,quadratic and cubic models were used to fit the trend,and the following relevant information became available after applying linear regression.
  Refer to Exhibit 18.3.What is a revenue forecast for 2012 found by the polynomial trend equation with the best fit?
A)About 2 billion and 149 million dollars
B)About 2 billion and 189 million dollars
C)About 2 billion and 334 million dollars
D)About 2 billion and 34 million dollars
Excel scatterplot shown above indicates that the annual revenues have an increasing trend.Therefore,linear,exponential,quadratic and cubic models were used to fit the trend,and the following relevant information became available after applying linear regression. Refer to Exhibit 18.3.What is a revenue forecast for 2012 found by the polynomial trend equation with the best fit?A)About 2 billion and 149 million dollars
B)About 2 billion and 189 million dollars
C)About 2 billion and 334 million dollars
D)About 2 billion and 34 million dollars
Question
When a time series is analyzed by the model  ,which of the following is valid?
A)Setting the estimated value of Tt and St at 1.
B)Setting the estimated value of Tt at 1.
C)Setting the estimated value of It at 1.
D)Setting the estimated value of St at 1.
,which of the following is valid?A)Setting the estimated value of Tt and St at 1.
B)Setting the estimated value of Tt at 1.
C)Setting the estimated value of It at 1.
D)Setting the estimated value of St at 1.
Question
If the model  is applied,which of the following indicates no seasonality?
A)The sum of the adjusted seasonal indices equals the number of seasons.
B)The average of the adjusted seasonal indices equals 1.
C)Every adjusted seasonal index is practically 1.
D)The product of the adjusted seasonal indices equals 1.
is applied,which of the following indicates no seasonality?A)The sum of the adjusted seasonal indices equals the number of seasons.
B)The average of the adjusted seasonal indices equals 1.
C)Every adjusted seasonal index is practically 1.
D)The product of the adjusted seasonal indices equals 1.
Question
Question
Question
In the decomposition method,which of the following time series is used to estimate the trend?
A)
B)
C)
D)
A)
B)
C)
D)
Question
In the decomposition method,which of the following time series is used to estimate the trend?
A)
B)
C)
D)
A)
B)
C)
D)
Question
Exhibit 18.3.The following table shows the annual revenues (in millions of dollars)of a pharmaceutical company over the period 1990-2011. 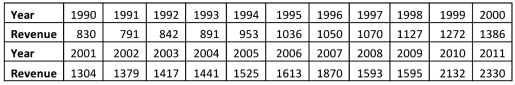
 Excel scatterplot shown above indicates that the annual revenues have an increasing trend.Therefore,linear,exponential,quadratic and cubic models were used to fit the trend,and the following relevant information became available after applying linear regression.
  Refer to Exhibit 18.3.When all four trend regression equations are compared,which of them provides the best fit?
A)linear
B)exponential
C)quadratic
D)cubic
Excel scatterplot shown above indicates that the annual revenues have an increasing trend.Therefore,linear,exponential,quadratic and cubic models were used to fit the trend,and the following relevant information became available after applying linear regression. Refer to Exhibit 18.3.When all four trend regression equations are compared,which of them provides the best fit?A)linear
B)exponential
C)quadratic
D)cubic

Unlock Deck
Sign up to unlock the cards in this deck!
Unlock Deck
Unlock Deck
1/103
Play
Full screen (f)
Deck 18: Time Series and Forecasting
1
While we use the mean square error (MSE)to compare the linear and the exponential trend models,we cannot use it to compare the linear,quadratic,and cubic trend models.
True
2
When a time series has both trend and seasonality,moving averages can be employed to separate the effect of these two components.
True
3
The centered moving average CMA,applied in the decomposition analysis of a time series with trend and seasonality,is the average of two consecutive moving averages.
True
4
The moving average method is one of the most complex smoothing techniques used for processing time series.
Unlock Deck
Unlock for access to all 103 flashcards in this deck.
Unlock Deck
k this deck
5
Which of the following factors refers to quantitative forecasting methods?
A)Judgment of the forecaster
B)A formal model for analyzing historical data
C)Prior experience of the forecaster
D)Expertise of the forecaster
A)Judgment of the forecaster
B)A formal model for analyzing historical data
C)Prior experience of the forecaster
D)Expertise of the forecaster
Unlock Deck
Unlock for access to all 103 flashcards in this deck.
Unlock Deck
k this deck
6
Non-causal forecasting models are purely time series models in the sense that the forecasts are made based only upon historical data concerning the variable of interest.
Unlock Deck
Unlock for access to all 103 flashcards in this deck.
Unlock Deck
k this deck
7
A time series is ____.
A)any set of data recorded at the same point in time.
B)a sequence of sequential observations of a variable over time.
C)a set of randomly measured data points of multiple variables at the same point in time.
D)any set of data collected without regard to differences in time.
A)any set of data recorded at the same point in time.
B)a sequence of sequential observations of a variable over time.
C)a set of randomly measured data points of multiple variables at the same point in time.
D)any set of data collected without regard to differences in time.
Unlock Deck
Unlock for access to all 103 flashcards in this deck.
Unlock Deck
k this deck
8
Quantitative forecasting procedures are based on the judgment of the forecaster,who uses prior experience and expertise to make forecasts.
Unlock Deck
Unlock for access to all 103 flashcards in this deck.
Unlock Deck
k this deck
9
When the decomposition model, ,is applied,forecasts are made as ,where represents the estimated trend for seasonally adjusted time series for period t,and is the seasonal index for period t.
,is applied,forecasts are made as ,where represents the estimated trend for seasonally adjusted time series for period t,and is the seasonal index for period t. Unlock Deck
Unlock for access to all 103 flashcards in this deck.
Unlock Deck
k this deck
10
When the exponential trend model is used to make forecasts,it is preferable to round the estimates b0,b1 and se in the equation .
. Unlock Deck
Unlock for access to all 103 flashcards in this deck.
Unlock Deck
k this deck
11
The exponential trend model is attractive when the increase in the series gets larger over time.
Unlock Deck
Unlock for access to all 103 flashcards in this deck.
Unlock Deck
k this deck
12
The exponential smoothing method weighs all available observations in a time series equally.
Unlock Deck
Unlock for access to all 103 flashcards in this deck.
Unlock Deck
k this deck
13
Smoothing techniques are suitable for use when forecasts need to be updated frequently due to new observations that become available.
Unlock Deck
Unlock for access to all 103 flashcards in this deck.
Unlock Deck
k this deck
14
In forecasting methods,the mean square error (MSE)is computed by dividing the sum of squared residuals (errors)by the number of observations n for which the residuals are available.
Unlock Deck
Unlock for access to all 103 flashcards in this deck.
Unlock Deck
k this deck
15
When the forecasting method of seasonal dummy variables is applied on a quarterly time series,four dummy variables are needed.
Unlock Deck
Unlock for access to all 103 flashcards in this deck.
Unlock Deck
k this deck
16
Which of the following is not an example of a time series?
A)Hourly volume of stocks traded on the New York Stock Exchange (NYSE)on the five last trading days.
B)The number of daily visitors that frequent the Statue of Liberty during the month of July.
C)The monthly sales for a retailer over a five-year period.
D)The current temperature in the 49 state capitals.
Unlock Deck
Unlock for access to all 103 flashcards in this deck.
Unlock Deck
k this deck
17
Under which of the following conditions is qualitative forecasting considered attractive?
A)When the forecasts have to be documented
B)When the forecasts have to be independent of the forecaster's judgment
C)When past data are either unavailable or are misleading
D)When the forecasts can be based on reliable data
A)When the forecasts have to be documented
B)When the forecasts have to be independent of the forecaster's judgment
C)When past data are either unavailable or are misleading
D)When the forecasts can be based on reliable data
Unlock Deck
Unlock for access to all 103 flashcards in this deck.
Unlock Deck
k this deck
18
Which of the following is an example of a time series?
A)The number of daily visitors to the Niagara Falls during the month of April.
B)The recorded exam scores of students in a class.
C)The sales prices of single family homes sold last month in Florida.
D)The current average prices of regular gasoline in different states of the U.S.
A)The number of daily visitors to the Niagara Falls during the month of April.
B)The recorded exam scores of students in a class.
C)The sales prices of single family homes sold last month in Florida.
D)The current average prices of regular gasoline in different states of the U.S.
Unlock Deck
Unlock for access to all 103 flashcards in this deck.
Unlock Deck
k this deck
19
Causal forecasting models are based on regression framework,where the variable to be forecast depends on one or more explanatory variables.
Unlock Deck
Unlock for access to all 103 flashcards in this deck.
Unlock Deck
k this deck
20
The cyclical component of a time series typically represents repetitions within a one-year period.
Unlock Deck
Unlock for access to all 103 flashcards in this deck.
Unlock Deck
k this deck
21
Which of the following is true of the exponential smoothing method?
A)It does not incorporate new observations into existing forecasts.
B)It weighs all recent observations equally.
C)It assigns exponentially decreasing weights to older observations.
D)It does not use all available observations in making a forecast.
A)It does not incorporate new observations into existing forecasts.
B)It weighs all recent observations equally.
C)It assigns exponentially decreasing weights to older observations.
D)It does not use all available observations in making a forecast.
Unlock Deck
Unlock for access to all 103 flashcards in this deck.
Unlock Deck
k this deck
22
Exhibit 18.2.The following table includes the information about a monthly time series. Refer to Exhibit 18.2.When the exponential smoothing method with α = 0.1 is applied,what is the mean square error (MSE)?
A)20.796
B)31.2336
C)12.6736
D)10.41
Refer to Exhibit 18.2.When the exponential smoothing method with α = 0.1 is applied,what is the mean square error (MSE)?A)20.796
B)31.2336
C)12.6736
D)10.41
Unlock Deck
Unlock for access to all 103 flashcards in this deck.
Unlock Deck
k this deck
23
Exhibit 18.2.The following table includes the information about a monthly time series. Refer to Exhibit 18.2.What is the forecast for May using the exponential smoothing method with α = 0.1?
A)20.796
B)21.000
C)20.600
D)20.440
Refer to Exhibit 18.2.What is the forecast for May using the exponential smoothing method with α = 0.1?A)20.796
B)21.000
C)20.600
D)20.440
Unlock Deck
Unlock for access to all 103 flashcards in this deck.
Unlock Deck
k this deck
24
Which of the following is not true of a time series with a cyclical component?
A)It has wavelike fluctuations lasting from several months to several years.
B)It is difficult to analyze because cycles vary in length and amplitude.
C)It typically coincides with business cycles in the economy.
D)It has wavelike fluctuations always lasting less than a year.
A)It has wavelike fluctuations lasting from several months to several years.
B)It is difficult to analyze because cycles vary in length and amplitude.
C)It typically coincides with business cycles in the economy.
D)It has wavelike fluctuations always lasting less than a year.
Unlock Deck
Unlock for access to all 103 flashcards in this deck.
Unlock Deck
k this deck
25
Which of the following is a similarity between the exponential smoothing method and the moving average method?
A)Both methods give different weights to most recent observations.
B)Both methods assign weights to all available observations.
C)Both methods give equal weight to every observation.
D)Both methods continually revise a forecast when a new observation becomes available.
A)Both methods give different weights to most recent observations.
B)Both methods assign weights to all available observations.
C)Both methods give equal weight to every observation.
D)Both methods continually revise a forecast when a new observation becomes available.
Unlock Deck
Unlock for access to all 103 flashcards in this deck.
Unlock Deck
k this deck
26
In a moving average method,when a new observation becomes available,the new average is computed by including the new observation and
A)dropping the oldest observation.
B)keeping the previous m observations.
C)dropping the youngest previous observation.
D)keeping any previous m - 1 observations.
A)dropping the oldest observation.
B)keeping the previous m observations.
C)dropping the youngest previous observation.
D)keeping any previous m - 1 observations.
Unlock Deck
Unlock for access to all 103 flashcards in this deck.
Unlock Deck
k this deck
27
Exhibit 18.2.The following table includes the information about a monthly time series. Refer to Exhibit 18.2.When a forecast is made by the three-month moving average method,all three monthly observations used to make this forecast are treated equally in the sense that each of them has the same weight of 1/3.What is the forecast for May when the three-month weighted moving average method is applied with the weights: 1/6,2/6,and 3/6? Assign the smallest weight to the oldest data and the largest weight to the most recent data.
A)19.00
B)24.00
C)18.67
D)21.17
Refer to Exhibit 18.2.When a forecast is made by the three-month moving average method,all three monthly observations used to make this forecast are treated equally in the sense that each of them has the same weight of 1/3.What is the forecast for May when the three-month weighted moving average method is applied with the weights: 1/6,2/6,and 3/6? Assign the smallest weight to the oldest data and the largest weight to the most recent data.A)19.00
B)24.00
C)18.67
D)21.17
Unlock Deck
Unlock for access to all 103 flashcards in this deck.
Unlock Deck
k this deck
28
Exhibit 18.1.The past monthly demands are shown below.The naive method,that is,the one-period moving average method,is applied to make forecasts. Refer to Exhibit 18.1.What is the mean absolute deviation (MAD)of the forecasts?
A)-1.67
B)25.00
C)91.67
D)8.33
Refer to Exhibit 18.1.What is the mean absolute deviation (MAD)of the forecasts?A)-1.67
B)25.00
C)91.67
D)8.33
Unlock Deck
Unlock for access to all 103 flashcards in this deck.
Unlock Deck
k this deck
29
A time series with observed long-term upward movements in its values is said to have
A)a cyclical component
B)an increasing trend component
C)a seasonally increasing component
D)a decreasing trend component
A)a cyclical component
B)an increasing trend component
C)a seasonally increasing component
D)a decreasing trend component
Unlock Deck
Unlock for access to all 103 flashcards in this deck.
Unlock Deck
k this deck
30
Which of the following is not a criticism made of qualitative forecasts?
A)They become the only possible ones when past data are either not available or are misleading.
B)They are prone to biases such as optimism and overconfidence.
C)They do not present any explanation of the mechanism generating the values of a variable of interest,and simply provide a method for projecting historical data.
D)They provide no guidance on the likely effects of changes in explanatory variables.
Unlock Deck
Unlock for access to all 103 flashcards in this deck.
Unlock Deck
k this deck
31
Under which of the following conditions is qualitative forecasting considered attractive?
A)When past data are either misleading or obsolete
B)When the forecasts have to be documented
C)When the forecasts have to be independent of the forecaster's judgment
D)When the forecasts can be based on reliable data
A)When past data are either misleading or obsolete
B)When the forecasts have to be documented
C)When the forecasts have to be independent of the forecaster's judgment
D)When the forecasts can be based on reliable data
Unlock Deck
Unlock for access to all 103 flashcards in this deck.
Unlock Deck
k this deck
32
In the exponential smoothing formula for updating the level of the series, ,what does α represent?
A)The weighted average of the exponentially declining weights.
B)The speed of decline in the weights of older observations.
C)The initial value of the time series.
D)The last value of the time series.
,what does α represent?A)The weighted average of the exponentially declining weights.
B)The speed of decline in the weights of older observations.
C)The initial value of the time series.
D)The last value of the time series.
Unlock Deck
Unlock for access to all 103 flashcards in this deck.
Unlock Deck
k this deck
33
Which of the following is a criticism made of qualitative forecasts?
A)They become the only possible forecast when past data are either not available or are misleading.
B)They provide no guidance on the likely effects of changes in explanatory variables.
C)They are prone to biases such as optimism and overconfidence.
D)They are difficult to document.
A)They become the only possible forecast when past data are either not available or are misleading.
B)They provide no guidance on the likely effects of changes in explanatory variables.
C)They are prone to biases such as optimism and overconfidence.
D)They are difficult to document.
Unlock Deck
Unlock for access to all 103 flashcards in this deck.
Unlock Deck
k this deck
34
Exhibit 18.1.The past monthly demands are shown below.The naïve method,that is,the one-period moving average method,is applied to make forecasts. Refer to Exhibit 18.1.If May's demand appears to be 35,what is the residual (error)for May?
A)35
B)0
C)68.75
D)6.25
Refer to Exhibit 18.1.If May's demand appears to be 35,what is the residual (error)for May?A)35
B)0
C)68.75
D)6.25
Unlock Deck
Unlock for access to all 103 flashcards in this deck.
Unlock Deck
k this deck
35
Exhibit 18.1.The past monthly demands are shown below.The naïve method,that is,the one-period moving average method,is applied to make forecasts. Refer to Exhibit 18.1.What is the mean square error (MSE)of the forecasts?
A)-1.67
B)275.00
C)91.67
D)8.33
Refer to Exhibit 18.1.What is the mean square error (MSE)of the forecasts?A)-1.67
B)275.00
C)91.67
D)8.33
Unlock Deck
Unlock for access to all 103 flashcards in this deck.
Unlock Deck
k this deck
36
The ________ method is a smoothing technique based on computing the average from a fixed number of the most recent observations.
A)exponential smoothing
B)moving average
C)linear regression
D)casual regression
A)exponential smoothing
B)moving average
C)linear regression
D)casual regression
Unlock Deck
Unlock for access to all 103 flashcards in this deck.
Unlock Deck
k this deck
37
Exhibit 18.2.The following table includes the information about a monthly time series. Refer to Exhibit 18.2.When the exponential smoothing method with α = 0.1 is applied,what is the mean absolute deviation (MAD)?
A)20.796
B)9.16
C)3.05
D)3.56
Refer to Exhibit 18.2.When the exponential smoothing method with α = 0.1 is applied,what is the mean absolute deviation (MAD)?A)20.796
B)9.16
C)3.05
D)3.56
Unlock Deck
Unlock for access to all 103 flashcards in this deck.
Unlock Deck
k this deck
38
Exhibit 18.2.The following table includes the information about a monthly time series. Refer to Exhibit 18.2.What is the forecast for May when the three-month moving average method is applied?
A)19
B)5
C)20
D)21
Refer to Exhibit 18.2.What is the forecast for May when the three-month moving average method is applied?A)19
B)5
C)20
D)21
Unlock Deck
Unlock for access to all 103 flashcards in this deck.
Unlock Deck
k this deck
39
In which of the following situations is the use of qualitative forecasts most appropriate?
A)A marketing manager has to forecast monthly sales for the coming financial year based on the past monthly sales figures.
B)A TV network executive has to forecast viewership figures for a daily talk show based on historical data from the past on a similar show on a rival network.
C)An economist has to forecast credit flow resulting from a newly introduced stimulus package by the federal government.
D)A country's annual rate of growth for the upcoming year has to be estimated based on the annual GDP data from the last 20 years.
Unlock Deck
Unlock for access to all 103 flashcards in this deck.
Unlock Deck
k this deck
40
All criteria used for selecting the best forecasting method _______.
A)work on a regression model framework
B)base their calculation on the forecaster's judgment
C)base their calculations solely on known values of explanatory variables
D)compare competing models on the basis of residuals
A)work on a regression model framework
B)base their calculation on the forecaster's judgment
C)base their calculations solely on known values of explanatory variables
D)compare competing models on the basis of residuals
Unlock Deck
Unlock for access to all 103 flashcards in this deck.
Unlock Deck
k this deck
41
Which of the following types of trend models will best suit a series where the value of the series changes by a fixed amount for each period?
A)Cubic trend
B)Linear trend
C)Exponential trend
D)Quadratic trend
A)Cubic trend
B)Linear trend
C)Exponential trend
D)Quadratic trend
Unlock Deck
Unlock for access to all 103 flashcards in this deck.
Unlock Deck
k this deck
42
Exhibit 18.3.The following table shows the annual revenues (in millions of dollars)of a pharmaceutical company over the period 1990-2011. Excel scatterplot shown above indicates that the annual revenues have an increasing trend.Therefore,linear,exponential,quadratic and cubic models were used to fit the trend,and the following relevant information became available after applying linear regression. Refer to Exhibit 18.3.What is the revenue forecast for 2012 found by the linear trend equation?
A)About 2 billion 149 million dollars
B)About 2 billion and 189 million dollars
C)About 2 billion and 334 million dollars
D)About 2 billion and 34 million dollars
Excel scatterplot shown above indicates that the annual revenues have an increasing trend.Therefore,linear,exponential,quadratic and cubic models were used to fit the trend,and the following relevant information became available after applying linear regression. Refer to Exhibit 18.3.What is the revenue forecast for 2012 found by the linear trend equation?A)About 2 billion 149 million dollars
B)About 2 billion and 189 million dollars
C)About 2 billion and 334 million dollars
D)About 2 billion and 34 million dollars
Unlock Deck
Unlock for access to all 103 flashcards in this deck.
Unlock Deck
k this deck
43
In the quadratic trend model, ,which coefficient determines if the trend is going to be U-shaped or inverted U-shaped?
A)
B)
C)
D)
,which coefficient determines if the trend is going to be U-shaped or inverted U-shaped?A)
B)
C)
D)
Unlock Deck
Unlock for access to all 103 flashcards in this deck.
Unlock Deck
k this deck
44
Exhibit 18.3.The following table shows the annual revenues (in millions of dollars)of a pharmaceutical company over the period 1990-2011. Excel scatterplot shown above indicates that the annual revenues have an increasing trend.Therefore,linear,exponential,quadratic and cubic models were used to fit the trend,and the following relevant information became available after applying linear regression. Refer to Exhibit 18.3.Using the linear trend equation,one can say that the predicted revenue increases by
A)642,792,000 a year.
B)$604,930,000 a year.
C)$60,493,000 a year.
D)$6,049,300 a year.
Excel scatterplot shown above indicates that the annual revenues have an increasing trend.Therefore,linear,exponential,quadratic and cubic models were used to fit the trend,and the following relevant information became available after applying linear regression. Refer to Exhibit 18.3.Using the linear trend equation,one can say that the predicted revenue increases byA)642,792,000 a year.
B)$604,930,000 a year.
C)$60,493,000 a year.
D)$6,049,300 a year.
Unlock Deck
Unlock for access to all 103 flashcards in this deck.
Unlock Deck
k this deck
45
The ________ is a trend model that allows for one change in the direction of a series.
A)linear trend model
B)exponential trend model
C)quadratic trend model
D)cubic trend model
A)linear trend model
B)exponential trend model
C)quadratic trend model
D)cubic trend model
Unlock Deck
Unlock for access to all 103 flashcards in this deck.
Unlock Deck
k this deck
46
Exhibit 18.2.The following table includes the information about a monthly time series. Refer to Exhibit 18.2.When the exponential smoothing method with α = 0.1 and α = 0.5 is applied,what is the speed of decline for which the mean absolute deviation (MAD)is better? What is this mean?
A)α = 0.1 and MAD = 3.05
B)α = 0.1 and MAD = 3.00
C)α = 0.5 and MAD = 3.00
D)α = 0.5 and MAD = 3.05
Refer to Exhibit 18.2.When the exponential smoothing method with α = 0.1 and α = 0.5 is applied,what is the speed of decline for which the mean absolute deviation (MAD)is better? What is this mean?A)α = 0.1 and MAD = 3.05
B)α = 0.1 and MAD = 3.00
C)α = 0.5 and MAD = 3.00
D)α = 0.5 and MAD = 3.05
Unlock Deck
Unlock for access to all 103 flashcards in this deck.
Unlock Deck
k this deck
47
Exhibit 18.3.The following table shows the annual revenues (in millions of dollars)of a pharmaceutical company over the period 1990-2011. Excel scatterplot shown above indicates that the annual revenues have an increasing trend.Therefore,linear,exponential,quadratic and cubic models were used to fit the trend,and the following relevant information became available after applying linear regression. Refer to Exhibit 18.3.What is a revenue forecast for 2012 found by the exponential trend equation?
A)About 2 billion and 334 million dollars
B)About 2 billion and 189 million dollars
C)About 2 billion and 149 million dollars
D)About 2 billion and 34 million dollars
Excel scatterplot shown above indicates that the annual revenues have an increasing trend.Therefore,linear,exponential,quadratic and cubic models were used to fit the trend,and the following relevant information became available after applying linear regression. Refer to Exhibit 18.3.What is a revenue forecast for 2012 found by the exponential trend equation?A)About 2 billion and 334 million dollars
B)About 2 billion and 189 million dollars
C)About 2 billion and 149 million dollars
D)About 2 billion and 34 million dollars
Unlock Deck
Unlock for access to all 103 flashcards in this deck.
Unlock Deck
k this deck
48
Exhibit 18.2.The following table includes the information about a monthly time series. Refer to Exhibit 18.2.When the exponential smoothing method with α = 0.1 and α = 0.5 is applied,what is the speed of decline for which the mean square error (MSE)is better? What is this mean?
A)α = 0.5 and MSE = 13.67
B)α = 0.1 and MSE = 13.67
C)α = 0.5 and MSE = 10.41
D)α = 0.1 and MSE = 10.41
Refer to Exhibit 18.2.When the exponential smoothing method with α = 0.1 and α = 0.5 is applied,what is the speed of decline for which the mean square error (MSE)is better? What is this mean?A)α = 0.5 and MSE = 13.67
B)α = 0.1 and MSE = 13.67
C)α = 0.5 and MSE = 10.41
D)α = 0.1 and MSE = 10.41
Unlock Deck
Unlock for access to all 103 flashcards in this deck.
Unlock Deck
k this deck
49
In comparison with the linear trend model,which of the following is not true of the cubic trend model?
A)It has always better MSE.
B)Two additional variables, and
,are defined in the cubic model.
C)Only one change in the direction of a series can be modeled.
D)It may have better or worse adjusted R2.
A)It has always better MSE.
B)Two additional variables,
and ,are defined in the cubic model.C)Only one change in the direction of a series can be modeled.
D)It may have better or worse adjusted R2.
Unlock Deck
Unlock for access to all 103 flashcards in this deck.
Unlock Deck
k this deck
50
A polynomial trend model that only allows one change in the direction of a series is known as a(n)_______.
A)exponential trend model
B)linear trend model
C)cubic trend model
D)quadratic trend model
A)exponential trend model
B)linear trend model
C)cubic trend model
D)quadratic trend model
Unlock Deck
Unlock for access to all 103 flashcards in this deck.
Unlock Deck
k this deck
51
Exhibit 18.3.The following table shows the annual revenues (in millions of dollars)of a pharmaceutical company over the period 1990-2011. Excel scatterplot shown above indicates that the annual revenues have an increasing trend.Therefore,linear,exponential,quadratic and cubic models were used to fit the trend,and the following relevant information became available after applying linear regression. Refer to Exhibit 18.3.When three polynomial trend equations are compared,which of them provides the best fit?
A)linear
B)exponential
C)quadratic
D)cubic
Excel scatterplot shown above indicates that the annual revenues have an increasing trend.Therefore,linear,exponential,quadratic and cubic models were used to fit the trend,and the following relevant information became available after applying linear regression. Refer to Exhibit 18.3.When three polynomial trend equations are compared,which of them provides the best fit?A)linear
B)exponential
C)quadratic
D)cubic
Unlock Deck
Unlock for access to all 103 flashcards in this deck.
Unlock Deck
k this deck
52
Which of the following is true of the linear trend model?
A)It assigns exponentially decreasing weights to older observations.
B)It is a causal forecasting model.
C)It can extract a long-term upward or downward steady movement in a series.
D)It is used when a series involves only random fluctuations.
A)It assigns exponentially decreasing weights to older observations.
B)It is a causal forecasting model.
C)It can extract a long-term upward or downward steady movement in a series.
D)It is used when a series involves only random fluctuations.
Unlock Deck
Unlock for access to all 103 flashcards in this deck.
Unlock Deck
k this deck
53
Which of the following formulas is used to make forecasts using the exponential trend model?
A)
B)
C)
D)
A)
B)
C)
D)
Unlock Deck
Unlock for access to all 103 flashcards in this deck.
Unlock Deck
k this deck
54
Exhibit 18.2.The following table includes the information about a monthly time series. Refer to Exhibit 18.2.When the exponential smoothing method with α = 0.1 is applied,what is the mean absolute deviation (MAD)?
A)21.5
B)3.00
C)5.00
D)9.00
Refer to Exhibit 18.2.When the exponential smoothing method with α = 0.1 is applied,what is the mean absolute deviation (MAD)?A)21.5
B)3.00
C)5.00
D)9.00
Unlock Deck
Unlock for access to all 103 flashcards in this deck.
Unlock Deck
k this deck
55
Exhibit 18.3.The following table shows the annual revenues (in millions of dollars)of a pharmaceutical company over the period 1990-2011. Excel scatterplot shown above indicates that the annual revenues have an increasing trend.Therefore,linear,exponential,quadratic and cubic models were used to fit the trend,and the following relevant information became available after applying linear regression. Refer to Exhibit 18.3.What is an exponential trend equation?
A)
B)
C)
D)
Excel scatterplot shown above indicates that the annual revenues have an increasing trend.Therefore,linear,exponential,quadratic and cubic models were used to fit the trend,and the following relevant information became available after applying linear regression. Refer to Exhibit 18.3.What is an exponential trend equation?A)
B)
C)
D)
Unlock Deck
Unlock for access to all 103 flashcards in this deck.
Unlock Deck
k this deck
56
Which of the following types of trend models will best suit a series where the increase in value of the series gets larger over time?
A)Exponential trend
B)Linear trend
C)Quadratic trend
D)polynomial trend
A)Exponential trend
B)Linear trend
C)Quadratic trend
D)polynomial trend
Unlock Deck
Unlock for access to all 103 flashcards in this deck.
Unlock Deck
k this deck
57
When comparing which of the following trend models is the adjusted not used?
A)Linear versus quadratic
B)Linear versus cubic
C)Quadratic versus cubic
D)Linear versus exponential
not used?A)Linear versus quadratic
B)Linear versus cubic
C)Quadratic versus cubic
D)Linear versus exponential
Unlock Deck
Unlock for access to all 103 flashcards in this deck.
Unlock Deck
k this deck
58
Exhibit 18.2.The following table includes the information about a monthly time series. Refer to Exhibit 18.2.When the exponential smoothing method with α = 0.5 is applied,what is the mean square error (MSE)?
A)21.5
B)25
C)41
D)13.67
Refer to Exhibit 18.2.When the exponential smoothing method with α = 0.5 is applied,what is the mean square error (MSE)?A)21.5
B)25
C)41
D)13.67
Unlock Deck
Unlock for access to all 103 flashcards in this deck.
Unlock Deck
k this deck
59
Exhibit 18.3.The following table shows the annual revenues (in millions of dollars)of a pharmaceutical company over the period 1990-2011. Excel scatterplot shown above indicates that the annual revenues have an increasing trend.Therefore,linear,exponential,quadratic and cubic models were used to fit the trend,and the following relevant information became available after applying linear regression. Refer to Exhibit 18.3.What is a linear trend equation?
A)
B)
C)
D)
Excel scatterplot shown above indicates that the annual revenues have an increasing trend.Therefore,linear,exponential,quadratic and cubic models were used to fit the trend,and the following relevant information became available after applying linear regression. Refer to Exhibit 18.3.What is a linear trend equation?A)
B)
C)
D)
Unlock Deck
Unlock for access to all 103 flashcards in this deck.
Unlock Deck
k this deck
60
Exhibit 18.2.The following table includes the information about a monthly time series. Refer to Exhibit 18.2.What is the forecast for May using the exponential smoothing method with α = 0.5?
A)21
B)21.5
C)19
D)19.5
Refer to Exhibit 18.2.What is the forecast for May using the exponential smoothing method with α = 0.5?A)21
B)21.5
C)19
D)19.5
Unlock Deck
Unlock for access to all 103 flashcards in this deck.
Unlock Deck
k this deck
61
In the time series decomposition method,to obtain the _______,we divide the original observations by their corresponding adjusted seasonal indices.
A)seasonal dummy variables
B)seasonally adjusted series
C)unadjusted seasonal indices
D)adjusted seasonal indices
A)seasonal dummy variables
B)seasonally adjusted series
C)unadjusted seasonal indices
D)adjusted seasonal indices
Unlock Deck
Unlock for access to all 103 flashcards in this deck.
Unlock Deck
k this deck
62
Exhibit 18.4.The following ratio-to-moving averages for the seasonally adjusted series were found by the decomposition method applied on a time series representing quarterly sales for the last four years: Refer to Exhibit 18.4.What is the seasonal index for the fourth quarter?
A)1.3300
B)1.3571
C)1.3842
D)1.2942
Refer to Exhibit 18.4.What is the seasonal index for the fourth quarter?A)1.3300
B)1.3571
C)1.3842
D)1.2942
Unlock Deck
Unlock for access to all 103 flashcards in this deck.
Unlock Deck
k this deck
63
The linear trend, for seasonally adjusted monthly sales was estimated using a time series with monthly data from the last five years.Furthermore,the seasonal index for October was found to be 0.92.What is the forecast for the month of October of this year?
A)1639.44
B)1545.60
C)1656.00
D)1800.00
for seasonally adjusted monthly sales was estimated using a time series with monthly data from the last five years.Furthermore,the seasonal index for October was found to be 0.92.What is the forecast for the month of October of this year?A)1639.44
B)1545.60
C)1656.00
D)1800.00
Unlock Deck
Unlock for access to all 103 flashcards in this deck.
Unlock Deck
k this deck
64
A seasonal component differs from a cyclical component in that the seasonal component:
A)is difficult to capture with historical data.
B)refers to fluctuations that may last more than a year.
C)represents wavelike fluctuations caused by business cycles.
D)represents some regular repetitions within a one-year period.
A)is difficult to capture with historical data.
B)refers to fluctuations that may last more than a year.
C)represents wavelike fluctuations caused by business cycles.
D)represents some regular repetitions within a one-year period.
Unlock Deck
Unlock for access to all 103 flashcards in this deck.
Unlock Deck
k this deck
65
When a time series is analyzed by the model and the trend component Tt is set to be the centered moving average ,which of the following remains to be estimated?
A)
B)
C)
D)
and the trend component Tt is set to be the centered moving average ,which of the following remains to be estimated?A)
B)
C)
D)
Unlock Deck
Unlock for access to all 103 flashcards in this deck.
Unlock Deck
k this deck
66
Exhibit 18.3.The following table shows the annual revenues (in millions of dollars)of a pharmaceutical company over the period 1990-2011. Excel scatterplot shown above indicates that the annual revenues have an increasing trend.Therefore,linear,exponential,quadratic and cubic models were used to fit the trend,and the following relevant information became available after applying linear regression. Refer to Exhibit 18.3.What is the revenue forecast for 2013 found by the trend regression equation with the best fit?
A)About 2 billion and 512 million dollars
B)About 2 billion and 95 million dollars
C)About 2 billion and 248 million dollars
D)About 2 billion and 290 million dollars
Excel scatterplot shown above indicates that the annual revenues have an increasing trend.Therefore,linear,exponential,quadratic and cubic models were used to fit the trend,and the following relevant information became available after applying linear regression. Refer to Exhibit 18.3.What is the revenue forecast for 2013 found by the trend regression equation with the best fit?A)About 2 billion and 512 million dollars
B)About 2 billion and 95 million dollars
C)About 2 billion and 248 million dollars
D)About 2 billion and 290 million dollars
Unlock Deck
Unlock for access to all 103 flashcards in this deck.
Unlock Deck
k this deck
67
Exhibit 18.4.The following ratio-to-moving averages for the seasonally adjusted series were found by the decomposition method applied on a time series representing quarterly sales for the last four years: Refer to Exhibit 18.4.By how many percent the sales in Quarter 4 exceed the average quarterly sales?
A)34.20%
B)38.41%
C)33.00%
D)35.71%
Refer to Exhibit 18.4.By how many percent the sales in Quarter 4 exceed the average quarterly sales?A)34.20%
B)38.41%
C)33.00%
D)35.71%
Unlock Deck
Unlock for access to all 103 flashcards in this deck.
Unlock Deck
k this deck
68
Which of the following is a centered moving average?
A)The average of all moving averages in a series.
B)The average of all observations of a series.
C)The average of alternative moving averages in a series.
D)The average of two consecutive moving averages in a series.
A)The average of all moving averages in a series.
B)The average of all observations of a series.
C)The average of alternative moving averages in a series.
D)The average of two consecutive moving averages in a series.
Unlock Deck
Unlock for access to all 103 flashcards in this deck.
Unlock Deck
k this deck
69
Using the decomposition model ,forecasts are made by _______,where and represent the estimated trend and the (adjusted)seasonal index for period t,respectively.
A)
B)
C)
D)
,forecasts are made by _______,where and represent the estimated trend and the (adjusted)seasonal index for period t,respectively.A)
B)
C)
D)
Unlock Deck
Unlock for access to all 103 flashcards in this deck.
Unlock Deck
k this deck
70
Exhibit 18.4.The following ratio-to-moving averages for the seasonally adjusted series were found by the decomposition method applied on a time series representing quarterly sales for the last four years: Refer to Exhibit 18.4.If the trend is described by the trend line ,what is the forecast for the fourth quarter of this year?
A)2049.22
B)1519.95
C)1600.00
D)2171.36
Refer to Exhibit 18.4.If the trend is described by the trend line ,what is the forecast for the fourth quarter of this year?A)2049.22
B)1519.95
C)1600.00
D)2171.36
Unlock Deck
Unlock for access to all 103 flashcards in this deck.
Unlock Deck
k this deck
71
Which model is considered for a quarterly time series that seems to change on average by a fixed amount and seems to have seasonality?
A)
B)
C)
D)
A)
B)
C)
D)
Unlock Deck
Unlock for access to all 103 flashcards in this deck.
Unlock Deck
k this deck
72
When the model is assumed,to identify the _______,we have to find the seasonally adjusted series.
A)random component
B)seasonality
C)residuals
D)trend
is assumed,to identify the _______,we have to find the seasonally adjusted series.A)random component
B)seasonality
C)residuals
D)trend
Unlock Deck
Unlock for access to all 103 flashcards in this deck.
Unlock Deck
k this deck
73
Exhibit 18.3.The following table shows the annual revenues (in millions of dollars)of a pharmaceutical company over the period 1990-2011. Excel scatterplot shown above indicates that the annual revenues have an increasing trend.Therefore,linear,exponential,quadratic and cubic models were used to fit the trend,and the following relevant information became available after applying linear regression. Refer to Exhibit 18.3.What is a revenue forecast for 2012 found by the polynomial trend equation with the best fit?
A)About 2 billion and 149 million dollars
B)About 2 billion and 189 million dollars
C)About 2 billion and 334 million dollars
D)About 2 billion and 34 million dollars
Excel scatterplot shown above indicates that the annual revenues have an increasing trend.Therefore,linear,exponential,quadratic and cubic models were used to fit the trend,and the following relevant information became available after applying linear regression. Refer to Exhibit 18.3.What is a revenue forecast for 2012 found by the polynomial trend equation with the best fit?A)About 2 billion and 149 million dollars
B)About 2 billion and 189 million dollars
C)About 2 billion and 334 million dollars
D)About 2 billion and 34 million dollars
Unlock Deck
Unlock for access to all 103 flashcards in this deck.
Unlock Deck
k this deck
74
When a time series is analyzed by the model ,which of the following is valid?
A)Setting the estimated value of Tt and St at 1.
B)Setting the estimated value of Tt at 1.
C)Setting the estimated value of It at 1.
D)Setting the estimated value of St at 1.
,which of the following is valid?A)Setting the estimated value of Tt and St at 1.
B)Setting the estimated value of Tt at 1.
C)Setting the estimated value of It at 1.
D)Setting the estimated value of St at 1.
Unlock Deck
Unlock for access to all 103 flashcards in this deck.
Unlock Deck
k this deck
75
If the model is applied,which of the following indicates no seasonality?
A)The sum of the adjusted seasonal indices equals the number of seasons.
B)The average of the adjusted seasonal indices equals 1.
C)Every adjusted seasonal index is practically 1.
D)The product of the adjusted seasonal indices equals 1.
is applied,which of the following indicates no seasonality?A)The sum of the adjusted seasonal indices equals the number of seasons.
B)The average of the adjusted seasonal indices equals 1.
C)Every adjusted seasonal index is practically 1.
D)The product of the adjusted seasonal indices equals 1.
Unlock Deck
Unlock for access to all 103 flashcards in this deck.
Unlock Deck
k this deck
76
If the regression framework is used to describe monthly seasonal data,how many dummy variables are needed?
A)13
B)12
C)11
D)10
A)13
B)12
C)11
D)10
Unlock Deck
Unlock for access to all 103 flashcards in this deck.
Unlock Deck
k this deck
77
Which of the following is not true of seasonal dummy variables?
A)Their values are either 0 or 1.
B)Their number should be one less than the number of seasons.
C)They are used to describe the seasonality in quarterly,monthly etc.time series.
D)Their number should equal to the number of seasons.
A)Their values are either 0 or 1.
B)Their number should be one less than the number of seasons.
C)They are used to describe the seasonality in quarterly,monthly etc.time series.
D)Their number should equal to the number of seasons.
Unlock Deck
Unlock for access to all 103 flashcards in this deck.
Unlock Deck
k this deck
78
In the decomposition method,which of the following time series is used to estimate the trend?
A)
B)
C)
D)
A)
B)
C)
D)
Unlock Deck
Unlock for access to all 103 flashcards in this deck.
Unlock Deck
k this deck
79
In the decomposition method,which of the following time series is used to estimate the trend?
A)
B)
C)
D)
A)
B)
C)
D)
Unlock Deck
Unlock for access to all 103 flashcards in this deck.
Unlock Deck
k this deck
80
Exhibit 18.3.The following table shows the annual revenues (in millions of dollars)of a pharmaceutical company over the period 1990-2011. Excel scatterplot shown above indicates that the annual revenues have an increasing trend.Therefore,linear,exponential,quadratic and cubic models were used to fit the trend,and the following relevant information became available after applying linear regression. Refer to Exhibit 18.3.When all four trend regression equations are compared,which of them provides the best fit?
A)linear
B)exponential
C)quadratic
D)cubic
Excel scatterplot shown above indicates that the annual revenues have an increasing trend.Therefore,linear,exponential,quadratic and cubic models were used to fit the trend,and the following relevant information became available after applying linear regression. Refer to Exhibit 18.3.When all four trend regression equations are compared,which of them provides the best fit?A)linear
B)exponential
C)quadratic
D)cubic
Unlock Deck
Unlock for access to all 103 flashcards in this deck.
Unlock Deck
k this deck
Unlock Deck
Unlock for access to all 103 flashcards in this deck.


