Exam 18: Time Series and Forecasting
Exam 1: Statistics and Data68 Questions
Exam 2: Tabular and Graphical Methods99 Questions
Exam 3: Numerical Descriptive Measures123 Questions
Exam 4: Basic Probability Concepts107 Questions
Exam 5: Discrete Probability Distributions118 Questions
Exam 6: Continuous Probability Distributions114 Questions
Exam 7: Sampling and Sampling Distributions110 Questions
Exam 8: Interval Estimation111 Questions
Exam 9: Hypothesis Testing111 Questions
Exam 10: Statistical Inference Concerning Two Populations104 Questions
Exam 11: Statistical Inference Concerning Variance96 Questions
Exam 12: Chi-Square Tests100 Questions
Exam 13: Analysis of Variance89 Questions
Exam 14: Regression Analysis116 Questions
Exam 15: Inference With Regression Models117 Questions
Exam 16: Regression Models for Nonlinear Relationships95 Questions
Exam 17: Regression Models With Dummy Variables117 Questions
Exam 18: Time Series and Forecasting103 Questions
Exam 19: Returns, Index Numbers and Inflation98 Questions
Exam 20: Nonparametric Tests99 Questions
Select questions type
Exhibit 18.2.The following table includes the information about a monthly time series.  Refer to Exhibit 18.2.When the exponential smoothing method with α = 0.1 and α = 0.5 is applied,what is the speed of decline for which the mean absolute deviation (MAD)is better? What is this mean?
Free
(Multiple Choice)
4.9/5  (28)
(28)
Correct Answer: Verified
C
Exhibit 18.4.The following ratio-to-moving averages for the seasonally adjusted series were found by the decomposition method applied on a time series representing quarterly sales for the last four years: 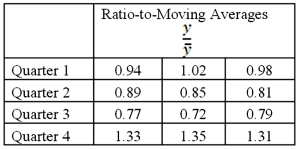 Refer to Exhibit 18.4.What is the seasonal index for the fourth quarter?
Free
(Multiple Choice)
4.8/5 (35)
Correct Answer:Verified
B
The exponential trend model is attractive when the increase in the series gets larger over time.
Free
(True/False)
4.9/5 (38)
Correct Answer:Verified
True
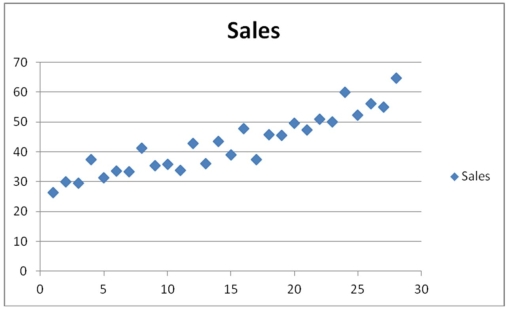
Exhibit 18.8.Quarterly sales of a department store for the last 7 years are given in the following table. 
 The Excel scatterplot shown above indicates that the quarterly sales have an increasing trend and seasonality.Therefore,the linear regression model,Sales = β0 + β1Qtr1 + β2Qtr2 + β3Qtr3 + β4t + ε with three seasonal dummy variables Qtr1,Qtr2 and Qtr3,and the decomposition method are proposed to make sales forecasts.For the regression model,the following Excel partial output is available.
 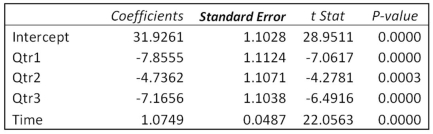 Refer to Exhibit 18.8.Using the regression equation for the linear trend model with seasonal dummy variables,what is the sales forecast for the fourth quarter of Year 8?
(Short Answer)
4.7/5 (31)
When the forecasting method of seasonal dummy variables is applied on a quarterly time series,four dummy variables are needed.
(True/False)
4.8/5 (36)
Exhibit 18.8.Quarterly sales of a department store for the last 7 years are given in the following table. 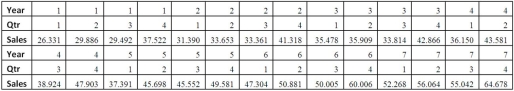
 The Excel scatterplot shown above indicates that the quarterly sales have an increasing trend and seasonality.Therefore,the linear regression model,Sales = β0 + β1Qtr1 + β2Qtr2 + β3Qtr3 + β4t + ε with three seasonal dummy variables Qtr1,Qtr2 and Qtr3,and the decomposition method are proposed to make sales forecasts.For the regression model,the following Excel partial output is available.
  Refer to Exhibit 18.8.(Use Excel or statistical software. )Using the decomposition method,
A)compute the adjusted seasonal indices for the four quarters.
B)find the linear trend equation for the seasonally adjusted quarterly sales.
C)make the sales forecasts for the first and fourth quarter of Year 8.
Refer to Exhibit 18.8.(Use Excel or statistical software. )Using the decomposition method,
A)compute the adjusted seasonal indices for the four quarters.
B)find the linear trend equation for the seasonally adjusted quarterly sales.
C)make the sales forecasts for the first and fourth quarter of Year 8.
(Essay)
4.8/5 (32)
Which model is considered for a quarterly time series that seems to change on average by a fixed amount and seems to have seasonality?
(Multiple Choice)
4.8/5 (41)
Which model is assumed for a quarterly time series that seems to grow on average by an increasing amount (or decline by a decreasing amount)and seems to have seasonality?
(Multiple Choice)
4.8/5 (31)
When the decomposition model, 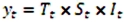 ,is applied,forecasts are made as
  ,where
  represents the estimated trend for seasonally adjusted time series for period t,and
  is the seasonal index for period t.
(True/False)
4.8/5 (41)
Exhibit 18.8.Quarterly sales of a department store for the last 7 years are given in the following table. 
 The Excel scatterplot shown above indicates that the quarterly sales have an increasing trend and seasonality.Therefore,the linear regression model,Sales = β0 + β1Qtr1 + β2Qtr2 + β3Qtr3 + β4t + ε with three seasonal dummy variables Qtr1,Qtr2 and Qtr3,and the decomposition method are proposed to make sales forecasts.For the regression model,the following Excel partial output is available.
  Refer to Exhibit 18.8.Using the regression equation for the linear trend model with seasonal dummy variables,what is the sales forecast for the first quarter of Year 8?
(Short Answer)
4.8/5 (32)
Which of the following is not true of a time series with a cyclical component?
(Multiple Choice)
4.8/5 (36)
Exhibit 18.2.The following table includes the information about a monthly time series. 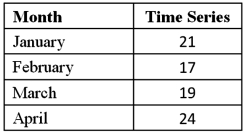 Refer to Exhibit 18.2.When the exponential smoothing method with α = 0.1 and α = 0.5 is applied,what is the speed of decline for which the mean square error (MSE)is better? What is this mean?
(Multiple Choice)
4.9/5 (35)
Exhibit 18.8.Quarterly sales of a department store for the last 7 years are given in the following table. 
 The Excel scatterplot shown above indicates that the quarterly sales have an increasing trend and seasonality.Therefore,the linear regression model,Sales = β0 + β1Qtr1 + β2Qtr2 + β3Qtr3 + β4t + ε with three seasonal dummy variables Qtr1,Qtr2 and Qtr3,and the decomposition method are proposed to make sales forecasts.For the regression model,the following Excel partial output is available.
  Refer to Exhibit 18.8.What is the regression equation for the linear trend model with seasonal dummy variables?
(Short Answer)
4.8/5 (32)
Exhibit 18.3.The following table shows the annual revenues (in millions of dollars)of a pharmaceutical company over the period 1990-2011. 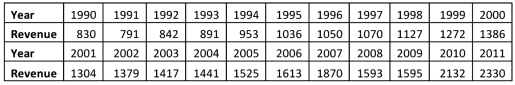
 Excel scatterplot shown above indicates that the annual revenues have an increasing trend.Therefore,linear,exponential,quadratic and cubic models were used to fit the trend,and the following relevant information became available after applying linear regression.
  Refer to Exhibit 18.3.Using the linear trend equation,one can say that the predicted revenue increases by
(Multiple Choice)
4.7/5 (34)
Quantitative forecasting procedures are based on the judgment of the forecaster,who uses prior experience and expertise to make forecasts.
(True/False)
4.8/5 (27)
Which of the following types of trend models will best suit a series where the increase in value of the series gets larger over time?
(Multiple Choice)
4.9/5 (31)
Exhibit 18.8.Quarterly sales of a department store for the last 7 years are given in the following table. 
 The Excel scatterplot shown above indicates that the quarterly sales have an increasing trend and seasonality.Therefore,the linear regression model,Sales = β0 + β1Qtr1 + β2Qtr2 + β3Qtr3 + β4t + ε with three seasonal dummy variables Qtr1,Qtr2 and Qtr3,and the decomposition method are proposed to make sales forecasts.For the regression model,the following Excel partial output is available.
  Refer to Exhibit 18.8.(Use Excel. )Using MSE and MAD,compare the linear trend equation with seasonal dummy variables,
  ,
and the decomposition method equation,
,
and the decomposition method equation, 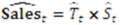 with
with 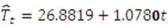 and the quarterly seasonal indices: 0.9322,1.0066,0.9441,and 1.1171.Which of the two corresponding forecasting models is recommended?
(Essay)
4.8/5 (34)
In the time series decomposition method,to obtain the _______,we divide the original observations by their corresponding adjusted seasonal indices.
(Multiple Choice)
4.9/5 (34)
Exhibit 18.3.The following table shows the annual revenues (in millions of dollars)of a pharmaceutical company over the period 1990-2011. 
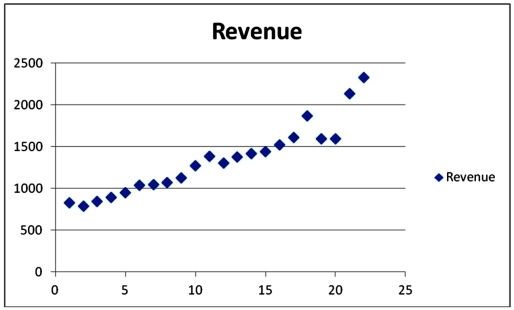 Excel scatterplot shown above indicates that the annual revenues have an increasing trend.Therefore,linear,exponential,quadratic and cubic models were used to fit the trend,and the following relevant information became available after applying linear regression.
 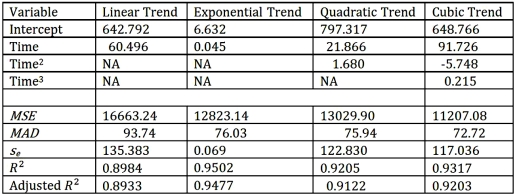 Refer to Exhibit 18.3.What is an exponential trend equation?
(Multiple Choice)
4.8/5 (30)
Which of the following is a criticism made of qualitative forecasts?
(Multiple Choice)
4.8/5 (35)
Filters
- Essay(0)
- Multiple Choice(0)
- Short Answer(0)
- True False(0)
- Matching(0)