Deck 15: Inference With Regression Models
Full screen (f)
Question
Question
Question
Question
A simple linear regression, ,is estimated using time-series data over the last 10 years.The residuals e,and the time variable t are shown in the accompanying table.
  a.Graph the residuals e against time and look for any discernible pattern.
b.Which assumption is being violated? Discuss its consequences and suggest a possible remedy.
,is estimated using time-series data over the last 10 years.The residuals e,and the time variable t are shown in the accompanying table. a.Graph the residuals e against time and look for any discernible pattern.b.Which assumption is being violated? Discuss its consequences and suggest a possible remedy.
Question
Question
Question
Question
Question
Question
Question
Question
Question
A simple linear regression, ,is estimated using cross-sectional data from 10 firms.The resulting residuals e,along with the values of the explanatory variable Advertising (x,in $100s),are shown in the accompanying table.
  a.Graph the residuals e against Advertising (x)and look for any discernible pattern.
b.Which assumption is being violated? Discuss its consequences and suggest a possible remedy.
,is estimated using cross-sectional data from 10 firms.The resulting residuals e,along with the values of the explanatory variable Advertising (x,in $100s),are shown in the accompanying table. a.Graph the residuals e against Advertising (x)and look for any discernible pattern.b.Which assumption is being violated? Discuss its consequences and suggest a possible remedy.
Question
Question
Question
Question
Question
Question
Question
Question
Question
Question
The accompanying table shows the regression results when estimating 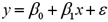 .When testing whether the slope coefficient differs from 1,the value of the test statistic is
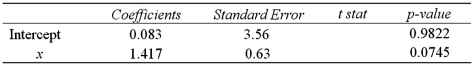
A)0.66
B)1.42
C)1.96
D)2.25
.When testing whether the slope coefficient differs from 1,the value of the test statistic is A)0.66
B)1.42
C)1.96
D)2.25
Question
Question
Given the following portion of regression results,which of the following conclusions is true with regard to the F test at the 5% significance level? 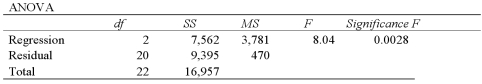
A)Neither of the explanatory variables is related to the response variable.
B)Both of the explanatory variables are related to the response variable.
C)Exactly one of the explanatory variables is related to the response variable.
D)At least one of the explanatory variables is significantly related to the response variable.
Question
Question
Question
Find the 95% confidence interval for the regression coefficient β1,if df = 30,b = -2 and ![<strong>Find the 95% confidence interval for the regression coefficient β<sub>1</sub>,if df = 30,b = -2 and .</strong> A)[-5.00,-1.00] B)[-7.88,3.88] C)[-7.09,3.09] D)[-8.13,4.13] <div style=padding-top: 35px>](https://storage.examlex.com/TB2339/11eaa4ae_7a7d_a26f_9180_65ce35888cdc_TB2339_11.jpg) .
.
A)[-5.00,-1.00]
B)[-7.88,3.88]
C)[-7.09,3.09]
D)[-8.13,4.13]
.A)[-5.00,-1.00]
B)[-7.88,3.88]
C)[-7.09,3.09]
D)[-8.13,4.13]
Question
Question
The accompanying table shows the regression results when estimating 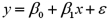 .Is x significantly related to y at the 5% significance level?
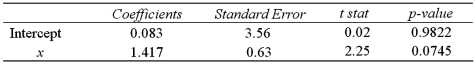
A)Yes,since the p-value of 0.0745 is greater than 0.05.
B)No,since the p-value of 0.0745 is greater than 0.05.
C)Yes,since the slope coefficient of 1.417 is less than the test statistic of 2.25.
D)No,since the slope coefficient of 1.417 is less than the test statistic of 2.25.
.Is x significantly related to y at the 5% significance level? A)Yes,since the p-value of 0.0745 is greater than 0.05.
B)No,since the p-value of 0.0745 is greater than 0.05.
C)Yes,since the slope coefficient of 1.417 is less than the test statistic of 2.25.
D)No,since the slope coefficient of 1.417 is less than the test statistic of 2.25.
Question
Consider the following simple linear regression model:  .When determining whether there is a positive linear relationship between x and y,the alternative hypothesis takes the form
A)
B)
C)
D)
.When determining whether there is a positive linear relationship between x and y,the alternative hypothesis takes the formA)
B)
C)
D)
Question
Consider the following simple linear regression model:  .When determining whether x significantly influences y,the null hypothesis takes the form
A)
B)
C)
D)
.When determining whether x significantly influences y,the null hypothesis takes the formA)
B)
C)
D)
Question
Question
Consider the following simple linear regression model:  .When determining whether there is a negative linear relationship between x and y,the alternative hypothesis takes the form
A)
B)
C)
D)
.When determining whether there is a negative linear relationship between x and y,the alternative hypothesis takes the formA)
B)
C)
D)
Question
Question
Consider the following simple linear regression model: 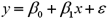 .When determining whether there is a one-to-one relationship between x and y,the null hypothesis takes the form
A)
B)
C)
D)
.When determining whether there is a one-to-one relationship between x and y,the null hypothesis takes the formA)
B)
C)
D)
Question
Given the following portion of regression results,what is the value of the  test statistic?
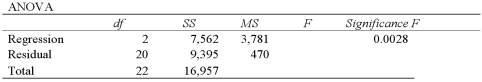
A)1.96
B)3.49
C)8.04
D)10
test statistic? A)1.96
B)3.49
C)8.04
D)10
Question
The accompanying table shows the regression results when estimating  .What is the value of the test statistic when testing whether x significantly influences y?
A)0.66
B)1.42
C)1.96
D)2.25
.What is the value of the test statistic when testing whether x significantly influences y? A)0.66
B)1.42
C)1.96
D)2.25
Question
Question
Question
Question
Question
Question
When estimating  ,you wish to test
  versus
  .The value of the test statistic is
  and its associated p-value is 0.0092.At the 1% significance level,the conclusion is to:
A)Reject the null hypothesis and conclude that the influence of x1 and x2 on y is the same.
B)Reject the null hypothesis and conclude that the influence of x1 and x2 on y is not the same.
C)Do not reject the null hypothesis and conclude that the influence of x1 and x2 on y is the same.
D)Do not reject the null hypothesis and conclude that the influence of x1 and x2 on y is not the same.
,you wish to test versus .The value of the test statistic is and its associated p-value is 0.0092.At the 1% significance level,the conclusion is to:A)Reject the null hypothesis and conclude that the influence of x1 and x2 on y is the same.
B)Reject the null hypothesis and conclude that the influence of x1 and x2 on y is not the same.
C)Do not reject the null hypothesis and conclude that the influence of x1 and x2 on y is the same.
D)Do not reject the null hypothesis and conclude that the influence of x1 and x2 on y is not the same.
Question
Question
Question
Question
A sample of 200 monthly observations is used to run a simple linear regression: Returns = β0 + β1 Leverage + ε.A five percent level of significance is used to study if leverage has a significant influence on returns.The value of the test statistic for the regression coefficient of Leverage is calculated as  ,with an associated p-value of 0.2770.The correct decision is to:
A)Reject the null hypothesis and conclude that leverage significantly explains returns.
B)Reject the null hypothesis and conclude that leverage does not significantly explain returns.
C)Do not reject the null hypothesis and conclude that leverage does not significantly explain returns.
D)Do not reject the null hypothesis and conclude that leverage significantly explains returns.
,with an associated p-value of 0.2770.The correct decision is to:A)Reject the null hypothesis and conclude that leverage significantly explains returns.
B)Reject the null hypothesis and conclude that leverage does not significantly explain returns.
C)Do not reject the null hypothesis and conclude that leverage does not significantly explain returns.
D)Do not reject the null hypothesis and conclude that leverage significantly explains returns.
Question
Question
Question
Question
Given the following portion of regression results,what is the value of the  test statistic?
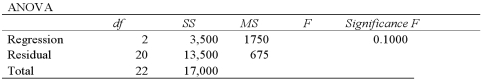
A)1.96
B)2.59
C)3.49
D)10
test statistic? A)1.96
B)2.59
C)3.49
D)10
Question
The accompanying table shows the regression results when estimating  .At the 5% significance level,which explanatory variable(s)is(are)individually significant?
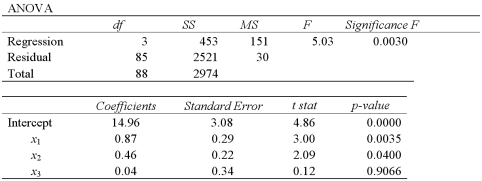
A)Only x1
B)Only x3
C)x1 and x2
D)x2 and x3
.At the 5% significance level,which explanatory variable(s)is(are)individually significant? A)Only x1
B)Only x3
C)x1 and x2
D)x2 and x3
Question
Given the following portion of regression results,which of the following conclusions is true with regard to the F test at the 5% significance level? 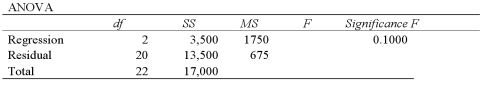
A)Neither of the explanatory variables is significantly related to the response variable.
B)Both of the explanatory variables are significantly related to the response variable.
C)Exactly one of the explanatory variables is significantly related to the response variable.
D)At least one of the explanatory variables is significantly related to the response variable.
Question
When testing r linear restrictions imposed on the model  ,the test statistic is assumed to follow the
  distribution with
A)df1 = k and df2 = n - k - 1.
B)df1 = k - 1 and df2 = n - k - 1.
C)df1 = r and df2 = n - k.
D)df1 = r and df2 = n - k - 1.
,the test statistic is assumed to follow the distribution withA)df1 = k and df2 = n - k - 1.
B)df1 = k - 1 and df2 = n - k - 1.
C)df1 = r and df2 = n - k.
D)df1 = r and df2 = n - k - 1.
Question
A researcher gathers data on 25 households and estimates the following model:  .A residual plot of the estimated model is shown in the accompanying graph.What can be inferred from the residual plot?
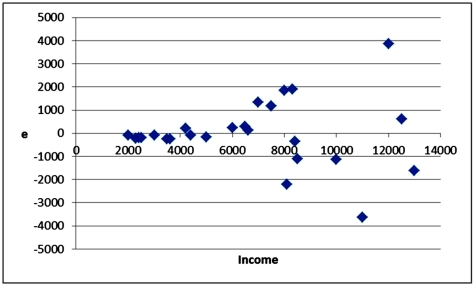
A)The residuals have little variation.
B)The residuals do not exhibit any pattern.
C)The residuals seem to fan out across the horizontal axis.
D)The residuals are evenly distributed across the horizontal axis.
.A residual plot of the estimated model is shown in the accompanying graph.What can be inferred from the residual plot? A)The residuals have little variation.
B)The residuals do not exhibit any pattern.
C)The residuals seem to fan out across the horizontal axis.
D)The residuals are evenly distributed across the horizontal axis.
Question
Question
When estimating  ,you wish to test
  versus
  .The value of the test statistic is
  and its associated p-value is 0.1073.At the 5% significance level,the conclusion is to:
A)Reject the null hypothesis and conclude that x1 and x2 are jointly significant.
B)Reject the null hypothesis and conclude that x1 and x2 are not jointly significant.
C)Do not reject the null hypothesis and conclude that x1 and x2 are jointly significant.
D)Do not reject the null hypothesis and conclude that x1 and x2 are not jointly significant.
,you wish to test versus .The value of the test statistic is and its associated p-value is 0.1073.At the 5% significance level,the conclusion is to:A)Reject the null hypothesis and conclude that x1 and x2 are jointly significant.
B)Reject the null hypothesis and conclude that x1 and x2 are not jointly significant.
C)Do not reject the null hypothesis and conclude that x1 and x2 are jointly significant.
D)Do not reject the null hypothesis and conclude that x1 and x2 are not jointly significant.
Question
Refer to the portion of regression results in the accompanying table.When testing the overall significance of the regression model at the 5% level given a critical value of 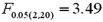 ,the decision is to:
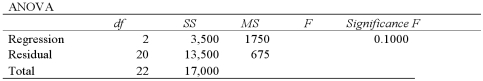
A)Reject H0 and conclude that the explanatory variables are jointly significant.
B)Do not reject H0 and conclude that the explanatory variables are jointly significant.
C)Reject H0 and conclude that the explanatory variables are not jointly significant.
D)Do not reject H0 and conclude that the explanatory variables are not jointly significant.
,the decision is to: A)Reject H0 and conclude that the explanatory variables are jointly significant.
B)Do not reject H0 and conclude that the explanatory variables are jointly significant.
C)Reject H0 and conclude that the explanatory variables are not jointly significant.
D)Do not reject H0 and conclude that the explanatory variables are not jointly significant.
Question
Refer to the portion of regression results in the accompanying table.When testing the overall significance of the regression model at the 5% level given a critical value of  ,the decision is to:
A)Reject H0 and conclude that the explanatory variables are jointly significant.
B)Do not reject H0 and conclude that the explanatory variables are jointly significant.
C)Reject H0 and conclude that the explanatory variables are not jointly significant.
D)Do not reject H0 and conclude that the explanatory variables are not jointly significant.
,the decision is to: A)Reject H0 and conclude that the explanatory variables are jointly significant.
B)Do not reject H0 and conclude that the explanatory variables are jointly significant.
C)Reject H0 and conclude that the explanatory variables are not jointly significant.
D)Do not reject H0 and conclude that the explanatory variables are not jointly significant.
Question
Exhibit 15-6.Tiffany & Co.has been the world's premier jeweler since 1837.The performance of Tiffany's stock is likely to be strongly influenced by the economy.Monthly data for Tiffany's risk-adjusted return and the risk-adjusted market return are collected for a five-year period (n = 60).The accompanying table shows the regression results when estimating the CAPM model for Tiffany's return.  Refer to Exhibit 15-6.You would like to determine whether an investment in Tiffany's is riskier than the market.When conducting this test,you set up the following competing hypotheses:
A)
B)
C)
D)
Refer to Exhibit 15-6.You would like to determine whether an investment in Tiffany's is riskier than the market.When conducting this test,you set up the following competing hypotheses:A)
B)
C)
D)
Question
Exhibit 15-5.The accompanying table shows the regression results when estimating  .
. 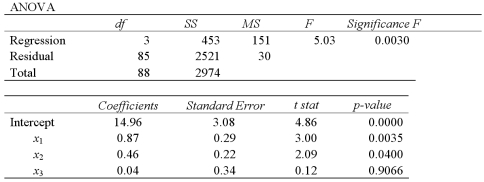 Refer to Exhibit 15-5.At the 5% significance level,which explanatory variable(s)is(are)individually significant?
A)Only x1
B)Only x3
C)x1 and x2
D)x2 and x3
. Refer to Exhibit 15-5.At the 5% significance level,which explanatory variable(s)is(are)individually significant?A)Only x1
B)Only x3
C)x1 and x2
D)x2 and x3
Question
Exhibit 15-6.Tiffany & Co.has been the world's premier jeweler since 1837.The performance of Tiffany's stock is likely to be strongly influenced by the economy.Monthly data for Tiffany's risk-adjusted return and the risk-adjusted market return are collected for a five-year period (n = 60).The accompanying table shows the regression results when estimating the CAPM model for Tiffany's return. 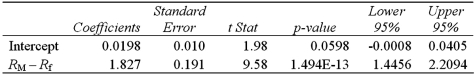 Refer to Exhibit 15-6.When testing whether the beta coefficient is significantly greater than one,the relevant critical value at the 5% significance level is
  .The conclusion to the test is:
A)Reject H0,and conclude that the return on Tiffany stock is riskier than the return on the market.
B)Do not reject H0,and conclude that the return on Tiffany stock is riskier than the return on the market.
C)Reject H0,and conclude that the return on Tiffany stock is less risky than the return on the market.
D)Do not reject H0,and conclude that the return on Tiffany stock is less risky than the return on the market.
Refer to Exhibit 15-6.When testing whether the beta coefficient is significantly greater than one,the relevant critical value at the 5% significance level is .The conclusion to the test is:A)Reject H0,and conclude that the return on Tiffany stock is riskier than the return on the market.
B)Do not reject H0,and conclude that the return on Tiffany stock is riskier than the return on the market.
C)Reject H0,and conclude that the return on Tiffany stock is less risky than the return on the market.
D)Do not reject H0,and conclude that the return on Tiffany stock is less risky than the return on the market.
Question
Exhibit 15-4.A researcher analyzes the factors that may influence amusement park attendance and estimates the following model: ![<strong>Exhibit 15-4.A researcher analyzes the factors that may influence amusement park attendance and estimates the following model: , where Attendance is the daily attendance (in 1000s),Price is the gate price (in $),and Rides is the number of rides at the amusement park.The researcher would like to construct interval estimates for Attendance when Price and Rides equal $85 and 30,respectively.The researcher estimates a modified model where Attendance is the response variable and the explanatory variables are now defined as and .A portion of the regression results is shown in the accompanying table. Refer to Exhibit 15-4.According to the modified model,what is a 95% prediction interval for Attendance when Price and Rides equal $85 and 30,respectively? (Note that . )</strong> A)[12,740,56,080] B)[16,330,53,450] C)[26,080,42,740] D)[28,900,41,500] <div style=padding-top: 35px>](https://storage.examlex.com/TB2339/11eaa4ae_7a83_6f1d_9180_6d736935b332_TB2339_00.jpg) , where Attendance is the daily attendance (in 1000s),Price is the gate price (in $),and Rides is the number of rides at the amusement park.The researcher would like to construct interval estimates for Attendance when Price and Rides equal $85 and 30,respectively.The researcher estimates a modified model where Attendance is the response variable and the explanatory variables are now defined as
, where Attendance is the daily attendance (in 1000s),Price is the gate price (in $),and Rides is the number of rides at the amusement park.The researcher would like to construct interval estimates for Attendance when Price and Rides equal $85 and 30,respectively.The researcher estimates a modified model where Attendance is the response variable and the explanatory variables are now defined as ![<strong>Exhibit 15-4.A researcher analyzes the factors that may influence amusement park attendance and estimates the following model: , where Attendance is the daily attendance (in 1000s),Price is the gate price (in $),and Rides is the number of rides at the amusement park.The researcher would like to construct interval estimates for Attendance when Price and Rides equal $85 and 30,respectively.The researcher estimates a modified model where Attendance is the response variable and the explanatory variables are now defined as and .A portion of the regression results is shown in the accompanying table. Refer to Exhibit 15-4.According to the modified model,what is a 95% prediction interval for Attendance when Price and Rides equal $85 and 30,respectively? (Note that . )</strong> A)[12,740,56,080] B)[16,330,53,450] C)[26,080,42,740] D)[28,900,41,500] <div style=padding-top: 35px>](https://storage.examlex.com/TB2339/11eaa4ae_7a83_6f1e_9180_558526ae03a5_TB2339_11.jpg) and
and ![<strong>Exhibit 15-4.A researcher analyzes the factors that may influence amusement park attendance and estimates the following model: , where Attendance is the daily attendance (in 1000s),Price is the gate price (in $),and Rides is the number of rides at the amusement park.The researcher would like to construct interval estimates for Attendance when Price and Rides equal $85 and 30,respectively.The researcher estimates a modified model where Attendance is the response variable and the explanatory variables are now defined as and .A portion of the regression results is shown in the accompanying table. Refer to Exhibit 15-4.According to the modified model,what is a 95% prediction interval for Attendance when Price and Rides equal $85 and 30,respectively? (Note that . )</strong> A)[12,740,56,080] B)[16,330,53,450] C)[26,080,42,740] D)[28,900,41,500] <div style=padding-top: 35px>](https://storage.examlex.com/TB2339/11eaa4ae_7a83_6f1f_9180_adc1765d094a_TB2339_11.jpg) .A portion of the regression results is shown in the accompanying table.
.A portion of the regression results is shown in the accompanying table. ![<strong>Exhibit 15-4.A researcher analyzes the factors that may influence amusement park attendance and estimates the following model: , where Attendance is the daily attendance (in 1000s),Price is the gate price (in $),and Rides is the number of rides at the amusement park.The researcher would like to construct interval estimates for Attendance when Price and Rides equal $85 and 30,respectively.The researcher estimates a modified model where Attendance is the response variable and the explanatory variables are now defined as and .A portion of the regression results is shown in the accompanying table. Refer to Exhibit 15-4.According to the modified model,what is a 95% prediction interval for Attendance when Price and Rides equal $85 and 30,respectively? (Note that . )</strong> A)[12,740,56,080] B)[16,330,53,450] C)[26,080,42,740] D)[28,900,41,500] <div style=padding-top: 35px>](https://storage.examlex.com/TB2339/11eaa4ae_7a83_9630_9180_033440828626_TB2339_00.jpg) Refer to Exhibit 15-4.According to the modified model,what is a 95% prediction interval for Attendance when Price and Rides equal $85 and 30,respectively? (Note that
Refer to Exhibit 15-4.According to the modified model,what is a 95% prediction interval for Attendance when Price and Rides equal $85 and 30,respectively? (Note that ![<strong>Exhibit 15-4.A researcher analyzes the factors that may influence amusement park attendance and estimates the following model: , where Attendance is the daily attendance (in 1000s),Price is the gate price (in $),and Rides is the number of rides at the amusement park.The researcher would like to construct interval estimates for Attendance when Price and Rides equal $85 and 30,respectively.The researcher estimates a modified model where Attendance is the response variable and the explanatory variables are now defined as and .A portion of the regression results is shown in the accompanying table. Refer to Exhibit 15-4.According to the modified model,what is a 95% prediction interval for Attendance when Price and Rides equal $85 and 30,respectively? (Note that . )</strong> A)[12,740,56,080] B)[16,330,53,450] C)[26,080,42,740] D)[28,900,41,500] <div style=padding-top: 35px>](https://storage.examlex.com/TB2339/11eaa4ae_7a83_9631_9180_2da084c488c9_TB2339_11.jpg) . )
. )
A)[12,740,56,080]
B)[16,330,53,450]
C)[26,080,42,740]
D)[28,900,41,500]
, where Attendance is the daily attendance (in 1000s),Price is the gate price (in $),and Rides is the number of rides at the amusement park.The researcher would like to construct interval estimates for Attendance when Price and Rides equal $85 and 30,respectively.The researcher estimates a modified model where Attendance is the response variable and the explanatory variables are now defined as and .A portion of the regression results is shown in the accompanying table. Refer to Exhibit 15-4.According to the modified model,what is a 95% prediction interval for Attendance when Price and Rides equal $85 and 30,respectively? (Note that . )A)[12,740,56,080]
B)[16,330,53,450]
C)[26,080,42,740]
D)[28,900,41,500]
Question
Exhibit 15-5.The accompanying table shows the regression results when estimating  .
.  Refer to Exhibit 15-5.When testing whether or not x1 and x2 are jointly significant,the null hypothesis is
A)
B)
C)
D)
. Refer to Exhibit 15-5.When testing whether or not x1 and x2 are jointly significant,the null hypothesis isA)
B)
C)
D)
Question
Exhibit 15-5.The accompanying table shows the regression results when estimating  .
.  Refer to Exhibit 15-5.When testing whether or not x1 and x2 have the same influence on y,the null hypothesis is
A)
B)
C)
D)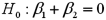
. Refer to Exhibit 15-5.When testing whether or not x1 and x2 have the same influence on y,the null hypothesis isA)
B)
C)
D)
Question
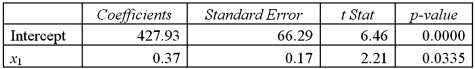
Exhibit 15-1.An marketing analyst wants to examine the relationship between sales (in $1,000s)and advertising (in $100s)for firms in the food and beverage industry and so collects monthly data for 25 firms.He estimates the model  .The following table shows a portion of the regression results.
  Refer to Exhibit 15-1.When testing whether the slope coefficient differs from 3,the critical values at the 5% significance level are -2.069 and 2.069.The conclusion to the test is to
A)Reject H0;the slope coefficient differs from 3.
B)Not reject H0;the slope coefficient differs from 3.
C)Reject H0;the slope coefficient does not differ from 3.
D)Not reject H0;the slope coefficient does not differ from 3.
.The following table shows a portion of the regression results. Refer to Exhibit 15-1.When testing whether the slope coefficient differs from 3,the critical values at the 5% significance level are -2.069 and 2.069.The conclusion to the test is toA)Reject H0;the slope coefficient differs from 3.
B)Not reject H0;the slope coefficient differs from 3.
C)Reject H0;the slope coefficient does not differ from 3.
D)Not reject H0;the slope coefficient does not differ from 3.
Question
Exhibit 15-4.A researcher analyzes the factors that may influence amusement park attendance and estimates the following model:  , where Attendance is the daily attendance (in 1000s),Price is the gate price (in $),and Rides is the number of rides at the amusement park.The researcher would like to construct interval estimates for Attendance when Price and Rides equal $85 and 30,respectively.The researcher estimates a modified model where Attendance is the response variable and the explanatory variables are now defined as
 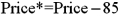 and
and 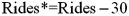 .A portion of the regression results is shown in the accompanying table.
 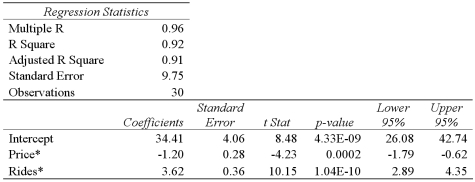 Refer to Exhibit 15-4.According to the modified model,what is the predicted value for Attendance when Price and Rides equal $85 and 30,respectively.
A)25,670
B)34,410
C)40,910
D)55,600
, where Attendance is the daily attendance (in 1000s),Price is the gate price (in $),and Rides is the number of rides at the amusement park.The researcher would like to construct interval estimates for Attendance when Price and Rides equal $85 and 30,respectively.The researcher estimates a modified model where Attendance is the response variable and the explanatory variables are now defined as and .A portion of the regression results is shown in the accompanying table. Refer to Exhibit 15-4.According to the modified model,what is the predicted value for Attendance when Price and Rides equal $85 and 30,respectively.A)25,670
B)34,410
C)40,910
D)55,600
Question
Exhibit 15-2.A sports analyst wants to exam the factors that may influence a tennis player's chances of winning.Over four tournaments,he collects data on 30 tennis players and estimates the following model:  , where Win is the proportion of winning,Double Faults is the percentage of double faults made,and Aces is the number of Aces.A portion of the regression results are shown in the accompanying table.
  Refer to Exhibit 15-2.When testing whether the explanatory variables are jointly significant at the 5% level,he
A)Rejects H0,and concludes that the explanatory variables are jointly significant.
B)Does not reject H0,and concludes that the explanatory variables are jointly significant.
C)Rejects H0,and concludes that the explanatory variables are not jointly significant.
D)Does not reject H0,and concludes that the explanatory variables are not jointly significant.
, where Win is the proportion of winning,Double Faults is the percentage of double faults made,and Aces is the number of Aces.A portion of the regression results are shown in the accompanying table. Refer to Exhibit 15-2.When testing whether the explanatory variables are jointly significant at the 5% level,heA)Rejects H0,and concludes that the explanatory variables are jointly significant.
B)Does not reject H0,and concludes that the explanatory variables are jointly significant.
C)Rejects H0,and concludes that the explanatory variables are not jointly significant.
D)Does not reject H0,and concludes that the explanatory variables are not jointly significant.
Question
Exhibit 15-1.An marketing analyst wants to examine the relationship between sales (in $1,000s)and advertising (in $100s)for firms in the food and beverage industry and so collects monthly data for 25 firms.He estimates the model  .The following table shows a portion of the regression results.
  Refer to Exhibit 15-1.Specify the competing hypotheses in order to test whether the slope coefficient differs from 3.
A)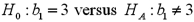
B)
C)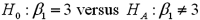
D)
.The following table shows a portion of the regression results. Refer to Exhibit 15-1.Specify the competing hypotheses in order to test whether the slope coefficient differs from 3.A)
B)
C)
D)
Question
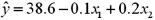
Exhibit 15-2.A sports analyst wants to exam the factors that may influence a tennis player's chances of winning.Over four tournaments,he collects data on 30 tennis players and estimates the following model: ![<strong>Exhibit 15-2.A sports analyst wants to exam the factors that may influence a tennis player's chances of winning.Over four tournaments,he collects data on 30 tennis players and estimates the following model: , where Win is the proportion of winning,Double Faults is the percentage of double faults made,and Aces is the number of Aces.A portion of the regression results are shown in the accompanying table. Refer to Exhibit 15-2.Excel shows that the 95% confidence interval for β<sub>1</sub> is [-0.12,-0.002].When determining whether or not Double Faults is significant at the 5% significance level,he</strong> A)Rejects ,and concludes that Double Faults is significant. B)Does not reject ,and concludes that Double Faults is significant. C)Rejects ,and concludes that Double Faults is not significant. D)Does not reject <div style=padding-top: 35px>](https://storage.examlex.com/TB2339/11eaa4ae_7a81_e867_9180_eb104780023c_TB2339_00.jpg) , where Win is the proportion of winning,Double Faults is the percentage of double faults made,and Aces is the number of Aces.A portion of the regression results are shown in the accompanying table.
, where Win is the proportion of winning,Double Faults is the percentage of double faults made,and Aces is the number of Aces.A portion of the regression results are shown in the accompanying table. ![<strong>Exhibit 15-2.A sports analyst wants to exam the factors that may influence a tennis player's chances of winning.Over four tournaments,he collects data on 30 tennis players and estimates the following model: , where Win is the proportion of winning,Double Faults is the percentage of double faults made,and Aces is the number of Aces.A portion of the regression results are shown in the accompanying table. Refer to Exhibit 15-2.Excel shows that the 95% confidence interval for β<sub>1</sub> is [-0.12,-0.002].When determining whether or not Double Faults is significant at the 5% significance level,he</strong> A)Rejects ,and concludes that Double Faults is significant. B)Does not reject ,and concludes that Double Faults is significant. C)Rejects ,and concludes that Double Faults is not significant. D)Does not reject <div style=padding-top: 35px>](https://storage.examlex.com/TB2339/11eaa4ae_7a82_0f78_9180_45b91d73b619_TB2339_00.jpg) Refer to Exhibit 15-2.Excel shows that the 95% confidence interval for β1 is [-0.12,-0.002].When determining whether or not Double Faults is significant at the 5% significance level,he
Refer to Exhibit 15-2.Excel shows that the 95% confidence interval for β1 is [-0.12,-0.002].When determining whether or not Double Faults is significant at the 5% significance level,he
A)Rejects![<strong>Exhibit 15-2.A sports analyst wants to exam the factors that may influence a tennis player's chances of winning.Over four tournaments,he collects data on 30 tennis players and estimates the following model: , where Win is the proportion of winning,Double Faults is the percentage of double faults made,and Aces is the number of Aces.A portion of the regression results are shown in the accompanying table. Refer to Exhibit 15-2.Excel shows that the 95% confidence interval for β<sub>1</sub> is [-0.12,-0.002].When determining whether or not Double Faults is significant at the 5% significance level,he</strong> A)Rejects ,and concludes that Double Faults is significant. B)Does not reject ,and concludes that Double Faults is significant. C)Rejects ,and concludes that Double Faults is not significant. D)Does not reject <div style=padding-top: 35px>](https://storage.examlex.com/TB2339/11eaa4ae_7a82_3689_9180_c53ebe0f490f_TB2339_11.jpg) ,and concludes that Double Faults is significant.
,and concludes that Double Faults is significant.
B)Does not reject![<strong>Exhibit 15-2.A sports analyst wants to exam the factors that may influence a tennis player's chances of winning.Over four tournaments,he collects data on 30 tennis players and estimates the following model: , where Win is the proportion of winning,Double Faults is the percentage of double faults made,and Aces is the number of Aces.A portion of the regression results are shown in the accompanying table. Refer to Exhibit 15-2.Excel shows that the 95% confidence interval for β<sub>1</sub> is [-0.12,-0.002].When determining whether or not Double Faults is significant at the 5% significance level,he</strong> A)Rejects ,and concludes that Double Faults is significant. B)Does not reject ,and concludes that Double Faults is significant. C)Rejects ,and concludes that Double Faults is not significant. D)Does not reject <div style=padding-top: 35px>](https://storage.examlex.com/TB2339/11eaa4ae_7a82_368a_9180_91d10517c263_TB2339_11.jpg) ,and concludes that Double Faults is significant.
,and concludes that Double Faults is significant.
C)Rejects![<strong>Exhibit 15-2.A sports analyst wants to exam the factors that may influence a tennis player's chances of winning.Over four tournaments,he collects data on 30 tennis players and estimates the following model: , where Win is the proportion of winning,Double Faults is the percentage of double faults made,and Aces is the number of Aces.A portion of the regression results are shown in the accompanying table. Refer to Exhibit 15-2.Excel shows that the 95% confidence interval for β<sub>1</sub> is [-0.12,-0.002].When determining whether or not Double Faults is significant at the 5% significance level,he</strong> A)Rejects ,and concludes that Double Faults is significant. B)Does not reject ,and concludes that Double Faults is significant. C)Rejects ,and concludes that Double Faults is not significant. D)Does not reject <div style=padding-top: 35px>](https://storage.examlex.com/TB2339/11eaa4ae_7a82_368b_9180_6f1adc75fddc_TB2339_11.jpg) ,and concludes that Double Faults is not significant.
,and concludes that Double Faults is not significant.
D)Does not reject
, where Win is the proportion of winning,Double Faults is the percentage of double faults made,and Aces is the number of Aces.A portion of the regression results are shown in the accompanying table. Refer to Exhibit 15-2.Excel shows that the 95% confidence interval for β1 is [-0.12,-0.002].When determining whether or not Double Faults is significant at the 5% significance level,heA)Rejects
,and concludes that Double Faults is significant.B)Does not reject
,and concludes that Double Faults is significant.C)Rejects
,and concludes that Double Faults is not significant.D)Does not reject
Question
Exhibit 15-1.An marketing analyst wants to examine the relationship between sales (in $1,000s)and advertising (in $100s)for firms in the food and beverage industry and so collects monthly data for 25 firms.He estimates the model 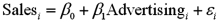 .The following table shows a portion of the regression results.
  Refer to Exhibit 15-1.Specify the competing hypotheses in order to test whether Advertising is significant in predicting Sales.
A)
B)
C)
D)
.The following table shows a portion of the regression results. Refer to Exhibit 15-1.Specify the competing hypotheses in order to test whether Advertising is significant in predicting Sales.A)
B)
C)
D)
Question
Exhibit 15-1.An marketing analyst wants to examine the relationship between sales (in $1,000s)and advertising (in $100s)for firms in the food and beverage industry and so collects monthly data for 25 firms.He estimates the model  .The following table shows a portion of the regression results.
  Refer to Exhibit 15-1.When testing whether the slope coefficient differs from 3,the value of the test statistic is:
A)
B)
C)
D)
.The following table shows a portion of the regression results. Refer to Exhibit 15-1.When testing whether the slope coefficient differs from 3,the value of the test statistic is:A)
B)
C)
D)
Question
Exhibit 15-4.A researcher analyzes the factors that may influence amusement park attendance and estimates the following model: ![<strong>Exhibit 15-4.A researcher analyzes the factors that may influence amusement park attendance and estimates the following model: , where Attendance is the daily attendance (in 1000s),Price is the gate price (in $),and Rides is the number of rides at the amusement park.The researcher would like to construct interval estimates for Attendance when Price and Rides equal $85 and 30,respectively.The researcher estimates a modified model where Attendance is the response variable and the explanatory variables are now defined as and .A portion of the regression results is shown in the accompanying table. Refer to Exhibit 15-4.According to the modified model,what is a 95% confidence interval for expected Attendance when Price and Rides equal $85 and 30,respectively? (Note that . )</strong> A)[12,740,56,780] B)[16,330,53,450] C)[26,080,42,740] D)[28,900,41,500] <div style=padding-top: 35px>](https://storage.examlex.com/TB2339/11eaa4ae_7a83_20f8_9180_651fb5300f2f_TB2339_11.jpg) , where Attendance is the daily attendance (in 1000s),Price is the gate price (in $),and Rides is the number of rides at the amusement park.The researcher would like to construct interval estimates for Attendance when Price and Rides equal $85 and 30,respectively.The researcher estimates a modified model where Attendance is the response variable and the explanatory variables are now defined as
, where Attendance is the daily attendance (in 1000s),Price is the gate price (in $),and Rides is the number of rides at the amusement park.The researcher would like to construct interval estimates for Attendance when Price and Rides equal $85 and 30,respectively.The researcher estimates a modified model where Attendance is the response variable and the explanatory variables are now defined as ![<strong>Exhibit 15-4.A researcher analyzes the factors that may influence amusement park attendance and estimates the following model: , where Attendance is the daily attendance (in 1000s),Price is the gate price (in $),and Rides is the number of rides at the amusement park.The researcher would like to construct interval estimates for Attendance when Price and Rides equal $85 and 30,respectively.The researcher estimates a modified model where Attendance is the response variable and the explanatory variables are now defined as and .A portion of the regression results is shown in the accompanying table. Refer to Exhibit 15-4.According to the modified model,what is a 95% confidence interval for expected Attendance when Price and Rides equal $85 and 30,respectively? (Note that . )</strong> A)[12,740,56,780] B)[16,330,53,450] C)[26,080,42,740] D)[28,900,41,500] <div style=padding-top: 35px>](https://storage.examlex.com/TB2339/11eaa4ae_7a83_20f9_9180_e12821042d56_TB2339_11.jpg) and
and ![<strong>Exhibit 15-4.A researcher analyzes the factors that may influence amusement park attendance and estimates the following model: , where Attendance is the daily attendance (in 1000s),Price is the gate price (in $),and Rides is the number of rides at the amusement park.The researcher would like to construct interval estimates for Attendance when Price and Rides equal $85 and 30,respectively.The researcher estimates a modified model where Attendance is the response variable and the explanatory variables are now defined as and .A portion of the regression results is shown in the accompanying table. Refer to Exhibit 15-4.According to the modified model,what is a 95% confidence interval for expected Attendance when Price and Rides equal $85 and 30,respectively? (Note that . )</strong> A)[12,740,56,780] B)[16,330,53,450] C)[26,080,42,740] D)[28,900,41,500] <div style=padding-top: 35px>](https://storage.examlex.com/TB2339/11eaa4ae_7a83_20fa_9180_cdd5abff9833_TB2339_11.jpg) .A portion of the regression results is shown in the accompanying table.
.A portion of the regression results is shown in the accompanying table. ![<strong>Exhibit 15-4.A researcher analyzes the factors that may influence amusement park attendance and estimates the following model: , where Attendance is the daily attendance (in 1000s),Price is the gate price (in $),and Rides is the number of rides at the amusement park.The researcher would like to construct interval estimates for Attendance when Price and Rides equal $85 and 30,respectively.The researcher estimates a modified model where Attendance is the response variable and the explanatory variables are now defined as and .A portion of the regression results is shown in the accompanying table. Refer to Exhibit 15-4.According to the modified model,what is a 95% confidence interval for expected Attendance when Price and Rides equal $85 and 30,respectively? (Note that . )</strong> A)[12,740,56,780] B)[16,330,53,450] C)[26,080,42,740] D)[28,900,41,500] <div style=padding-top: 35px>](https://storage.examlex.com/TB2339/11eaa4ae_7a83_480b_9180_9bbd9a065e2f_TB2339_00.jpg) Refer to Exhibit 15-4.According to the modified model,what is a 95% confidence interval for expected Attendance when Price and Rides equal $85 and 30,respectively? (Note that
Refer to Exhibit 15-4.According to the modified model,what is a 95% confidence interval for expected Attendance when Price and Rides equal $85 and 30,respectively? (Note that ![<strong>Exhibit 15-4.A researcher analyzes the factors that may influence amusement park attendance and estimates the following model: , where Attendance is the daily attendance (in 1000s),Price is the gate price (in $),and Rides is the number of rides at the amusement park.The researcher would like to construct interval estimates for Attendance when Price and Rides equal $85 and 30,respectively.The researcher estimates a modified model where Attendance is the response variable and the explanatory variables are now defined as and .A portion of the regression results is shown in the accompanying table. Refer to Exhibit 15-4.According to the modified model,what is a 95% confidence interval for expected Attendance when Price and Rides equal $85 and 30,respectively? (Note that . )</strong> A)[12,740,56,780] B)[16,330,53,450] C)[26,080,42,740] D)[28,900,41,500] <div style=padding-top: 35px>](https://storage.examlex.com/TB2339/11eaa4ae_7a83_480c_9180_4f26dc3ea3e6_TB2339_11.jpg) . )
. )
A)[12,740,56,780]
B)[16,330,53,450]
C)[26,080,42,740]
D)[28,900,41,500]
, where Attendance is the daily attendance (in 1000s),Price is the gate price (in $),and Rides is the number of rides at the amusement park.The researcher would like to construct interval estimates for Attendance when Price and Rides equal $85 and 30,respectively.The researcher estimates a modified model where Attendance is the response variable and the explanatory variables are now defined as and .A portion of the regression results is shown in the accompanying table. Refer to Exhibit 15-4.According to the modified model,what is a 95% confidence interval for expected Attendance when Price and Rides equal $85 and 30,respectively? (Note that . )A)[12,740,56,780]
B)[16,330,53,450]
C)[26,080,42,740]
D)[28,900,41,500]
Question
Exhibit 15-5.The accompanying table shows the regression results when estimating 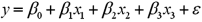 .
.  Refer to Exhibit 15-5.When testing whether the explanatory variables are jointly significant at the 5% level,the conclusion is to:
A)Reject H0,and conclude that the explanatory variables are jointly significant.
B)Not reject H0,and conclude that the explanatory variables are jointly significant.
C)Reject H0,and conclude that the explanatory variables are not jointly significant.
D)Not reject H0,and conclude that the explanatory variables are not jointly significant.
. Refer to Exhibit 15-5.When testing whether the explanatory variables are jointly significant at the 5% level,the conclusion is to:A)Reject H0,and conclude that the explanatory variables are jointly significant.
B)Not reject H0,and conclude that the explanatory variables are jointly significant.
C)Reject H0,and conclude that the explanatory variables are not jointly significant.
D)Not reject H0,and conclude that the explanatory variables are not jointly significant.
Question
Exhibit 15-6.Tiffany & Co.has been the world's premier jeweler since 1837.The performance of Tiffany's stock is likely to be strongly influenced by the economy.Monthly data for Tiffany's risk-adjusted return and the risk-adjusted market return are collected for a five-year period (n = 60).The accompanying table shows the regression results when estimating the CAPM model for Tiffany's return.  Refer to Exhibit 15-6.When testing whether the beta coefficient is significantly greater than one,the value of the test statistic is
A)-98.
B)1.98.
C)4.33.
D)9.58.
Refer to Exhibit 15-6.When testing whether the beta coefficient is significantly greater than one,the value of the test statistic isA)-98.
B)1.98.
C)4.33.
D)9.58.
Question
Exhibit 15-2.A sports analyst wants to exam the factors that may influence a tennis player's chances of winning.Over four tournaments,he collects data on 30 tennis players and estimates the following model:  , where Win is the proportion of winning,Double Faults is the percentage of double faults made,and Aces is the number of Aces.A portion of the regression results are shown in the accompanying table.
  Refer to Exhibit 15-2.When testing whether the explanatory variables jointly influence the response variable,the null hypothesis is
A)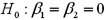
B)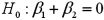
C)
D)
, where Win is the proportion of winning,Double Faults is the percentage of double faults made,and Aces is the number of Aces.A portion of the regression results are shown in the accompanying table. Refer to Exhibit 15-2.When testing whether the explanatory variables jointly influence the response variable,the null hypothesis isA)
B)
C)
D)
Question
Question
Exhibit 15-2.A sports analyst wants to exam the factors that may influence a tennis player's chances of winning.Over four tournaments,he collects data on 30 tennis players and estimates the following model:  , where Win is the proportion of winning,Double Faults is the percentage of double faults made,and Aces is the number of Aces.A portion of the regression results are shown in the accompanying table.
 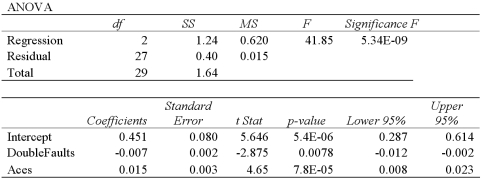 Refer to Exhibit 15-2.Is the relationship between Win and Aces significant at the 5 percent level?
A)No,because the relevant p-value is less than 0.05.
B)Yes,because the relevant p-value is less than 0.05.
C)No,because the relevant p-value is greater than 0.05.
D)Yes,because the relevant p-value is greater than 0.05.
, where Win is the proportion of winning,Double Faults is the percentage of double faults made,and Aces is the number of Aces.A portion of the regression results are shown in the accompanying table. Refer to Exhibit 15-2.Is the relationship between Win and Aces significant at the 5 percent level?A)No,because the relevant p-value is less than 0.05.
B)Yes,because the relevant p-value is less than 0.05.
C)No,because the relevant p-value is greater than 0.05.
D)Yes,because the relevant p-value is greater than 0.05.
Question
Exhibit 15-1.An marketing analyst wants to examine the relationship between sales (in $1,000s)and advertising (in $100s)for firms in the food and beverage industry and so collects monthly data for 25 firms.He estimates the model  .The following table shows a portion of the regression results.
  Refer to Exhibit 15-1.When testing whether Advertising is significant at the 10% significance level,the conclusion is to
A)Reject H0;Advertising is significant.
B)Not reject H0;Advertising is significant.
C)Reject H0;Advertising is not significant.
D)Not reject H0;Advertising is not significant.
.The following table shows a portion of the regression results. Refer to Exhibit 15-1.When testing whether Advertising is significant at the 10% significance level,the conclusion is toA)Reject H0;Advertising is significant.
B)Not reject H0;Advertising is significant.
C)Reject H0;Advertising is not significant.
D)Not reject H0;Advertising is not significant.

Unlock Deck
Sign up to unlock the cards in this deck!
Unlock Deck
Unlock Deck
1/117
Play
Full screen (f)
Deck 15: Inference With Regression Models
1
In a multiple regression based on 30 observations,the following information is provided:
 with
with  .Also,
  evaluated at
  and
and  is 2.8.
a.Construct a 95% confidence interval for
 if x1 equals 40 and x2 equals 30.
b.Construct a 95% prediction interval for y if x1 equals 40 and x2 equals 30.
c.Which interval is narrower? Explain.
2
The accompanying table shows the regression results when estimating
 .
. 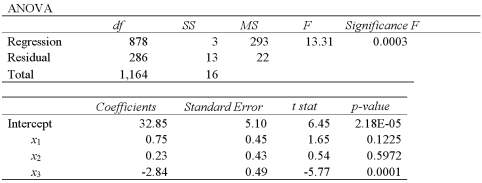 a.Specify the competing hypotheses to determine whether the explanatory variables are jointly significant.
b.At the 5% significance level,are the explanatory variables jointly significant? Explain.
c.At the 5% significance level,is x2 significant in explaining y? Explain.
d.At the 5% significance level,is the slope coefficient attached to x3 different from -2?
3
Consider the following regression results based on 40 observations.
 a.Specify the hypotheses to determine if the slope differs from one.
b.Calculate the value of the test statistic.
c.At the 5% significance level,find the critical value(s).
d.Does the slope differ from one? Explain.
4
A simple linear regression, ,is estimated using time-series data over the last 10 years.The residuals e,and the time variable t are shown in the accompanying table. a.Graph the residuals e against time and look for any discernible pattern.
b.Which assumption is being violated? Discuss its consequences and suggest a possible remedy.
,is estimated using time-series data over the last 10 years.The residuals e,and the time variable t are shown in the accompanying table. a.Graph the residuals e against time and look for any discernible pattern.b.Which assumption is being violated? Discuss its consequences and suggest a possible remedy.
Unlock Deck
Unlock for access to all 117 flashcards in this deck.
Unlock Deck
k this deck
5
In a multiple regression based on 30 observations,the following information is provided:
Unlock Deck
Unlock for access to all 117 flashcards in this deck.
Unlock Deck
k this deck
6
Consider the following regression results based on 30 observations.
Unlock Deck
Unlock for access to all 117 flashcards in this deck.
Unlock Deck
k this deck
7
An investment analyst wants to examine the relationship between a mutual fund's return,its turnover rate and its expense ratio.She randomly selects 10 mutual funds and estimates: Return = β0 + β1 Turnover + β2 Expense + ε,where Return is the average five-year return (in %),Turnover is the annual holdings turnover (in %),Expense is the annual expense ratio (in %),and ε is the random error component.A portion of the regression results is shown in the accompanying table.
Unlock Deck
Unlock for access to all 117 flashcards in this deck.
Unlock Deck
k this deck
8
The accompanying table shows the regression results when estimating
Unlock Deck
Unlock for access to all 117 flashcards in this deck.
Unlock Deck
k this deck
9
A sociologist studies the relationship between a district's average score on a standardized test for 10th grade students (y),the average school expenditures per student (x1in $1000s),and an index of socioeconomic status of the district (x2).The results of the regression are:
Unlock Deck
Unlock for access to all 117 flashcards in this deck.
Unlock Deck
k this deck
10
A researcher analyzes the factors that may influence the poverty rate and estimates the following model:
Unlock Deck
Unlock for access to all 117 flashcards in this deck.
Unlock Deck
k this deck
11
In a simple linear regression based on 30 observations,the following information is provided:
Unlock Deck
Unlock for access to all 117 flashcards in this deck.
Unlock Deck
k this deck
12
A marketing manager examines the relationship between the attendance at amusement parks and the price of admission.He estimates the following model:
Unlock Deck
Unlock for access to all 117 flashcards in this deck.
Unlock Deck
k this deck
13
A simple linear regression, ,is estimated using cross-sectional data from 10 firms.The resulting residuals e,along with the values of the explanatory variable Advertising (x,in $100s),are shown in the accompanying table. a.Graph the residuals e against Advertising (x)and look for any discernible pattern.
b.Which assumption is being violated? Discuss its consequences and suggest a possible remedy.
,is estimated using cross-sectional data from 10 firms.The resulting residuals e,along with the values of the explanatory variable Advertising (x,in $100s),are shown in the accompanying table. a.Graph the residuals e against Advertising (x)and look for any discernible pattern.b.Which assumption is being violated? Discuss its consequences and suggest a possible remedy.
Unlock Deck
Unlock for access to all 117 flashcards in this deck.
Unlock Deck
k this deck
14
Consider the following regression results based on 30 observations.
Unlock Deck
Unlock for access to all 117 flashcards in this deck.
Unlock Deck
k this deck
15
An analyst examines the effect that various variables have on crop yield.He estimates
Unlock Deck
Unlock for access to all 117 flashcards in this deck.
Unlock Deck
k this deck
16
When estimating a multiple regression model based on 30 observations,the following results were obtained.
Unlock Deck
Unlock for access to all 117 flashcards in this deck.
Unlock Deck
k this deck
17
A manager at a local bank analyzed the relationship between monthly salary (y,in $)and length of service (x,measured in months)for 30 employees.The following table summarizes a portion of the regression results:
Unlock Deck
Unlock for access to all 117 flashcards in this deck.
Unlock Deck
k this deck
18
A sociologist estimates the following regression relating Poverty (y)to Education (x1):
Unlock Deck
Unlock for access to all 117 flashcards in this deck.
Unlock Deck
k this deck
19
Pfizer Inc.is the world's largest research-based pharmaceutical company.Monthly data for Pfizer's risk-adjusted return and the risk-adjusted market return are collected for a five-year period (n = 60).The accompanying table shows the regression results when estimating the CAPM model for Pfizer's return.
Unlock Deck
Unlock for access to all 117 flashcards in this deck.
Unlock Deck
k this deck
20
Assume you ran a multiple regression to gain a better understanding of the relationship between lumber sales,housing starts,and commercial construction.The regression uses Lumber Sales (in $100,000s)as the response variable with Housing Starts (in 1000s)and Commercial Construction (in 1000s)as the explanatory variables.The results of the regression are:
Unlock Deck
Unlock for access to all 117 flashcards in this deck.
Unlock Deck
k this deck
21
The term multicollinearity refers to the condition when the variance of the error term,conditional on x1,x2,…,xn,is the same for all observations.
Unlock Deck
Unlock for access to all 117 flashcards in this deck.
Unlock Deck
k this deck
22
A wavelike movement in residuals suggests positive serial correlation.
Unlock Deck
Unlock for access to all 117 flashcards in this deck.
Unlock Deck
k this deck
23
The accompanying table shows the regression results when estimating .When testing whether the slope coefficient differs from 1,the value of the test statistic is
A)0.66
B)1.42
C)1.96
D)2.25
.When testing whether the slope coefficient differs from 1,the value of the test statistic is A)0.66
B)1.42
C)1.96
D)2.25
Unlock Deck
Unlock for access to all 117 flashcards in this deck.
Unlock Deck
k this deck
24
The term BLUE stands for Best Linear Unbiased Estimator.
Unlock Deck
Unlock for access to all 117 flashcards in this deck.
Unlock Deck
k this deck
25
Given the following portion of regression results,which of the following conclusions is true with regard to the F test at the 5% significance level?
A)Neither of the explanatory variables is related to the response variable.
B)Both of the explanatory variables are related to the response variable.
C)Exactly one of the explanatory variables is related to the response variable.
D)At least one of the explanatory variables is significantly related to the response variable.
Unlock Deck
Unlock for access to all 117 flashcards in this deck.
Unlock Deck
k this deck
26
A crucial assumption in a regression model is that the error term is not correlated with any of the explanatory variables.
Unlock Deck
Unlock for access to all 117 flashcards in this deck.
Unlock Deck
k this deck
27
Excel and virtually all other statistical packages report the p-value
A)for a two-tailed test that assesses whether the regression coefficient differs from one.
B)for a right-tailed test that assesses whether the regression coefficient is greater than zero.
C)for a two-tailed test that assesses whether the regression coefficient differs from zero.
D)for a left-tailed test that assesses whether the regression coefficient is less than zero.
Unlock Deck
Unlock for access to all 117 flashcards in this deck.
Unlock Deck
k this deck
28
Find the 95% confidence interval for the regression coefficient β1,if df = 30,b = -2 and .
A)[-5.00,-1.00]
B)[-7.88,3.88]
C)[-7.09,3.09]
D)[-8.13,4.13]
.A)[-5.00,-1.00]
B)[-7.88,3.88]
C)[-7.09,3.09]
D)[-8.13,4.13]
Unlock Deck
Unlock for access to all 117 flashcards in this deck.
Unlock Deck
k this deck
29
When some explanatory variables of a regression model are strongly correlated,this phenomenon is called serial correlation.
Unlock Deck
Unlock for access to all 117 flashcards in this deck.
Unlock Deck
k this deck
30
The accompanying table shows the regression results when estimating .Is x significantly related to y at the 5% significance level?
A)Yes,since the p-value of 0.0745 is greater than 0.05.
B)No,since the p-value of 0.0745 is greater than 0.05.
C)Yes,since the slope coefficient of 1.417 is less than the test statistic of 2.25.
D)No,since the slope coefficient of 1.417 is less than the test statistic of 2.25.
.Is x significantly related to y at the 5% significance level? A)Yes,since the p-value of 0.0745 is greater than 0.05.
B)No,since the p-value of 0.0745 is greater than 0.05.
C)Yes,since the slope coefficient of 1.417 is less than the test statistic of 2.25.
D)No,since the slope coefficient of 1.417 is less than the test statistic of 2.25.
Unlock Deck
Unlock for access to all 117 flashcards in this deck.
Unlock Deck
k this deck
31
Consider the following simple linear regression model: .When determining whether there is a positive linear relationship between x and y,the alternative hypothesis takes the form
A)
B)
C)
D)
.When determining whether there is a positive linear relationship between x and y,the alternative hypothesis takes the formA)
B)
C)
D)
Unlock Deck
Unlock for access to all 117 flashcards in this deck.
Unlock Deck
k this deck
32
Consider the following simple linear regression model: .When determining whether x significantly influences y,the null hypothesis takes the form
A)
B)
C)
D)
.When determining whether x significantly influences y,the null hypothesis takes the formA)
B)
C)
D)
Unlock Deck
Unlock for access to all 117 flashcards in this deck.
Unlock Deck
k this deck
33
If in the multiple linear model the slope coefficient βi is negative,it suggests an inverse (negative)relationship between the explanatory variable xi and the response variable.
Unlock Deck
Unlock for access to all 117 flashcards in this deck.
Unlock Deck
k this deck
34
Consider the following simple linear regression model: .When determining whether there is a negative linear relationship between x and y,the alternative hypothesis takes the form
A)
B)
C)
D)
.When determining whether there is a negative linear relationship between x and y,the alternative hypothesis takes the formA)
B)
C)
D)
Unlock Deck
Unlock for access to all 117 flashcards in this deck.
Unlock Deck
k this deck
35
The restricted model is a reduced model where we estimate the coefficients that are restricted under the null hypothesis.
Unlock Deck
Unlock for access to all 117 flashcards in this deck.
Unlock Deck
k this deck
36
Consider the following simple linear regression model: .When determining whether there is a one-to-one relationship between x and y,the null hypothesis takes the form
A)
B)
C)
D)
.When determining whether there is a one-to-one relationship between x and y,the null hypothesis takes the formA)
B)
C)
D)
Unlock Deck
Unlock for access to all 117 flashcards in this deck.
Unlock Deck
k this deck
37
Given the following portion of regression results,what is the value of the test statistic?
A)1.96
B)3.49
C)8.04
D)10
test statistic? A)1.96
B)3.49
C)8.04
D)10
Unlock Deck
Unlock for access to all 117 flashcards in this deck.
Unlock Deck
k this deck
38
The accompanying table shows the regression results when estimating .What is the value of the test statistic when testing whether x significantly influences y?
A)0.66
B)1.42
C)1.96
D)2.25
.What is the value of the test statistic when testing whether x significantly influences y? A)0.66
B)1.42
C)1.96
D)2.25
Unlock Deck
Unlock for access to all 117 flashcards in this deck.
Unlock Deck
k this deck
39
The test statistic for testing the individual significance is assumed to follow the t distribution with n - k - 2 degrees of freedom,where n is the sample size and k is the number of explanatory variables.
Unlock Deck
Unlock for access to all 117 flashcards in this deck.
Unlock Deck
k this deck
40
The alternative hypothesis for the test of joint significance is specified as: HA: At least two βj ≠ 0.
Unlock Deck
Unlock for access to all 117 flashcards in this deck.
Unlock Deck
k this deck
41
When confronted with multicollinearity,a good remedy is to ____ if we can justify its redundancy.
A)add one more collinear variable.
B)drop one of the collinear variables.
C)remove both the collinear variables.
D)add as many collinear variables as possible.
A)add one more collinear variable.
B)drop one of the collinear variables.
C)remove both the collinear variables.
D)add as many collinear variables as possible.
Unlock Deck
Unlock for access to all 117 flashcards in this deck.
Unlock Deck
k this deck
42
Which of the following violates the assumptions of regression analysis?
A)The error term is normally distributed.
B)The error term has a zero mean.
C)The error term is correlated with an explanatory variable.
D)The error term has a constant variance.
A)The error term is normally distributed.
B)The error term has a zero mean.
C)The error term is correlated with an explanatory variable.
D)The error term has a constant variance.
Unlock Deck
Unlock for access to all 117 flashcards in this deck.
Unlock Deck
k this deck
43
Serial correlation is typically observed in:
A)Outliers.
B)Sparse data.
C)Time series data.
D)Cross sectional data.
A)Outliers.
B)Sparse data.
C)Time series data.
D)Cross sectional data.
Unlock Deck
Unlock for access to all 117 flashcards in this deck.
Unlock Deck
k this deck
44
When estimating ,you wish to test versus .The value of the test statistic is and its associated p-value is 0.0092.At the 1% significance level,the conclusion is to:
A)Reject the null hypothesis and conclude that the influence of x1 and x2 on y is the same.
B)Reject the null hypothesis and conclude that the influence of x1 and x2 on y is not the same.
C)Do not reject the null hypothesis and conclude that the influence of x1 and x2 on y is the same.
D)Do not reject the null hypothesis and conclude that the influence of x1 and x2 on y is not the same.
,you wish to test versus .The value of the test statistic is and its associated p-value is 0.0092.At the 1% significance level,the conclusion is to:A)Reject the null hypothesis and conclude that the influence of x1 and x2 on y is the same.
B)Reject the null hypothesis and conclude that the influence of x1 and x2 on y is not the same.
C)Do not reject the null hypothesis and conclude that the influence of x1 and x2 on y is the same.
D)Do not reject the null hypothesis and conclude that the influence of x1 and x2 on y is not the same.
Unlock Deck
Unlock for access to all 117 flashcards in this deck.
Unlock Deck
k this deck
45
In regression,the two types of interval estimates concerning y are called:
A)significance interval and prediction interval.
B)confidence interval and significance interval.
C)confidence interval and prediction interval.
D)significance interval and frequency interval.
A)significance interval and prediction interval.
B)confidence interval and significance interval.
C)confidence interval and prediction interval.
D)significance interval and frequency interval.
Unlock Deck
Unlock for access to all 117 flashcards in this deck.
Unlock Deck
k this deck
46
If the variance of the error term is not the same for all observations,we
A)Get estimators that are biased.
B)Can perform tests of significance.
C)Cannot conduct tests of significance.
D)A and C
A)Get estimators that are biased.
B)Can perform tests of significance.
C)Cannot conduct tests of significance.
D)A and C
Unlock Deck
Unlock for access to all 117 flashcards in this deck.
Unlock Deck
k this deck
47
Multicollinearity is suspected when
A)there is a low R2 coupled with significant explanatory variables.
B)there is a high R2 coupled with significant explanatory variables.
C)there is a low R2 coupled with insignificant explanatory variables.
D)there is a high R2 coupled with insignificant explanatory variables.
A)there is a low R2 coupled with significant explanatory variables.
B)there is a high R2 coupled with significant explanatory variables.
C)there is a low R2 coupled with insignificant explanatory variables.
D)there is a high R2 coupled with insignificant explanatory variables.
Unlock Deck
Unlock for access to all 117 flashcards in this deck.
Unlock Deck
k this deck
48
A sample of 200 monthly observations is used to run a simple linear regression: Returns = β0 + β1 Leverage + ε.A five percent level of significance is used to study if leverage has a significant influence on returns.The value of the test statistic for the regression coefficient of Leverage is calculated as ,with an associated p-value of 0.2770.The correct decision is to:
A)Reject the null hypothesis and conclude that leverage significantly explains returns.
B)Reject the null hypothesis and conclude that leverage does not significantly explain returns.
C)Do not reject the null hypothesis and conclude that leverage does not significantly explain returns.
D)Do not reject the null hypothesis and conclude that leverage significantly explains returns.
,with an associated p-value of 0.2770.The correct decision is to:A)Reject the null hypothesis and conclude that leverage significantly explains returns.
B)Reject the null hypothesis and conclude that leverage does not significantly explain returns.
C)Do not reject the null hypothesis and conclude that leverage does not significantly explain returns.
D)Do not reject the null hypothesis and conclude that leverage significantly explains returns.
Unlock Deck
Unlock for access to all 117 flashcards in this deck.
Unlock Deck
k this deck
49
One of the assumptions of regression analysis is:
A)there is perfect multicollinearity among some explanatory variables.
B)there is no perfect multicollinearity among any explanatory variables.
C)there is some degree of multicollinearity among some explanatory variables.
D)None of the above.
A)there is perfect multicollinearity among some explanatory variables.
B)there is no perfect multicollinearity among any explanatory variables.
C)there is some degree of multicollinearity among some explanatory variables.
D)None of the above.
Unlock Deck
Unlock for access to all 117 flashcards in this deck.
Unlock Deck
k this deck
50
In regression,the predicted values concerning y are subject to:
A)Kurtosis.
B)Skewness.
C)Mean deviation.
D)Sampling variation.
A)Kurtosis.
B)Skewness.
C)Mean deviation.
D)Sampling variation.
Unlock Deck
Unlock for access to all 117 flashcards in this deck.
Unlock Deck
k this deck
51
In regression,multicollinearity is considered problematic when two or more explanatory variables are:
A)Not correlated.
B)Rarely correlated.
C)Highly correlated.
D)Moderately correlated.
A)Not correlated.
B)Rarely correlated.
C)Highly correlated.
D)Moderately correlated.
Unlock Deck
Unlock for access to all 117 flashcards in this deck.
Unlock Deck
k this deck
52
Given the following portion of regression results,what is the value of the test statistic?
A)1.96
B)2.59
C)3.49
D)10
test statistic? A)1.96
B)2.59
C)3.49
D)10
Unlock Deck
Unlock for access to all 117 flashcards in this deck.
Unlock Deck
k this deck
53
The accompanying table shows the regression results when estimating .At the 5% significance level,which explanatory variable(s)is(are)individually significant?
A)Only x1
B)Only x3
C)x1 and x2
D)x2 and x3
.At the 5% significance level,which explanatory variable(s)is(are)individually significant? A)Only x1
B)Only x3
C)x1 and x2
D)x2 and x3
Unlock Deck
Unlock for access to all 117 flashcards in this deck.
Unlock Deck
k this deck
54
Given the following portion of regression results,which of the following conclusions is true with regard to the F test at the 5% significance level?
A)Neither of the explanatory variables is significantly related to the response variable.
B)Both of the explanatory variables are significantly related to the response variable.
C)Exactly one of the explanatory variables is significantly related to the response variable.
D)At least one of the explanatory variables is significantly related to the response variable.
Unlock Deck
Unlock for access to all 117 flashcards in this deck.
Unlock Deck
k this deck
55
When testing r linear restrictions imposed on the model ,the test statistic is assumed to follow the distribution with
A)df1 = k and df2 = n - k - 1.
B)df1 = k - 1 and df2 = n - k - 1.
C)df1 = r and df2 = n - k.
D)df1 = r and df2 = n - k - 1.
,the test statistic is assumed to follow the distribution withA)df1 = k and df2 = n - k - 1.
B)df1 = k - 1 and df2 = n - k - 1.
C)df1 = r and df2 = n - k.
D)df1 = r and df2 = n - k - 1.
Unlock Deck
Unlock for access to all 117 flashcards in this deck.
Unlock Deck
k this deck
56
A researcher gathers data on 25 households and estimates the following model: .A residual plot of the estimated model is shown in the accompanying graph.What can be inferred from the residual plot?
A)The residuals have little variation.
B)The residuals do not exhibit any pattern.
C)The residuals seem to fan out across the horizontal axis.
D)The residuals are evenly distributed across the horizontal axis.
.A residual plot of the estimated model is shown in the accompanying graph.What can be inferred from the residual plot? A)The residuals have little variation.
B)The residuals do not exhibit any pattern.
C)The residuals seem to fan out across the horizontal axis.
D)The residuals are evenly distributed across the horizontal axis.
Unlock Deck
Unlock for access to all 117 flashcards in this deck.
Unlock Deck
k this deck
57
For a given confidence level,the prediction interval is always wider than the confidence interval because
A)The confidence interval is for a particular value of y rather than for the expected value E(y).
B)The prediction interval is for a particular value of y rather than for the expected value E(y).
C)The confidence interval is for a particular value of x rather than for the expected value E(x).
D)The prediction interval is for a particular value of x rather than for the expected value E(x).
Unlock Deck
Unlock for access to all 117 flashcards in this deck.
Unlock Deck
k this deck
58
When estimating ,you wish to test versus .The value of the test statistic is and its associated p-value is 0.1073.At the 5% significance level,the conclusion is to:
A)Reject the null hypothesis and conclude that x1 and x2 are jointly significant.
B)Reject the null hypothesis and conclude that x1 and x2 are not jointly significant.
C)Do not reject the null hypothesis and conclude that x1 and x2 are jointly significant.
D)Do not reject the null hypothesis and conclude that x1 and x2 are not jointly significant.
,you wish to test versus .The value of the test statistic is and its associated p-value is 0.1073.At the 5% significance level,the conclusion is to:A)Reject the null hypothesis and conclude that x1 and x2 are jointly significant.
B)Reject the null hypothesis and conclude that x1 and x2 are not jointly significant.
C)Do not reject the null hypothesis and conclude that x1 and x2 are jointly significant.
D)Do not reject the null hypothesis and conclude that x1 and x2 are not jointly significant.
Unlock Deck
Unlock for access to all 117 flashcards in this deck.
Unlock Deck
k this deck
59
Refer to the portion of regression results in the accompanying table.When testing the overall significance of the regression model at the 5% level given a critical value of ,the decision is to:
A)Reject H0 and conclude that the explanatory variables are jointly significant.
B)Do not reject H0 and conclude that the explanatory variables are jointly significant.
C)Reject H0 and conclude that the explanatory variables are not jointly significant.
D)Do not reject H0 and conclude that the explanatory variables are not jointly significant.
,the decision is to: A)Reject H0 and conclude that the explanatory variables are jointly significant.
B)Do not reject H0 and conclude that the explanatory variables are jointly significant.
C)Reject H0 and conclude that the explanatory variables are not jointly significant.
D)Do not reject H0 and conclude that the explanatory variables are not jointly significant.
Unlock Deck
Unlock for access to all 117 flashcards in this deck.
Unlock Deck
k this deck
60
Refer to the portion of regression results in the accompanying table.When testing the overall significance of the regression model at the 5% level given a critical value of ,the decision is to:
A)Reject H0 and conclude that the explanatory variables are jointly significant.
B)Do not reject H0 and conclude that the explanatory variables are jointly significant.
C)Reject H0 and conclude that the explanatory variables are not jointly significant.
D)Do not reject H0 and conclude that the explanatory variables are not jointly significant.
,the decision is to: A)Reject H0 and conclude that the explanatory variables are jointly significant.
B)Do not reject H0 and conclude that the explanatory variables are jointly significant.
C)Reject H0 and conclude that the explanatory variables are not jointly significant.
D)Do not reject H0 and conclude that the explanatory variables are not jointly significant.
Unlock Deck
Unlock for access to all 117 flashcards in this deck.
Unlock Deck
k this deck
61
Exhibit 15-6.Tiffany & Co.has been the world's premier jeweler since 1837.The performance of Tiffany's stock is likely to be strongly influenced by the economy.Monthly data for Tiffany's risk-adjusted return and the risk-adjusted market return are collected for a five-year period (n = 60).The accompanying table shows the regression results when estimating the CAPM model for Tiffany's return. Refer to Exhibit 15-6.You would like to determine whether an investment in Tiffany's is riskier than the market.When conducting this test,you set up the following competing hypotheses:
A)
B)
C)
D)
Refer to Exhibit 15-6.You would like to determine whether an investment in Tiffany's is riskier than the market.When conducting this test,you set up the following competing hypotheses:A)
B)
C)
D)
Unlock Deck
Unlock for access to all 117 flashcards in this deck.
Unlock Deck
k this deck
62
Exhibit 15-5.The accompanying table shows the regression results when estimating . Refer to Exhibit 15-5.At the 5% significance level,which explanatory variable(s)is(are)individually significant?
A)Only x1
B)Only x3
C)x1 and x2
D)x2 and x3
. Refer to Exhibit 15-5.At the 5% significance level,which explanatory variable(s)is(are)individually significant?A)Only x1
B)Only x3
C)x1 and x2
D)x2 and x3
Unlock Deck
Unlock for access to all 117 flashcards in this deck.
Unlock Deck
k this deck
63
Exhibit 15-6.Tiffany & Co.has been the world's premier jeweler since 1837.The performance of Tiffany's stock is likely to be strongly influenced by the economy.Monthly data for Tiffany's risk-adjusted return and the risk-adjusted market return are collected for a five-year period (n = 60).The accompanying table shows the regression results when estimating the CAPM model for Tiffany's return. Refer to Exhibit 15-6.When testing whether the beta coefficient is significantly greater than one,the relevant critical value at the 5% significance level is .The conclusion to the test is:
A)Reject H0,and conclude that the return on Tiffany stock is riskier than the return on the market.
B)Do not reject H0,and conclude that the return on Tiffany stock is riskier than the return on the market.
C)Reject H0,and conclude that the return on Tiffany stock is less risky than the return on the market.
D)Do not reject H0,and conclude that the return on Tiffany stock is less risky than the return on the market.
Refer to Exhibit 15-6.When testing whether the beta coefficient is significantly greater than one,the relevant critical value at the 5% significance level is .The conclusion to the test is:A)Reject H0,and conclude that the return on Tiffany stock is riskier than the return on the market.
B)Do not reject H0,and conclude that the return on Tiffany stock is riskier than the return on the market.
C)Reject H0,and conclude that the return on Tiffany stock is less risky than the return on the market.
D)Do not reject H0,and conclude that the return on Tiffany stock is less risky than the return on the market.
Unlock Deck
Unlock for access to all 117 flashcards in this deck.
Unlock Deck
k this deck
64
Exhibit 15-4.A researcher analyzes the factors that may influence amusement park attendance and estimates the following model: , where Attendance is the daily attendance (in 1000s),Price is the gate price (in $),and Rides is the number of rides at the amusement park.The researcher would like to construct interval estimates for Attendance when Price and Rides equal $85 and 30,respectively.The researcher estimates a modified model where Attendance is the response variable and the explanatory variables are now defined as and .A portion of the regression results is shown in the accompanying table. Refer to Exhibit 15-4.According to the modified model,what is a 95% prediction interval for Attendance when Price and Rides equal $85 and 30,respectively? (Note that . )
A)[12,740,56,080]
B)[16,330,53,450]
C)[26,080,42,740]
D)[28,900,41,500]
, where Attendance is the daily attendance (in 1000s),Price is the gate price (in $),and Rides is the number of rides at the amusement park.The researcher would like to construct interval estimates for Attendance when Price and Rides equal $85 and 30,respectively.The researcher estimates a modified model where Attendance is the response variable and the explanatory variables are now defined as and .A portion of the regression results is shown in the accompanying table. Refer to Exhibit 15-4.According to the modified model,what is a 95% prediction interval for Attendance when Price and Rides equal $85 and 30,respectively? (Note that . )A)[12,740,56,080]
B)[16,330,53,450]
C)[26,080,42,740]
D)[28,900,41,500]
Unlock Deck
Unlock for access to all 117 flashcards in this deck.
Unlock Deck
k this deck
65
Exhibit 15-5.The accompanying table shows the regression results when estimating . Refer to Exhibit 15-5.When testing whether or not x1 and x2 are jointly significant,the null hypothesis is
A)
B)
C)
D)
. Refer to Exhibit 15-5.When testing whether or not x1 and x2 are jointly significant,the null hypothesis isA)
B)
C)
D)
Unlock Deck
Unlock for access to all 117 flashcards in this deck.
Unlock Deck
k this deck
66
Exhibit 15-5.The accompanying table shows the regression results when estimating . Refer to Exhibit 15-5.When testing whether or not x1 and x2 have the same influence on y,the null hypothesis is
A)
B)
C)
D)
. Refer to Exhibit 15-5.When testing whether or not x1 and x2 have the same influence on y,the null hypothesis isA)
B)
C)
D)
Unlock Deck
Unlock for access to all 117 flashcards in this deck.
Unlock Deck
k this deck
67
Exhibit 15-1.An marketing analyst wants to examine the relationship between sales (in $1,000s)and advertising (in $100s)for firms in the food and beverage industry and so collects monthly data for 25 firms.He estimates the model .The following table shows a portion of the regression results. Refer to Exhibit 15-1.When testing whether the slope coefficient differs from 3,the critical values at the 5% significance level are -2.069 and 2.069.The conclusion to the test is to
A)Reject H0;the slope coefficient differs from 3.
B)Not reject H0;the slope coefficient differs from 3.
C)Reject H0;the slope coefficient does not differ from 3.
D)Not reject H0;the slope coefficient does not differ from 3.
.The following table shows a portion of the regression results. Refer to Exhibit 15-1.When testing whether the slope coefficient differs from 3,the critical values at the 5% significance level are -2.069 and 2.069.The conclusion to the test is toA)Reject H0;the slope coefficient differs from 3.
B)Not reject H0;the slope coefficient differs from 3.
C)Reject H0;the slope coefficient does not differ from 3.
D)Not reject H0;the slope coefficient does not differ from 3.
Unlock Deck
Unlock for access to all 117 flashcards in this deck.
Unlock Deck
k this deck
68
Exhibit 15-4.A researcher analyzes the factors that may influence amusement park attendance and estimates the following model: , where Attendance is the daily attendance (in 1000s),Price is the gate price (in $),and Rides is the number of rides at the amusement park.The researcher would like to construct interval estimates for Attendance when Price and Rides equal $85 and 30,respectively.The researcher estimates a modified model where Attendance is the response variable and the explanatory variables are now defined as and .A portion of the regression results is shown in the accompanying table. Refer to Exhibit 15-4.According to the modified model,what is the predicted value for Attendance when Price and Rides equal $85 and 30,respectively.
A)25,670
B)34,410
C)40,910
D)55,600
, where Attendance is the daily attendance (in 1000s),Price is the gate price (in $),and Rides is the number of rides at the amusement park.The researcher would like to construct interval estimates for Attendance when Price and Rides equal $85 and 30,respectively.The researcher estimates a modified model where Attendance is the response variable and the explanatory variables are now defined as and .A portion of the regression results is shown in the accompanying table. Refer to Exhibit 15-4.According to the modified model,what is the predicted value for Attendance when Price and Rides equal $85 and 30,respectively.A)25,670
B)34,410
C)40,910
D)55,600
Unlock Deck
Unlock for access to all 117 flashcards in this deck.
Unlock Deck
k this deck
69
Exhibit 15-2.A sports analyst wants to exam the factors that may influence a tennis player's chances of winning.Over four tournaments,he collects data on 30 tennis players and estimates the following model: , where Win is the proportion of winning,Double Faults is the percentage of double faults made,and Aces is the number of Aces.A portion of the regression results are shown in the accompanying table. Refer to Exhibit 15-2.When testing whether the explanatory variables are jointly significant at the 5% level,he
A)Rejects H0,and concludes that the explanatory variables are jointly significant.
B)Does not reject H0,and concludes that the explanatory variables are jointly significant.
C)Rejects H0,and concludes that the explanatory variables are not jointly significant.
D)Does not reject H0,and concludes that the explanatory variables are not jointly significant.
, where Win is the proportion of winning,Double Faults is the percentage of double faults made,and Aces is the number of Aces.A portion of the regression results are shown in the accompanying table. Refer to Exhibit 15-2.When testing whether the explanatory variables are jointly significant at the 5% level,heA)Rejects H0,and concludes that the explanatory variables are jointly significant.
B)Does not reject H0,and concludes that the explanatory variables are jointly significant.
C)Rejects H0,and concludes that the explanatory variables are not jointly significant.
D)Does not reject H0,and concludes that the explanatory variables are not jointly significant.
Unlock Deck
Unlock for access to all 117 flashcards in this deck.
Unlock Deck
k this deck
70
Exhibit 15-1.An marketing analyst wants to examine the relationship between sales (in $1,000s)and advertising (in $100s)for firms in the food and beverage industry and so collects monthly data for 25 firms.He estimates the model .The following table shows a portion of the regression results. Refer to Exhibit 15-1.Specify the competing hypotheses in order to test whether the slope coefficient differs from 3.
A)
B)
C)
D)
.The following table shows a portion of the regression results. Refer to Exhibit 15-1.Specify the competing hypotheses in order to test whether the slope coefficient differs from 3.A)
B)
C)
D)
Unlock Deck
Unlock for access to all 117 flashcards in this deck.
Unlock Deck
k this deck
71
Exhibit 15-2.A sports analyst wants to exam the factors that may influence a tennis player's chances of winning.Over four tournaments,he collects data on 30 tennis players and estimates the following model: , where Win is the proportion of winning,Double Faults is the percentage of double faults made,and Aces is the number of Aces.A portion of the regression results are shown in the accompanying table. Refer to Exhibit 15-2.Excel shows that the 95% confidence interval for β1 is [-0.12,-0.002].When determining whether or not Double Faults is significant at the 5% significance level,he
A)Rejects ,and concludes that Double Faults is significant.
B)Does not reject ,and concludes that Double Faults is significant.
C)Rejects ,and concludes that Double Faults is not significant.
D)Does not reject
, where Win is the proportion of winning,Double Faults is the percentage of double faults made,and Aces is the number of Aces.A portion of the regression results are shown in the accompanying table. Refer to Exhibit 15-2.Excel shows that the 95% confidence interval for β1 is [-0.12,-0.002].When determining whether or not Double Faults is significant at the 5% significance level,heA)Rejects
,and concludes that Double Faults is significant.B)Does not reject
,and concludes that Double Faults is significant.C)Rejects
,and concludes that Double Faults is not significant.D)Does not reject
Unlock Deck
Unlock for access to all 117 flashcards in this deck.
Unlock Deck
k this deck
72
Exhibit 15-1.An marketing analyst wants to examine the relationship between sales (in $1,000s)and advertising (in $100s)for firms in the food and beverage industry and so collects monthly data for 25 firms.He estimates the model .The following table shows a portion of the regression results. Refer to Exhibit 15-1.Specify the competing hypotheses in order to test whether Advertising is significant in predicting Sales.
A)
B)
C)
D)
.The following table shows a portion of the regression results. Refer to Exhibit 15-1.Specify the competing hypotheses in order to test whether Advertising is significant in predicting Sales.A)
B)
C)
D)
Unlock Deck
Unlock for access to all 117 flashcards in this deck.
Unlock Deck
k this deck
73
Exhibit 15-1.An marketing analyst wants to examine the relationship between sales (in $1,000s)and advertising (in $100s)for firms in the food and beverage industry and so collects monthly data for 25 firms.He estimates the model .The following table shows a portion of the regression results. Refer to Exhibit 15-1.When testing whether the slope coefficient differs from 3,the value of the test statistic is:
A)
B)
C)
D)
.The following table shows a portion of the regression results. Refer to Exhibit 15-1.When testing whether the slope coefficient differs from 3,the value of the test statistic is:A)
B)
C)
D)
Unlock Deck
Unlock for access to all 117 flashcards in this deck.
Unlock Deck
k this deck
74
Exhibit 15-4.A researcher analyzes the factors that may influence amusement park attendance and estimates the following model: , where Attendance is the daily attendance (in 1000s),Price is the gate price (in $),and Rides is the number of rides at the amusement park.The researcher would like to construct interval estimates for Attendance when Price and Rides equal $85 and 30,respectively.The researcher estimates a modified model where Attendance is the response variable and the explanatory variables are now defined as and .A portion of the regression results is shown in the accompanying table. Refer to Exhibit 15-4.According to the modified model,what is a 95% confidence interval for expected Attendance when Price and Rides equal $85 and 30,respectively? (Note that . )
A)[12,740,56,780]
B)[16,330,53,450]
C)[26,080,42,740]
D)[28,900,41,500]
, where Attendance is the daily attendance (in 1000s),Price is the gate price (in $),and Rides is the number of rides at the amusement park.The researcher would like to construct interval estimates for Attendance when Price and Rides equal $85 and 30,respectively.The researcher estimates a modified model where Attendance is the response variable and the explanatory variables are now defined as and .A portion of the regression results is shown in the accompanying table. Refer to Exhibit 15-4.According to the modified model,what is a 95% confidence interval for expected Attendance when Price and Rides equal $85 and 30,respectively? (Note that . )A)[12,740,56,780]
B)[16,330,53,450]
C)[26,080,42,740]
D)[28,900,41,500]
Unlock Deck
Unlock for access to all 117 flashcards in this deck.
Unlock Deck
k this deck
75
Exhibit 15-5.The accompanying table shows the regression results when estimating . Refer to Exhibit 15-5.When testing whether the explanatory variables are jointly significant at the 5% level,the conclusion is to:
A)Reject H0,and conclude that the explanatory variables are jointly significant.
B)Not reject H0,and conclude that the explanatory variables are jointly significant.
C)Reject H0,and conclude that the explanatory variables are not jointly significant.
D)Not reject H0,and conclude that the explanatory variables are not jointly significant.
. Refer to Exhibit 15-5.When testing whether the explanatory variables are jointly significant at the 5% level,the conclusion is to:A)Reject H0,and conclude that the explanatory variables are jointly significant.
B)Not reject H0,and conclude that the explanatory variables are jointly significant.
C)Reject H0,and conclude that the explanatory variables are not jointly significant.
D)Not reject H0,and conclude that the explanatory variables are not jointly significant.
Unlock Deck
Unlock for access to all 117 flashcards in this deck.
Unlock Deck
k this deck
76
Exhibit 15-6.Tiffany & Co.has been the world's premier jeweler since 1837.The performance of Tiffany's stock is likely to be strongly influenced by the economy.Monthly data for Tiffany's risk-adjusted return and the risk-adjusted market return are collected for a five-year period (n = 60).The accompanying table shows the regression results when estimating the CAPM model for Tiffany's return. Refer to Exhibit 15-6.When testing whether the beta coefficient is significantly greater than one,the value of the test statistic is
A)-98.
B)1.98.
C)4.33.
D)9.58.
Refer to Exhibit 15-6.When testing whether the beta coefficient is significantly greater than one,the value of the test statistic isA)-98.
B)1.98.
C)4.33.
D)9.58.
Unlock Deck
Unlock for access to all 117 flashcards in this deck.
Unlock Deck
k this deck
77
Exhibit 15-2.A sports analyst wants to exam the factors that may influence a tennis player's chances of winning.Over four tournaments,he collects data on 30 tennis players and estimates the following model: , where Win is the proportion of winning,Double Faults is the percentage of double faults made,and Aces is the number of Aces.A portion of the regression results are shown in the accompanying table. Refer to Exhibit 15-2.When testing whether the explanatory variables jointly influence the response variable,the null hypothesis is
A)
B)
C)
D)
, where Win is the proportion of winning,Double Faults is the percentage of double faults made,and Aces is the number of Aces.A portion of the regression results are shown in the accompanying table. Refer to Exhibit 15-2.When testing whether the explanatory variables jointly influence the response variable,the null hypothesis isA)
B)
C)
D)
Unlock Deck
Unlock for access to all 117 flashcards in this deck.
Unlock Deck
k this deck
78
Serial correlation occurs when the error term is:
A)Dispersed evenly.
B)Randomly distributed.
C)Correlated across observations.
D)Uncorrelated across observations.
A)Dispersed evenly.
B)Randomly distributed.
C)Correlated across observations.
D)Uncorrelated across observations.
Unlock Deck
Unlock for access to all 117 flashcards in this deck.
Unlock Deck
k this deck
79
Exhibit 15-2.A sports analyst wants to exam the factors that may influence a tennis player's chances of winning.Over four tournaments,he collects data on 30 tennis players and estimates the following model: , where Win is the proportion of winning,Double Faults is the percentage of double faults made,and Aces is the number of Aces.A portion of the regression results are shown in the accompanying table. Refer to Exhibit 15-2.Is the relationship between Win and Aces significant at the 5 percent level?
A)No,because the relevant p-value is less than 0.05.
B)Yes,because the relevant p-value is less than 0.05.
C)No,because the relevant p-value is greater than 0.05.
D)Yes,because the relevant p-value is greater than 0.05.
, where Win is the proportion of winning,Double Faults is the percentage of double faults made,and Aces is the number of Aces.A portion of the regression results are shown in the accompanying table. Refer to Exhibit 15-2.Is the relationship between Win and Aces significant at the 5 percent level?A)No,because the relevant p-value is less than 0.05.
B)Yes,because the relevant p-value is less than 0.05.
C)No,because the relevant p-value is greater than 0.05.
D)Yes,because the relevant p-value is greater than 0.05.
Unlock Deck
Unlock for access to all 117 flashcards in this deck.
Unlock Deck
k this deck
80
Exhibit 15-1.An marketing analyst wants to examine the relationship between sales (in $1,000s)and advertising (in $100s)for firms in the food and beverage industry and so collects monthly data for 25 firms.He estimates the model .The following table shows a portion of the regression results. Refer to Exhibit 15-1.When testing whether Advertising is significant at the 10% significance level,the conclusion is to
A)Reject H0;Advertising is significant.
B)Not reject H0;Advertising is significant.
C)Reject H0;Advertising is not significant.
D)Not reject H0;Advertising is not significant.
.The following table shows a portion of the regression results. Refer to Exhibit 15-1.When testing whether Advertising is significant at the 10% significance level,the conclusion is toA)Reject H0;Advertising is significant.
B)Not reject H0;Advertising is significant.
C)Reject H0;Advertising is not significant.
D)Not reject H0;Advertising is not significant.
Unlock Deck
Unlock for access to all 117 flashcards in this deck.
Unlock Deck
k this deck
Unlock Deck
Unlock for access to all 117 flashcards in this deck.


