Exam 15: Inference With Regression Models
Exhibit 15-7.A manager at a local bank analyzed the relationship between monthly salary (y,in $)and length of service (x,measured in months)for 30 employees.She estimates 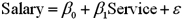 .The following table summarizes a portion of the regression results:
 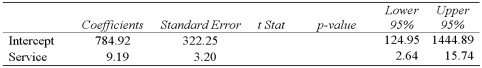 Refer to Exhibit 15-7.Using the 95% confidence interval,what is the conclusion to the following hypothesis test:
  ?
?
C
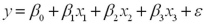
Exhibit 15-4.A researcher analyzes the factors that may influence amusement park attendance and estimates the following model:  , where Attendance is the daily attendance (in 1000s),Price is the gate price (in $),and Rides is the number of rides at the amusement park.The researcher would like to construct interval estimates for Attendance when Price and Rides equal $85 and 30,respectively.The researcher estimates a modified model where Attendance is the response variable and the explanatory variables are now defined as
  and
and  .A portion of the regression results is shown in the accompanying table.
 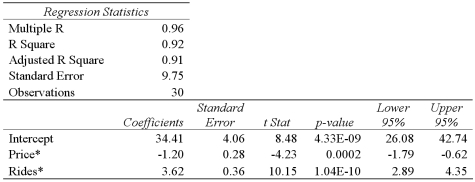 Refer to Exhibit 15-4.According to the modified model,what is the predicted value for Attendance when Price and Rides equal $85 and 30,respectively.
B
A researcher analyzes the factors that may influence the poverty rate and estimates the following model:
 ,
,
where y is the poverty rate (y,in %),x1 is the percent of the population with at least a high school education,x2 is the median income ( in $1000s),and x3 is the mortality rate (per 1,000 residents).The researcher would like to construct interval estimates for y when x1,x2,and x3 equal 85%,$50,000,and 10,respectively.The researcher estimates a modified model where poverty rate is the response variable and the explanatory variables are now defined as 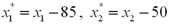 ,and
,and  .A portion of the regression results is shown in the accompanying table.
 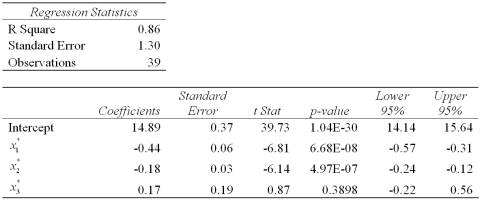 a.According to the modified model,what is the point estimate for the poverty rate when x1,x2,and x3 equal 85%,$50,000,and 10,respectively.
b.According to the modified model,what is a 95% confidence interval for the expected poverty rate when x1,x2,and x3 equal 85%,$50,000,and 10,respectively? (Note that  . )
. )
c.According to the modified model,what is a 95% prediction interval for the poverty rate when x1,x2,and x3 equal 85%,$50,000,and 10,respectively? (Note that  . )
. )
Exhibit 15-5.The accompanying table shows the regression results when estimating  .
.  Refer to Exhibit 15-5.When testing whether or not x1 and x2 are jointly significant,the null hypothesis is
Exhibit 15-1.An marketing analyst wants to examine the relationship between sales (in $1,000s)and advertising (in $100s)for firms in the food and beverage industry and so collects monthly data for 25 firms.He estimates the model 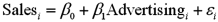 .The following table shows a portion of the regression results.
  Refer to Exhibit 15-1.When testing whether the slope coefficient differs from 3,the critical values at the 5% significance level are -2.069 and 2.069.The conclusion to the test is to
The accompanying table shows the regression results when estimating 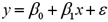 .When testing whether the slope coefficient differs from 1,the value of the test statistic is
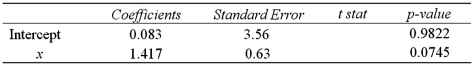
Exhibit 15-6.Tiffany & Co.has been the world's premier jeweler since 1837.The performance of Tiffany's stock is likely to be strongly influenced by the economy.Monthly data for Tiffany's risk-adjusted return and the risk-adjusted market return are collected for a five-year period (n = 60).The accompanying table shows the regression results when estimating the CAPM model for Tiffany's return. 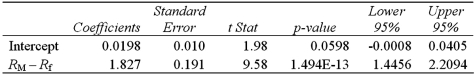 Refer to Exhibit 15-6.When testing whether there are abnormal returns,or whether the alpha coefficient is significantly different from zero,the value of the test statistic is
A marketing manager examines the relationship between the attendance at amusement parks and the price of admission.He estimates the following model:
Exhibit 15-6.Tiffany & Co.has been the world's premier jeweler since 1837.The performance of Tiffany's stock is likely to be strongly influenced by the economy.Monthly data for Tiffany's risk-adjusted return and the risk-adjusted market return are collected for a five-year period (n = 60).The accompanying table shows the regression results when estimating the CAPM model for Tiffany's return.  Refer to Exhibit 15-6.When testing whether the beta coefficient is significantly greater than one,the value of the test statistic is
The accompanying table shows the regression results when estimating 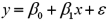 .What is the value of the test statistic when testing whether x significantly influences y?
Exhibit 15-9.An economist estimates the following model:  .She would like to construct interval estimates for y when x equals 2.She estimates a modified model where y is the response variable and the explanatory variable is now defined as
  .A portion of the regression results is shown in the accompanying table.
 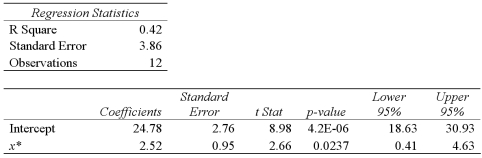 Refer to Exhibit 15-9.According to the modified model,what is the predicted value of y when x equals 2.
Exhibit 15-5.The accompanying table shows the regression results when estimating 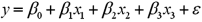 .
. 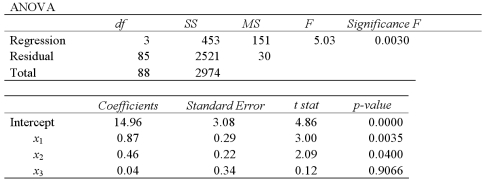 Refer to Exhibit 15-5.When testing whether the explanatory variables are jointly significant at the 5% level,the conclusion is to:
Find the 95% confidence interval for the regression coefficient β1,if df = 30,b = -2 and  .
.
A manager at a local bank analyzed the relationship between monthly salary (y,in $)and length of service (x,measured in months)for 30 employees.The following table summarizes a portion of the regression results:
Given the following portion of regression results,which of the following conclusions is true with regard to the F test at the 5% significance level? 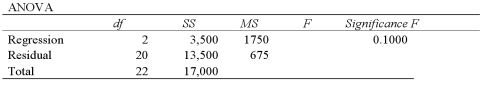
Exhibit 15-6.Tiffany & Co.has been the world's premier jeweler since 1837.The performance of Tiffany's stock is likely to be strongly influenced by the economy.Monthly data for Tiffany's risk-adjusted return and the risk-adjusted market return are collected for a five-year period (n = 60).The accompanying table shows the regression results when estimating the CAPM model for Tiffany's return.  Refer to Exhibit 15-6.You would like to determine whether an investment in Tiffany's is riskier than the market.When conducting this test,you set up the following competing hypotheses:
Excel and virtually all other statistical packages report the p-value
Filters
- Essay(0)
- Multiple Choice(0)
- Short Answer(0)
- True False(0)
- Matching(0)