Deck 3: Describing Distributions With Numbers
Full screen (f)
Question
The exam scores (out of 100 points) for all students taking an introductory statistics course are used to construct the following boxplot: 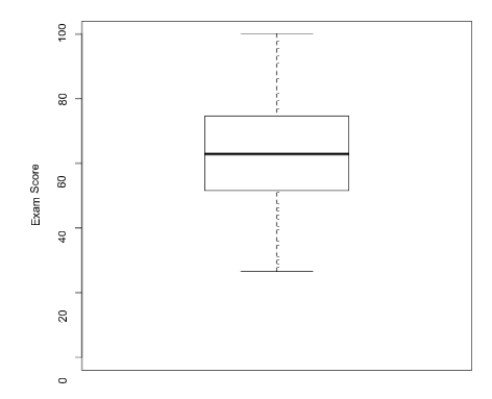 If 5 points were added to each score, then standard deviation of the new scores would:
A)be increased by 5.
B)be increased by 25.
C)be decreased by 5.
D)remain unchanged.
If 5 points were added to each score, then standard deviation of the new scores would:A)be increased by 5.
B)be increased by 25.
C)be decreased by 5.
D)remain unchanged.
Question
Question
A sample was taken of the salaries of 20 employees of a large company. The following is a boxplot of the salaries (in thousands of dollars) for this year. 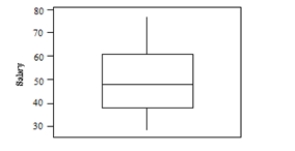 Based on this boxplot, which of the following statements is true?
A)The outliers are 28 and 77.
B)Suspected outliers would be less than 28 or greater than 77, so there are none.
C)Suspected outliers would be less than 6.75 or greater than 92.75, so there are none.
D)There are outliers, but they are not shown in the boxplot.
Based on this boxplot, which of the following statements is true?A)The outliers are 28 and 77.
B)Suspected outliers would be less than 28 or greater than 77, so there are none.
C)Suspected outliers would be less than 6.75 or greater than 92.75, so there are none.
D)There are outliers, but they are not shown in the boxplot.
Question
A violin student records the number of hours she spends practicing during each of nine consecutive weeks:  What is the first quartile for these data?
A)5.00 hours
B)5.76 hours
C)7.20 hours
D)4.65 hours
What is the first quartile for these data?A)5.00 hours
B)5.76 hours
C)7.20 hours
D)4.65 hours
Question
A sample was taken of the salaries of 20 employees of a large company. The following is a boxplot of the salaries (in thousands of dollars) for this year.  Based on this boxplot, the five-number summary (in thousands of dollars) is:
A)28, 39, 48, 60.5, 77.
B)28, 41, 48, 58, 77.
C)28, 39, 51, 58, 77.
D)28, 41, 51, 60.5, 77.
Based on this boxplot, the five-number summary (in thousands of dollars) is:A)28, 39, 48, 60.5, 77.
B)28, 41, 48, 58, 77.
C)28, 39, 51, 58, 77.
D)28, 41, 51, 60.5, 77.
Question
Question
Question
A violin student records the number of hours she spends practicing during each of nine consecutive weeks:  What is the interquartile range (IQR) for these data?
A)3.00 hours
B)2.65 hours
C)3.20 hours
D)1.65 hours
What is the interquartile range (IQR) for these data?A)3.00 hours
B)2.65 hours
C)3.20 hours
D)1.65 hours
Question
A violin student records the number of hours she spends practicing during each of nine consecutive weeks:  Considering the smallest data value (1.2) and using the 1.5 × IQR rule, we would:
A)classify the value 1.2 as an outlier, because it is more than 1.5 × IQR below the first quartile.
B)not classify the value 1.2 as an outlier, because it is not more than 1.5 × IQR below the first quartile.
C)classify the value 1.2 as an outlier, because it is more than 1.5 × IQR below the median.
D)classify the value 1.2 as an outlier, because it is more than 1.5 × IQR below the mean.
Considering the smallest data value (1.2) and using the 1.5 × IQR rule, we would:A)classify the value 1.2 as an outlier, because it is more than 1.5 × IQR below the first quartile.
B)not classify the value 1.2 as an outlier, because it is not more than 1.5 × IQR below the first quartile.
C)classify the value 1.2 as an outlier, because it is more than 1.5 × IQR below the median.
D)classify the value 1.2 as an outlier, because it is more than 1.5 × IQR below the mean.
Question
The 18 faculty members in a college math department range in age from 32 to 68. A stemplot follows:  The 1.5 × IQR rule would identify an age as a high outlier if it exceeded:
A)19 years.
B)28.5 years.
C)77 years.
D)86.5 years.
The 1.5 × IQR rule would identify an age as a high outlier if it exceeded:A)19 years.
B)28.5 years.
C)77 years.
D)86.5 years.
Question
The 18 faculty members in a college math department range in age from 32 to 68. A stemplot follows:  The first and third quartiles of the ages of the faculty members are:
A)38 and 57 years.
B)39 and 57 years.
C)39 and 58 years.
D)40 and 58 years.
The first and third quartiles of the ages of the faculty members are:A)38 and 57 years.
B)39 and 57 years.
C)39 and 58 years.
D)40 and 58 years.
Question
The exam scores (out of 100 points) for all students taking an introductory statistics course are used to construct the following boxplot:  Based on this boxplot, which of the following statements is true?
A)The distribution of scores is fairly symmetric.
B)About half the students scored below 63.
C)Nobody scored below 25.
D)All of the answer options are correct.
Based on this boxplot, which of the following statements is true?A)The distribution of scores is fairly symmetric.
B)About half the students scored below 63.
C)Nobody scored below 25.
D)All of the answer options are correct.
Question
The 18 faculty members in a college math department range in age from 32 to 68. A stemplot follows:  The median age of the faculty members is:
A)39 years.
B)45 years.
C)47.5 years.
D)49 years.
The median age of the faculty members is:A)39 years.
B)45 years.
C)47.5 years.
D)49 years.
Question
A violin student records the number of hours she spends practicing during each of nine consecutive weeks:  What is the mean number of hours spent practicing per week during this period?
A)6.15 hours
B)5.76 hours
C)6.20 hours
D)8.40 hours
What is the mean number of hours spent practicing per week during this period?A)6.15 hours
B)5.76 hours
C)6.20 hours
D)8.40 hours
Question
The exam scores (out of 100 points) for all students taking an introductory statistics course are used to construct the following boxplot:  If each person increased his or her score by 5 points, then:
A)the third quartile would increase by 5 points.
B)the median score would increase by 5 points.
C)the interquartile range would remain unchanged.
D)All of the answer options are correct.
If each person increased his or her score by 5 points, then:A)the third quartile would increase by 5 points.
B)the median score would increase by 5 points.
C)the interquartile range would remain unchanged.
D)All of the answer options are correct.
Question
The 18 faculty members in a college math department range in age from 32 to 68. A stemplot follows:  The 1.5 × IQR rule would identify an age as a low outlier if it was less than:
A)32 years.
B)28.5 years.
C)19 years.
D)10.5 years.
The 1.5 × IQR rule would identify an age as a low outlier if it was less than:A)32 years.
B)28.5 years.
C)19 years.
D)10.5 years.
Question
For each of the states and Puerto Rico, the histogram below shows the average property damage (in millions of dollars) caused by tornadoes over a 50-year period. 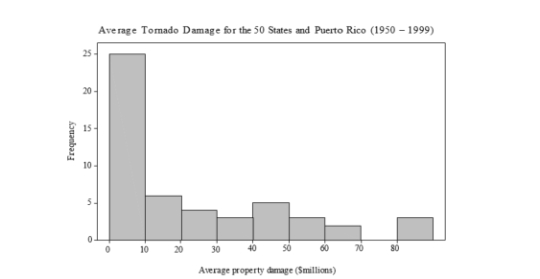 From the histogram, the first quartile must be:
A)in the interval 0-10.
B)in the interval 10-20.
C)in the interval 30-40.
D)greater than 10.
From the histogram, the first quartile must be:A)in the interval 0-10.
B)in the interval 10-20.
C)in the interval 30-40.
D)greater than 10.
Question
A violin student records the number of hours she spends practicing during each of nine consecutive weeks:  What is the median number of hours spent practicing per week during this period?
A)6.15 hours
B)5.76 hours
C)6.20 hours
D)8.40 hours
What is the median number of hours spent practicing per week during this period?A)6.15 hours
B)5.76 hours
C)6.20 hours
D)8.40 hours
Question
A sample was taken of the salaries of 20 employees of a large company. The following is a boxplot of the salaries (in thousands of dollars) for this year. 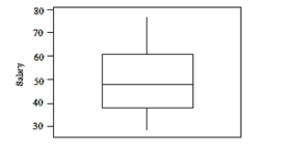 Based on this boxplot, which of the following statements is true?
A)The interquartile range is about $20,000.
B)The minimum salary is $20,000.
C)The range of the salaries is about $75,000.
D)The median salary is about $40,000.
Based on this boxplot, which of the following statements is true?A)The interquartile range is about $20,000.
B)The minimum salary is $20,000.
C)The range of the salaries is about $75,000.
D)The median salary is about $40,000.
Question
The 18 faculty members in a college math department range in age from 32 to 68. A stemplot follows:  If the eldest faculty member retires and is replaced by a 26-year-old, the median age will:
A)decrease by 2 years.
B)stay the same.
C)increase by 2 years.
D)increase by 4 years.
If the eldest faculty member retires and is replaced by a 26-year-old, the median age will:A)decrease by 2 years.
B)stay the same.
C)increase by 2 years.
D)increase by 4 years.
Question
Student ages (to the nearest year) in a school are as follows:  What is true about the median age?
A)It is 20.
B)It would remain unchanged if the 32-year-old was replaced with an 80-year-old.
C)It is between the first and third quartiles.
D)All of the answer options are correct.
What is true about the median age?A)It is 20.
B)It would remain unchanged if the 32-year-old was replaced with an 80-year-old.
C)It is between the first and third quartiles.
D)All of the answer options are correct.
Question
Question
Enteroliths are calcifications that form in the gut of a horse. The stones can cause considerable morbidity and mortality. A study was conducted to investigate factors (such as diet and environment) that may be related to the formation of enteroliths. The study contained seven stallions; their ages (in years) are as follows:  The youngest stallion, at 4 years old, is:
A)an outlier, because it is more than 15 years below the lower quartile.
B)an outlier, because it is the minimum.
C)not an outlier, because it is less than 15 years below the lower quartile.
D)not an outlier, because it is a positive value.
The youngest stallion, at 4 years old, is:A)an outlier, because it is more than 15 years below the lower quartile.
B)an outlier, because it is the minimum.
C)not an outlier, because it is less than 15 years below the lower quartile.
D)not an outlier, because it is a positive value.
Question
Student ages (to the nearest year) in a school are as follows:  What is true about the mean age?
A)It is less than 20.
B)It is greater than 20.
C)It is exactly 20.
D)It would remain unchanged if the 32-year-old was replaced with an 80-year-old.
What is true about the mean age?A)It is less than 20.
B)It is greater than 20.
C)It is exactly 20.
D)It would remain unchanged if the 32-year-old was replaced with an 80-year-old.
Question
A survey of 10 students was conducted to investigate the amount of time they spend on social media each day. Students were given a timer and asked to record the number of minutes spent every time they accessed social media. The students' total times for one day are given below (in minutes).  The five-number summary for these data is:
A)63, 88.6, 105, 42, 145.
B)45, 88, 88.6, 105, 145.
C)45, 63, 92, 105, 145.
D)45, 63, 88, 105, 145.
The five-number summary for these data is:A)63, 88.6, 105, 42, 145.
B)45, 88, 88.6, 105, 145.
C)45, 63, 92, 105, 145.
D)45, 63, 88, 105, 145.
Question
A survey of 10 students was conducted to investigate the amount of time they spend on social media each day. Students were given a timer and asked to record the number of minutes spent every time they accessed social media. The students' total times for one day are given below (in minutes).  The mean for these data is:
A)84.3.
B)88.6.
C)92.4.
D)88.0.
The mean for these data is:A)84.3.
B)88.6.
C)92.4.
D)88.0.
Question
The following is a sample of the percent increase in five growth funds over a one-year period.  The mean percent increase in this sample is:
A)11.8%.
B)12.2%.
C)13.7%.
D)14.1%.
The mean percent increase in this sample is:A)11.8%.
B)12.2%.
C)13.7%.
D)14.1%.
Question
Question
Enteroliths are calcifications that form in the gut of a horse. The stones can cause considerable morbidity and mortality. A study was conducted to investigate the factors (such as diet and environment) that may be related to the formation of enteroliths. The study contained 62 horses with enteroliths (cases) and 75 horses without (controls). The graph below contains side-by-side boxplots of the ages for cases and controls. 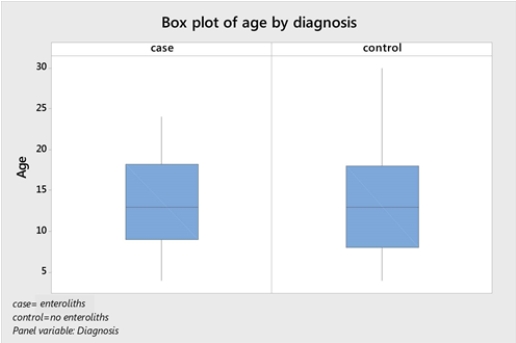 Based on the boxplots, the mean age for the cases:
A)is lower than the mean age for the controls.
B)is approximately the same as the mean age for the controls.
C)is higher than the mean age for the controls.
D)cannot be determined from boxplots.
Based on the boxplots, the mean age for the cases:A)is lower than the mean age for the controls.
B)is approximately the same as the mean age for the controls.
C)is higher than the mean age for the controls.
D)cannot be determined from boxplots.
Question
A survey of 10 students was conducted to investigate the amount of time they spend on social media each day. Students were given a timer and asked to record the number of minutes spent every time they accessed social media. The students' total times for one day are given below (in minutes).  The standard deviation for these data is:
A)29.9.
B)893.41.
C)28.4.
D)804.29.
The standard deviation for these data is:A)29.9.
B)893.41.
C)28.4.
D)804.29.
Question
Enteroliths are calcifications that form in the gut of a horse. The stones can cause considerable morbidity and mortality. A study was conducted to investigate factors (such as diet and environment) that may be related to the formation of enteroliths. The study contained 62 horses with enteroliths (cases) and 75 horses without (controls). The graph below contains side-by-side boxplots of the percent of alfalfa in the diet for cases and controls.  Based on the boxplot for cases, the distribution of the amount of alfalfa in the diet is:
A)highly skewed left.
B)highly skewed right.
C)symmetric.
D)None of the answer options is correct.
Based on the boxplot for cases, the distribution of the amount of alfalfa in the diet is:A)highly skewed left.
B)highly skewed right.
C)symmetric.
D)None of the answer options is correct.
Question
In a class of 100 students, the grades on an accounting test are summarized in the following frequency table:  The distribution of grades is:
A)symmetric.
B)skewed left.
C)skewed right.
D)not able to be determined from the information given.
The distribution of grades is:A)symmetric.
B)skewed left.
C)skewed right.
D)not able to be determined from the information given.
Question
The following histogram represents the distribution of acceptance rates (percent accepted) among 25 business schools in 2004. In each class interval, the left endpoint but not the right is included, so the class intervals are 10 rate < 15, 15 rate < 20, etc.  Which of the following could be the five-number summary for these data?
A)10, 22, 31, 39, 50
B)10, 20, 30, 40, 50
C)10, 26, 31, 34, 50
D)10, 22, 31, 29, 39
Which of the following could be the five-number summary for these data?A)10, 22, 31, 39, 50
B)10, 20, 30, 40, 50
C)10, 26, 31, 34, 50
D)10, 22, 31, 29, 39
Question
Enteroliths are calcifications that form in the gut of a horse. The stones can cause considerable morbidity and mortality. A study was conducted to investigate factors (such as diet and environment) that may be related to the formation of enteroliths. The study contained 62 horses with enteroliths (cases) and 75 horses without (controls). The graph below contains side-by-side boxplots of the percent of alfalfa in the diet for cases and controls. 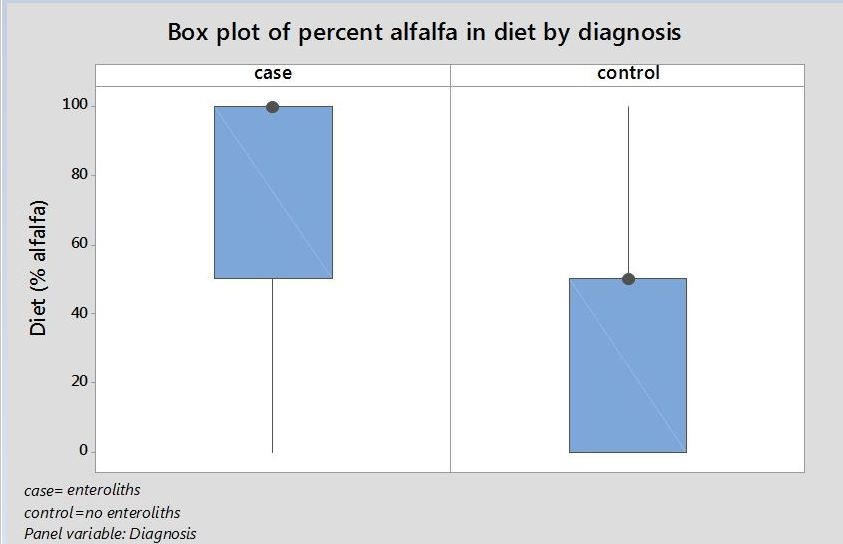
Based on the boxplot cases, the median amount of alfalfa in the diet of cases is:
A)the same as for controls.
B)half the amount as for controls.
C)twice the amount as for controls.
D)None of the answer options is correct.
Based on the boxplot cases, the median amount of alfalfa in the diet of cases is:
A)the same as for controls.
B)half the amount as for controls.
C)twice the amount as for controls.
D)None of the answer options is correct.
Question
The following histogram represents the distribution of acceptance rates (percent accepted) among 25 business schools in 2004. In each class interval, the left endpoint but not the right is included, so the class intervals are 10 rate < 15, 15 rate < 20, etc. 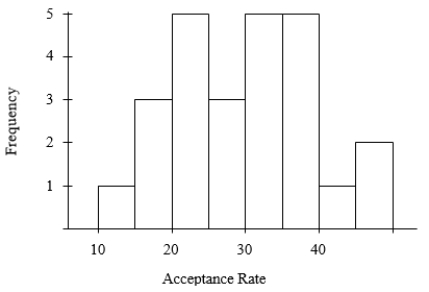 What is the median acceptance rate?
A)20%
B)just below 30%
C)just above 30%
D)40%
What is the median acceptance rate?A)20%
B)just below 30%
C)just above 30%
D)40%
Question
Question
Question
In a class of 100 students, the grades on an accounting test are summarized in the following frequency table:  The median grade is in which of the following intervals?
A)61-70
B)71-80
C)81-90
D)91-100
The median grade is in which of the following intervals?A)61-70
B)71-80
C)81-90
D)91-100
Question
Question
A survey of 10 students was conducted to investigate the amount of time they spend on social media each day. Students were given a timer and asked to record the number of minutes spent every time they accessed social media. The students' total times for one day are given below (in minutes).  A student who was not included in the survey recorded a time of 240 minutes on social media. That value is:
A)consistent with these data.
B)inconsistent with these data.
C)an outlier.
D)clearly an erroneous recording.
A student who was not included in the survey recorded a time of 240 minutes on social media. That value is:A)consistent with these data.
B)inconsistent with these data.
C)an outlier.
D)clearly an erroneous recording.
Question
A survey of radio stations was conducted following the attacks on the World Trade Center in 2001. One of the variables recorded was the region in which the station was located (east, center, or west). In addition to the variable "region," the following information was collected: the quartile of the media market (top, second, third, and fourth), state, rank (a number between 1 and 205), and share (a number between 0 and 7). 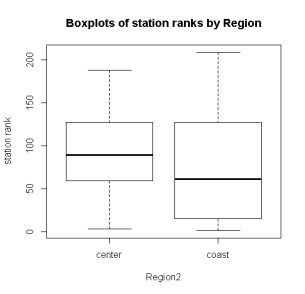 The side-by-side boxplots of station rank, above, show:
A)different median ranks between the regions.
B)more variability in ranks of coast stations.
C)similar minimum ranks between regions.
D)All of the answer options are correct.
The side-by-side boxplots of station rank, above, show:A)different median ranks between the regions.
B)more variability in ranks of coast stations.
C)similar minimum ranks between regions.
D)All of the answer options are correct.
Question
A survey of radio stations was conducted following the attacks on the World Trade Center in 2001. One of the variables recorded was the region in which the station was located (east, center, or west). In addition to the variable "region," the following information was collected: the quartile of the media market (top, second, third, and fourth), state, rank (a number between 1 and 205), and share (a number between 0 and 7). 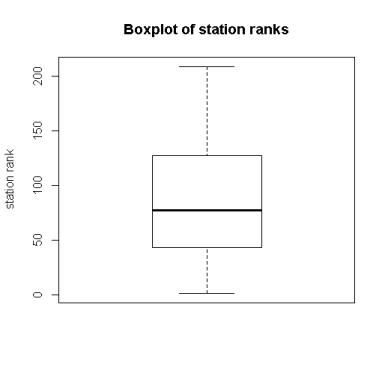 The modified boxplot of station ranks above identifies how many outliers?
A)0
B)1
C)2
D)3
The modified boxplot of station ranks above identifies how many outliers?A)0
B)1
C)2
D)3
Question
Question

Unlock Deck
Sign up to unlock the cards in this deck!
Unlock Deck
Unlock Deck
1/44
Play
Full screen (f)
Deck 3: Describing Distributions With Numbers
1
The exam scores (out of 100 points) for all students taking an introductory statistics course are used to construct the following boxplot: If 5 points were added to each score, then standard deviation of the new scores would:
A)be increased by 5.
B)be increased by 25.
C)be decreased by 5.
D)remain unchanged.
If 5 points were added to each score, then standard deviation of the new scores would:A)be increased by 5.
B)be increased by 25.
C)be decreased by 5.
D)remain unchanged.
remain unchanged.
2
The percent of observations above the third quartile in a distribution is:
A)25%.
B)50%.
C)75%.
D)None of the answer options is correct.
A)25%.
B)50%.
C)75%.
D)None of the answer options is correct.
25%.
3
A sample was taken of the salaries of 20 employees of a large company. The following is a boxplot of the salaries (in thousands of dollars) for this year. Based on this boxplot, which of the following statements is true?
A)The outliers are 28 and 77.
B)Suspected outliers would be less than 28 or greater than 77, so there are none.
C)Suspected outliers would be less than 6.75 or greater than 92.75, so there are none.
D)There are outliers, but they are not shown in the boxplot.
Based on this boxplot, which of the following statements is true?A)The outliers are 28 and 77.
B)Suspected outliers would be less than 28 or greater than 77, so there are none.
C)Suspected outliers would be less than 6.75 or greater than 92.75, so there are none.
D)There are outliers, but they are not shown in the boxplot.
Suspected outliers would be less than 6.75 or greater than 92.75, so there are none.
4
A violin student records the number of hours she spends practicing during each of nine consecutive weeks: What is the first quartile for these data?
A)5.00 hours
B)5.76 hours
C)7.20 hours
D)4.65 hours
What is the first quartile for these data?A)5.00 hours
B)5.76 hours
C)7.20 hours
D)4.65 hours
Unlock Deck
Unlock for access to all 44 flashcards in this deck.
Unlock Deck
k this deck
5
A sample was taken of the salaries of 20 employees of a large company. The following is a boxplot of the salaries (in thousands of dollars) for this year. Based on this boxplot, the five-number summary (in thousands of dollars) is:
A)28, 39, 48, 60.5, 77.
B)28, 41, 48, 58, 77.
C)28, 39, 51, 58, 77.
D)28, 41, 51, 60.5, 77.
Based on this boxplot, the five-number summary (in thousands of dollars) is:A)28, 39, 48, 60.5, 77.
B)28, 41, 48, 58, 77.
C)28, 39, 51, 58, 77.
D)28, 41, 51, 60.5, 77.
Unlock Deck
Unlock for access to all 44 flashcards in this deck.
Unlock Deck
k this deck
6
Which of the following is likely to have a mean that is smaller than the median?
A)the salaries of all National Football League players, where a few players make much more than most players
B)the scores of students (out of 100 points)on a very easy exam, in which most scores are high but a few scores are low
C)the prices of homes in a large city, where there are lots of relatively inexpensive homes and a few very expensive homes
D)the scores of students (out of 100 points)on a very difficult exam, in which most scores are low but a few scores are high
Unlock Deck
Unlock for access to all 44 flashcards in this deck.
Unlock Deck
k this deck
7
The average salary of all female workers at a large plant is $35,000. The average salary of all male workers at the plant is $41,000. If there are more female workers than male workers at the plant, then the average salary at the plant must be:
A)exactly $38,000.
B)larger than $38,000.
C)smaller than $38,000.
D)larger than $41,000.
A)exactly $38,000.
B)larger than $38,000.
C)smaller than $38,000.
D)larger than $41,000.
Unlock Deck
Unlock for access to all 44 flashcards in this deck.
Unlock Deck
k this deck
8
A violin student records the number of hours she spends practicing during each of nine consecutive weeks: What is the interquartile range (IQR) for these data?
A)3.00 hours
B)2.65 hours
C)3.20 hours
D)1.65 hours
What is the interquartile range (IQR) for these data?A)3.00 hours
B)2.65 hours
C)3.20 hours
D)1.65 hours
Unlock Deck
Unlock for access to all 44 flashcards in this deck.
Unlock Deck
k this deck
9
A violin student records the number of hours she spends practicing during each of nine consecutive weeks: Considering the smallest data value (1.2) and using the 1.5 × IQR rule, we would:
A)classify the value 1.2 as an outlier, because it is more than 1.5 × IQR below the first quartile.
B)not classify the value 1.2 as an outlier, because it is not more than 1.5 × IQR below the first quartile.
C)classify the value 1.2 as an outlier, because it is more than 1.5 × IQR below the median.
D)classify the value 1.2 as an outlier, because it is more than 1.5 × IQR below the mean.
Considering the smallest data value (1.2) and using the 1.5 × IQR rule, we would:A)classify the value 1.2 as an outlier, because it is more than 1.5 × IQR below the first quartile.
B)not classify the value 1.2 as an outlier, because it is not more than 1.5 × IQR below the first quartile.
C)classify the value 1.2 as an outlier, because it is more than 1.5 × IQR below the median.
D)classify the value 1.2 as an outlier, because it is more than 1.5 × IQR below the mean.
Unlock Deck
Unlock for access to all 44 flashcards in this deck.
Unlock Deck
k this deck
10
The 18 faculty members in a college math department range in age from 32 to 68. A stemplot follows: The 1.5 × IQR rule would identify an age as a high outlier if it exceeded:
A)19 years.
B)28.5 years.
C)77 years.
D)86.5 years.
The 1.5 × IQR rule would identify an age as a high outlier if it exceeded:A)19 years.
B)28.5 years.
C)77 years.
D)86.5 years.
Unlock Deck
Unlock for access to all 44 flashcards in this deck.
Unlock Deck
k this deck
11
The 18 faculty members in a college math department range in age from 32 to 68. A stemplot follows: The first and third quartiles of the ages of the faculty members are:
A)38 and 57 years.
B)39 and 57 years.
C)39 and 58 years.
D)40 and 58 years.
The first and third quartiles of the ages of the faculty members are:A)38 and 57 years.
B)39 and 57 years.
C)39 and 58 years.
D)40 and 58 years.
Unlock Deck
Unlock for access to all 44 flashcards in this deck.
Unlock Deck
k this deck
12
The exam scores (out of 100 points) for all students taking an introductory statistics course are used to construct the following boxplot: Based on this boxplot, which of the following statements is true?
A)The distribution of scores is fairly symmetric.
B)About half the students scored below 63.
C)Nobody scored below 25.
D)All of the answer options are correct.
Based on this boxplot, which of the following statements is true?A)The distribution of scores is fairly symmetric.
B)About half the students scored below 63.
C)Nobody scored below 25.
D)All of the answer options are correct.
Unlock Deck
Unlock for access to all 44 flashcards in this deck.
Unlock Deck
k this deck
13
The 18 faculty members in a college math department range in age from 32 to 68. A stemplot follows: The median age of the faculty members is:
A)39 years.
B)45 years.
C)47.5 years.
D)49 years.
The median age of the faculty members is:A)39 years.
B)45 years.
C)47.5 years.
D)49 years.
Unlock Deck
Unlock for access to all 44 flashcards in this deck.
Unlock Deck
k this deck
14
A violin student records the number of hours she spends practicing during each of nine consecutive weeks: What is the mean number of hours spent practicing per week during this period?
A)6.15 hours
B)5.76 hours
C)6.20 hours
D)8.40 hours
What is the mean number of hours spent practicing per week during this period?A)6.15 hours
B)5.76 hours
C)6.20 hours
D)8.40 hours
Unlock Deck
Unlock for access to all 44 flashcards in this deck.
Unlock Deck
k this deck
15
The exam scores (out of 100 points) for all students taking an introductory statistics course are used to construct the following boxplot: If each person increased his or her score by 5 points, then:
A)the third quartile would increase by 5 points.
B)the median score would increase by 5 points.
C)the interquartile range would remain unchanged.
D)All of the answer options are correct.
If each person increased his or her score by 5 points, then:A)the third quartile would increase by 5 points.
B)the median score would increase by 5 points.
C)the interquartile range would remain unchanged.
D)All of the answer options are correct.
Unlock Deck
Unlock for access to all 44 flashcards in this deck.
Unlock Deck
k this deck
16
The 18 faculty members in a college math department range in age from 32 to 68. A stemplot follows: The 1.5 × IQR rule would identify an age as a low outlier if it was less than:
A)32 years.
B)28.5 years.
C)19 years.
D)10.5 years.
The 1.5 × IQR rule would identify an age as a low outlier if it was less than:A)32 years.
B)28.5 years.
C)19 years.
D)10.5 years.
Unlock Deck
Unlock for access to all 44 flashcards in this deck.
Unlock Deck
k this deck
17
For each of the states and Puerto Rico, the histogram below shows the average property damage (in millions of dollars) caused by tornadoes over a 50-year period. From the histogram, the first quartile must be:
A)in the interval 0-10.
B)in the interval 10-20.
C)in the interval 30-40.
D)greater than 10.
From the histogram, the first quartile must be:A)in the interval 0-10.
B)in the interval 10-20.
C)in the interval 30-40.
D)greater than 10.
Unlock Deck
Unlock for access to all 44 flashcards in this deck.
Unlock Deck
k this deck
18
A violin student records the number of hours she spends practicing during each of nine consecutive weeks: What is the median number of hours spent practicing per week during this period?
A)6.15 hours
B)5.76 hours
C)6.20 hours
D)8.40 hours
What is the median number of hours spent practicing per week during this period?A)6.15 hours
B)5.76 hours
C)6.20 hours
D)8.40 hours
Unlock Deck
Unlock for access to all 44 flashcards in this deck.
Unlock Deck
k this deck
19
A sample was taken of the salaries of 20 employees of a large company. The following is a boxplot of the salaries (in thousands of dollars) for this year. Based on this boxplot, which of the following statements is true?
A)The interquartile range is about $20,000.
B)The minimum salary is $20,000.
C)The range of the salaries is about $75,000.
D)The median salary is about $40,000.
Based on this boxplot, which of the following statements is true?A)The interquartile range is about $20,000.
B)The minimum salary is $20,000.
C)The range of the salaries is about $75,000.
D)The median salary is about $40,000.
Unlock Deck
Unlock for access to all 44 flashcards in this deck.
Unlock Deck
k this deck
20
The 18 faculty members in a college math department range in age from 32 to 68. A stemplot follows: If the eldest faculty member retires and is replaced by a 26-year-old, the median age will:
A)decrease by 2 years.
B)stay the same.
C)increase by 2 years.
D)increase by 4 years.
If the eldest faculty member retires and is replaced by a 26-year-old, the median age will:A)decrease by 2 years.
B)stay the same.
C)increase by 2 years.
D)increase by 4 years.
Unlock Deck
Unlock for access to all 44 flashcards in this deck.
Unlock Deck
k this deck
21
Student ages (to the nearest year) in a school are as follows: What is true about the median age?
A)It is 20.
B)It would remain unchanged if the 32-year-old was replaced with an 80-year-old.
C)It is between the first and third quartiles.
D)All of the answer options are correct.
What is true about the median age?A)It is 20.
B)It would remain unchanged if the 32-year-old was replaced with an 80-year-old.
C)It is between the first and third quartiles.
D)All of the answer options are correct.
Unlock Deck
Unlock for access to all 44 flashcards in this deck.
Unlock Deck
k this deck
22
A teacher returns an exam with possible scores ranging from 0 to 100. The students suspect that the majority of them performed poorly on the exam and request summary statistics. The teacher provides the mean, which was 72, as a summary statistic. A total of 400 students took the exam. Some of the students find the mean to be high, based on talking to other students. They take a random sample of 15 students, and they find that the mean equals 71.5 while the median equals 62. Based on this result, we conclude that:
A)the boxplot is most likely symmetric about the mean.
B)the mean will be in the center of the boxplot.
C)the mean will be off center in the boxplot and above the median.
D)None of the answer options is correct.
A)the boxplot is most likely symmetric about the mean.
B)the mean will be in the center of the boxplot.
C)the mean will be off center in the boxplot and above the median.
D)None of the answer options is correct.
Unlock Deck
Unlock for access to all 44 flashcards in this deck.
Unlock Deck
k this deck
23
Enteroliths are calcifications that form in the gut of a horse. The stones can cause considerable morbidity and mortality. A study was conducted to investigate factors (such as diet and environment) that may be related to the formation of enteroliths. The study contained seven stallions; their ages (in years) are as follows: The youngest stallion, at 4 years old, is:
A)an outlier, because it is more than 15 years below the lower quartile.
B)an outlier, because it is the minimum.
C)not an outlier, because it is less than 15 years below the lower quartile.
D)not an outlier, because it is a positive value.
The youngest stallion, at 4 years old, is:A)an outlier, because it is more than 15 years below the lower quartile.
B)an outlier, because it is the minimum.
C)not an outlier, because it is less than 15 years below the lower quartile.
D)not an outlier, because it is a positive value.
Unlock Deck
Unlock for access to all 44 flashcards in this deck.
Unlock Deck
k this deck
24
Student ages (to the nearest year) in a school are as follows: What is true about the mean age?
A)It is less than 20.
B)It is greater than 20.
C)It is exactly 20.
D)It would remain unchanged if the 32-year-old was replaced with an 80-year-old.
What is true about the mean age?A)It is less than 20.
B)It is greater than 20.
C)It is exactly 20.
D)It would remain unchanged if the 32-year-old was replaced with an 80-year-old.
Unlock Deck
Unlock for access to all 44 flashcards in this deck.
Unlock Deck
k this deck
25
A survey of 10 students was conducted to investigate the amount of time they spend on social media each day. Students were given a timer and asked to record the number of minutes spent every time they accessed social media. The students' total times for one day are given below (in minutes). The five-number summary for these data is:
A)63, 88.6, 105, 42, 145.
B)45, 88, 88.6, 105, 145.
C)45, 63, 92, 105, 145.
D)45, 63, 88, 105, 145.
The five-number summary for these data is:A)63, 88.6, 105, 42, 145.
B)45, 88, 88.6, 105, 145.
C)45, 63, 92, 105, 145.
D)45, 63, 88, 105, 145.
Unlock Deck
Unlock for access to all 44 flashcards in this deck.
Unlock Deck
k this deck
26
A survey of 10 students was conducted to investigate the amount of time they spend on social media each day. Students were given a timer and asked to record the number of minutes spent every time they accessed social media. The students' total times for one day are given below (in minutes). The mean for these data is:
A)84.3.
B)88.6.
C)92.4.
D)88.0.
The mean for these data is:A)84.3.
B)88.6.
C)92.4.
D)88.0.
Unlock Deck
Unlock for access to all 44 flashcards in this deck.
Unlock Deck
k this deck
27
The following is a sample of the percent increase in five growth funds over a one-year period. The mean percent increase in this sample is:
A)11.8%.
B)12.2%.
C)13.7%.
D)14.1%.
The mean percent increase in this sample is:A)11.8%.
B)12.2%.
C)13.7%.
D)14.1%.
Unlock Deck
Unlock for access to all 44 flashcards in this deck.
Unlock Deck
k this deck
28
A teacher returns an exam with possible scores ranging from 0 to 100. The students suspect that the majority of them performed poorly on the exam and request summary statistics. The teacher provides the mean, which was 72, as a summary statistic. A total of 400 students took the exam. Some of the students find the mean to be high, based on talking to other students. They take a random sample of 15 students, and they find that the mean equals 71.5 while the median equals 62. Based on this result, we conclude that:
A)there are possibly some large outliers in these data.
B)exam scores are likely right-skewed.
C)50% of the students barely managed to pass the exam.
D)All of the answer options are correct.
A)there are possibly some large outliers in these data.
B)exam scores are likely right-skewed.
C)50% of the students barely managed to pass the exam.
D)All of the answer options are correct.
Unlock Deck
Unlock for access to all 44 flashcards in this deck.
Unlock Deck
k this deck
29
Enteroliths are calcifications that form in the gut of a horse. The stones can cause considerable morbidity and mortality. A study was conducted to investigate the factors (such as diet and environment) that may be related to the formation of enteroliths. The study contained 62 horses with enteroliths (cases) and 75 horses without (controls). The graph below contains side-by-side boxplots of the ages for cases and controls. Based on the boxplots, the mean age for the cases:
A)is lower than the mean age for the controls.
B)is approximately the same as the mean age for the controls.
C)is higher than the mean age for the controls.
D)cannot be determined from boxplots.
Based on the boxplots, the mean age for the cases:A)is lower than the mean age for the controls.
B)is approximately the same as the mean age for the controls.
C)is higher than the mean age for the controls.
D)cannot be determined from boxplots.
Unlock Deck
Unlock for access to all 44 flashcards in this deck.
Unlock Deck
k this deck
30
A survey of 10 students was conducted to investigate the amount of time they spend on social media each day. Students were given a timer and asked to record the number of minutes spent every time they accessed social media. The students' total times for one day are given below (in minutes). The standard deviation for these data is:
A)29.9.
B)893.41.
C)28.4.
D)804.29.
The standard deviation for these data is:A)29.9.
B)893.41.
C)28.4.
D)804.29.
Unlock Deck
Unlock for access to all 44 flashcards in this deck.
Unlock Deck
k this deck
31
Enteroliths are calcifications that form in the gut of a horse. The stones can cause considerable morbidity and mortality. A study was conducted to investigate factors (such as diet and environment) that may be related to the formation of enteroliths. The study contained 62 horses with enteroliths (cases) and 75 horses without (controls). The graph below contains side-by-side boxplots of the percent of alfalfa in the diet for cases and controls. Based on the boxplot for cases, the distribution of the amount of alfalfa in the diet is:
A)highly skewed left.
B)highly skewed right.
C)symmetric.
D)None of the answer options is correct.
Based on the boxplot for cases, the distribution of the amount of alfalfa in the diet is:A)highly skewed left.
B)highly skewed right.
C)symmetric.
D)None of the answer options is correct.
Unlock Deck
Unlock for access to all 44 flashcards in this deck.
Unlock Deck
k this deck
32
In a class of 100 students, the grades on an accounting test are summarized in the following frequency table: The distribution of grades is:
A)symmetric.
B)skewed left.
C)skewed right.
D)not able to be determined from the information given.
The distribution of grades is:A)symmetric.
B)skewed left.
C)skewed right.
D)not able to be determined from the information given.
Unlock Deck
Unlock for access to all 44 flashcards in this deck.
Unlock Deck
k this deck
33
The following histogram represents the distribution of acceptance rates (percent accepted) among 25 business schools in 2004. In each class interval, the left endpoint but not the right is included, so the class intervals are 10 rate < 15, 15 rate < 20, etc. Which of the following could be the five-number summary for these data?
A)10, 22, 31, 39, 50
B)10, 20, 30, 40, 50
C)10, 26, 31, 34, 50
D)10, 22, 31, 29, 39
Which of the following could be the five-number summary for these data?A)10, 22, 31, 39, 50
B)10, 20, 30, 40, 50
C)10, 26, 31, 34, 50
D)10, 22, 31, 29, 39
Unlock Deck
Unlock for access to all 44 flashcards in this deck.
Unlock Deck
k this deck
34
Enteroliths are calcifications that form in the gut of a horse. The stones can cause considerable morbidity and mortality. A study was conducted to investigate factors (such as diet and environment) that may be related to the formation of enteroliths. The study contained 62 horses with enteroliths (cases) and 75 horses without (controls). The graph below contains side-by-side boxplots of the percent of alfalfa in the diet for cases and controls.
Based on the boxplot cases, the median amount of alfalfa in the diet of cases is:
A)the same as for controls.
B)half the amount as for controls.
C)twice the amount as for controls.
D)None of the answer options is correct.
Based on the boxplot cases, the median amount of alfalfa in the diet of cases is:
A)the same as for controls.
B)half the amount as for controls.
C)twice the amount as for controls.
D)None of the answer options is correct.
Unlock Deck
Unlock for access to all 44 flashcards in this deck.
Unlock Deck
k this deck
35
The following histogram represents the distribution of acceptance rates (percent accepted) among 25 business schools in 2004. In each class interval, the left endpoint but not the right is included, so the class intervals are 10 rate < 15, 15 rate < 20, etc. What is the median acceptance rate?
A)20%
B)just below 30%
C)just above 30%
D)40%
What is the median acceptance rate?A)20%
B)just below 30%
C)just above 30%
D)40%
Unlock Deck
Unlock for access to all 44 flashcards in this deck.
Unlock Deck
k this deck
36
The median age of five people in a meeting is 30 years. One of the people, whose age is 50 years, leaves the room. The median age of the remaining four people in the room is:
A)40 years.
B)30 years.
C)25 years.
D)not able to be determined from the information given.
A)40 years.
B)30 years.
C)25 years.
D)not able to be determined from the information given.
Unlock Deck
Unlock for access to all 44 flashcards in this deck.
Unlock Deck
k this deck
37
There are three children in a room, ages 3, 4, and 5. If another 4-year-old enters the room:
A)the mean age will stay the same, but the variance will increase.
B)the mean age will stay the same, but the variance will decrease.
C)the mean age and variance will stay the same.
D)the mean age and variance will increase.
A)the mean age will stay the same, but the variance will increase.
B)the mean age will stay the same, but the variance will decrease.
C)the mean age and variance will stay the same.
D)the mean age and variance will increase.
Unlock Deck
Unlock for access to all 44 flashcards in this deck.
Unlock Deck
k this deck
38
In a class of 100 students, the grades on an accounting test are summarized in the following frequency table: The median grade is in which of the following intervals?
A)61-70
B)71-80
C)81-90
D)91-100
The median grade is in which of the following intervals?A)61-70
B)71-80
C)81-90
D)91-100
Unlock Deck
Unlock for access to all 44 flashcards in this deck.
Unlock Deck
k this deck
39
Which of the following sets of four numbers has the smallest standard deviation?
A)7, 8, 9, 10
B)5, 5, 5, 6
C)0, 0, 10, 10
D)0, 1, 2, 3
A)7, 8, 9, 10
B)5, 5, 5, 6
C)0, 0, 10, 10
D)0, 1, 2, 3
Unlock Deck
Unlock for access to all 44 flashcards in this deck.
Unlock Deck
k this deck
40
A survey of 10 students was conducted to investigate the amount of time they spend on social media each day. Students were given a timer and asked to record the number of minutes spent every time they accessed social media. The students' total times for one day are given below (in minutes). A student who was not included in the survey recorded a time of 240 minutes on social media. That value is:
A)consistent with these data.
B)inconsistent with these data.
C)an outlier.
D)clearly an erroneous recording.
A student who was not included in the survey recorded a time of 240 minutes on social media. That value is:A)consistent with these data.
B)inconsistent with these data.
C)an outlier.
D)clearly an erroneous recording.
Unlock Deck
Unlock for access to all 44 flashcards in this deck.
Unlock Deck
k this deck
41
A survey of radio stations was conducted following the attacks on the World Trade Center in 2001. One of the variables recorded was the region in which the station was located (east, center, or west). In addition to the variable "region," the following information was collected: the quartile of the media market (top, second, third, and fourth), state, rank (a number between 1 and 205), and share (a number between 0 and 7). The side-by-side boxplots of station rank, above, show:
A)different median ranks between the regions.
B)more variability in ranks of coast stations.
C)similar minimum ranks between regions.
D)All of the answer options are correct.
The side-by-side boxplots of station rank, above, show:A)different median ranks between the regions.
B)more variability in ranks of coast stations.
C)similar minimum ranks between regions.
D)All of the answer options are correct.
Unlock Deck
Unlock for access to all 44 flashcards in this deck.
Unlock Deck
k this deck
42
A survey of radio stations was conducted following the attacks on the World Trade Center in 2001. One of the variables recorded was the region in which the station was located (east, center, or west). In addition to the variable "region," the following information was collected: the quartile of the media market (top, second, third, and fourth), state, rank (a number between 1 and 205), and share (a number between 0 and 7). The modified boxplot of station ranks above identifies how many outliers?
A)0
B)1
C)2
D)3
The modified boxplot of station ranks above identifies how many outliers?A)0
B)1
C)2
D)3
Unlock Deck
Unlock for access to all 44 flashcards in this deck.
Unlock Deck
k this deck
43
A modified boxplot for a right-skewed data set uses a special character to point to:
A)the median.
B)the maximum.
C)the third quartile.
D)an outlier.
A)the median.
B)the maximum.
C)the third quartile.
D)an outlier.
Unlock Deck
Unlock for access to all 44 flashcards in this deck.
Unlock Deck
k this deck
44
A teacher returns an exam with possible scores ranging from 0 to 100. The students suspect that the majority of them performed poorly on the exam and request summary statistics. The teacher provides the mean, which was 72, as a summary statistic. A total of 400 students took the exam. The teacher, after several requests, provides a boxplot of the exam scores. The students can get which of the following pieces of information from this plot?
A)the median
B)the IQR
C)the minimum and the maximum
D)All of the answer options are correct.
A)the median
B)the IQR
C)the minimum and the maximum
D)All of the answer options are correct.
Unlock Deck
Unlock for access to all 44 flashcards in this deck.
Unlock Deck
k this deck
Unlock Deck
Unlock for access to all 44 flashcards in this deck.


