Exam 3: Describing Distributions With Numbers
Exam 1: Getting Started15 Questions
Exam 2: Picturing Distributions With Graphs36 Questions
Exam 3: Describing Distributions With Numbers44 Questions
Exam 4: The Normal Distributions37 Questions
Exam 5: Scatterplots and Correlation34 Questions
Exam 6: Two-Way Tables40 Questions
Exam 7: Producing Data- Sampling44 Questions
Exam 8: Producing Data- Experiments50 Questions
Exam 9: Data Ethics12 Questions
Exam 10: Introducing Probability66 Questions
Exam 11: General Rules of Probability52 Questions
Exam 12: Binomial Distributions39 Questions
Exam 13: Inference for Regression36 Questions
Exam 14: One-Way Analysis of Variance- Comparing Several Means28 Questions
Exam 15: Nonparametric Tests28 Questions
Exam 16: More on Analysis of Variance23 Questions
Select questions type
There are three children in a room, ages 3, 4, and 5. If another 4-year-old enters the room:
Free
(Multiple Choice)
4.8/5  (42)
(42)
Correct Answer: Verified
B
A violin student records the number of hours she spends practicing during each of nine consecutive weeks:  What is the interquartile range (IQR) for these data?
Free
(Multiple Choice)
4.8/5 (38)
Correct Answer:Verified
B
A teacher returns an exam with possible scores ranging from 0 to 100. The students suspect that the majority of them performed poorly on the exam and request summary statistics. The teacher provides the mean, which was 72, as a summary statistic. A total of 400 students took the exam. The teacher, after several requests, provides a boxplot of the exam scores. The students can get which of the following pieces of information from this plot?
Free
(Multiple Choice)
4.8/5 (36)
Correct Answer:Verified
D
The percent of observations above the third quartile in a distribution is:
(Multiple Choice)
4.9/5 (41)
Which of the following is likely to have a mean that is smaller than the median?
(Multiple Choice)
4.7/5 (24)
The exam scores (out of 100 points) for all students taking an introductory statistics course are used to construct the following boxplot: 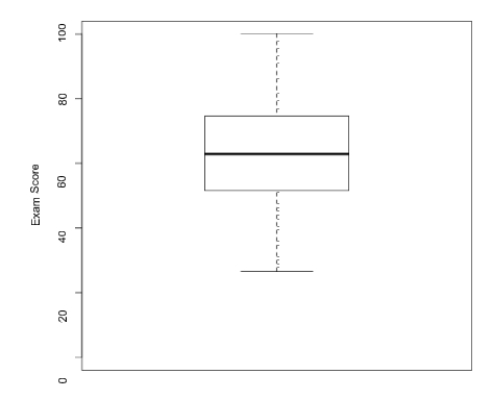 If each person increased his or her score by 5 points, then:
(Multiple Choice)
4.8/5 (35)
In a class of 100 students, the grades on an accounting test are summarized in the following frequency table:  The median grade is in which of the following intervals?
(Multiple Choice)
4.9/5 (38)
The 18 faculty members in a college math department range in age from 32 to 68. A stemplot follows:  The first and third quartiles of the ages of the faculty members are:
(Multiple Choice)
4.8/5 (27)
In a class of 100 students, the grades on an accounting test are summarized in the following frequency table:  The distribution of grades is:
(Multiple Choice)
4.8/5 (25)
Enteroliths are calcifications that form in the gut of a horse. The stones can cause considerable morbidity and mortality. A study was conducted to investigate the factors (such as diet and environment) that may be related to the formation of enteroliths. The study contained 62 horses with enteroliths (cases) and 75 horses without (controls). The graph below contains side-by-side boxplots of the ages for cases and controls. 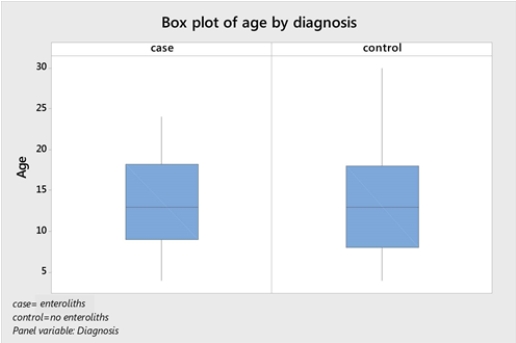 Based on the boxplots, the mean age for the cases:
(Multiple Choice)
4.8/5 (32)
A survey of 10 students was conducted to investigate the amount of time they spend on social media each day. Students were given a timer and asked to record the number of minutes spent every time they accessed social media. The students' total times for one day are given below (in minutes).  The mean for these data is:
(Multiple Choice)
4.9/5 (34)
Enteroliths are calcifications that form in the gut of a horse. The stones can cause considerable morbidity and mortality. A study was conducted to investigate factors (such as diet and environment) that may be related to the formation of enteroliths. The study contained 62 horses with enteroliths (cases) and 75 horses without (controls). The graph below contains side-by-side boxplots of the percent of alfalfa in the diet for cases and controls. 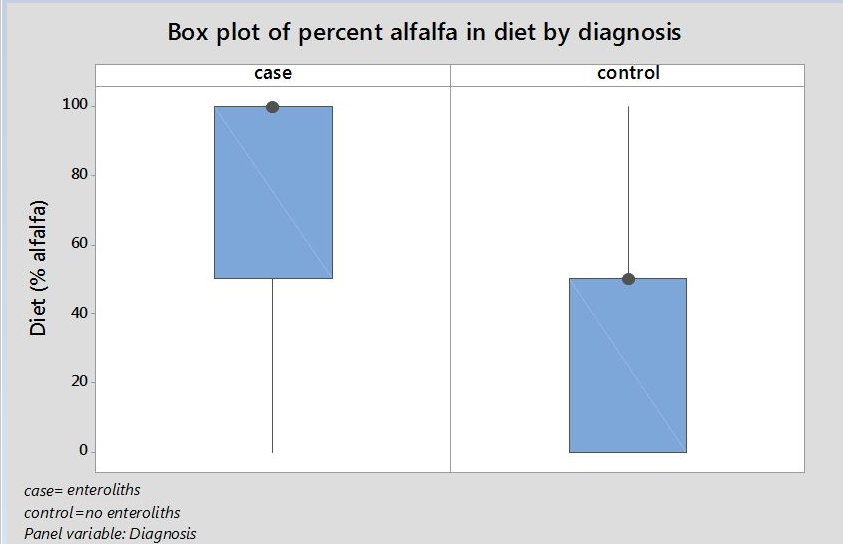 Based on the boxplot for cases, the distribution of the amount of alfalfa in the diet is:
(Multiple Choice)
4.7/5 (44)
Enteroliths are calcifications that form in the gut of a horse. The stones can cause considerable morbidity and mortality. A study was conducted to investigate factors (such as diet and environment) that may be related to the formation of enteroliths. The study contained seven stallions; their ages (in years) are as follows:  The youngest stallion, at 4 years old, is:
(Multiple Choice)
4.8/5 (40)
A sample was taken of the salaries of 20 employees of a large company. The following is a boxplot of the salaries (in thousands of dollars) for this year. 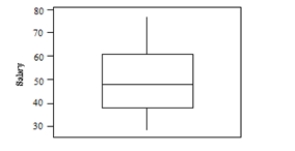 Based on this boxplot, which of the following statements is true?
(Multiple Choice)
4.9/5 (33)
A survey of radio stations was conducted following the attacks on the World Trade Center in 2001. One of the variables recorded was the region in which the station was located (east, center, or west). In addition to the variable "region," the following information was collected: the quartile of the media market (top, second, third, and fourth), state, rank (a number between 1 and 205), and share (a number between 0 and 7). 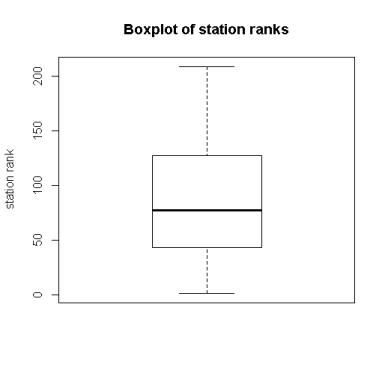 The modified boxplot of station ranks above identifies how many outliers?
(Multiple Choice)
4.8/5 (35)
A survey of radio stations was conducted following the attacks on the World Trade Center in 2001. One of the variables recorded was the region in which the station was located (east, center, or west). In addition to the variable "region," the following information was collected: the quartile of the media market (top, second, third, and fourth), state, rank (a number between 1 and 205), and share (a number between 0 and 7). 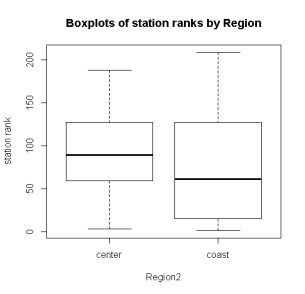 The side-by-side boxplots of station rank, above, show:
(Multiple Choice)
4.8/5 (38)
A modified boxplot for a right-skewed data set uses a special character to point to:
(Multiple Choice)
4.7/5 (34)
A sample was taken of the salaries of 20 employees of a large company. The following is a boxplot of the salaries (in thousands of dollars) for this year. 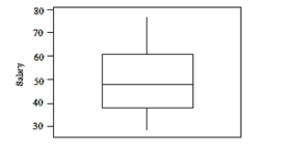 Based on this boxplot, which of the following statements is true?
(Multiple Choice)
4.8/5 (38)
A survey of 10 students was conducted to investigate the amount of time they spend on social media each day. Students were given a timer and asked to record the number of minutes spent every time they accessed social media. The students' total times for one day are given below (in minutes).  A student who was not included in the survey recorded a time of 240 minutes on social media. That value is:
(Multiple Choice)
4.9/5 (32)
The 18 faculty members in a college math department range in age from 32 to 68. A stemplot follows: 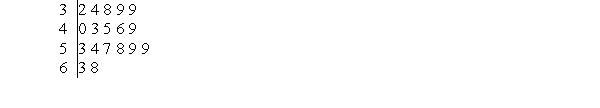 The 1.5 × IQR rule would identify an age as a low outlier if it was less than:
(Multiple Choice)
4.8/5 (33)
Filters
- Essay(0)
- Multiple Choice(0)
- Short Answer(0)
- True False(0)
- Matching(0)