Deck 6: Scatterplots, Association, and Correlation
Full screen (f)
Question
Consider the following to answer the question(s) below:
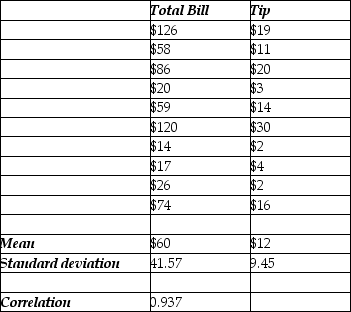
To determine whether the tip left at the end of a meal is related to the size of the total bill at their restaurant, Chez Michelle, data were gathered for 10 customers. The data and summary statistics are shown below.
Government sponsored research investigated the relationship between the number of hours individuals spend on the Internet and age. Which of the following statements is true?
A) Age is the predictor variable and number of hours spent on the Internet is the response variable.
B) Government is the predictor variable and the number of hours spent on the Internet is the response variable.
C) Age is the response variable and the number of hours spent on the Internet is the predictor variable.
D) Age is the predictor variable and government sponsored research is the response variable.
E) Number of individuals is the predictor variable and government sponsored research is the response variable.
Question
Consider the following to answer the question(s) below:
To determine whether the tip left at the end of a meal is related to the size of the total bill at their restaurant, Chez Michelle, data were gathered for 10 customers. The data and summary statistics are shown below.
In discussing how its customers use online services, a bank manager noted "there seems to be a strong correlation between the use of the online bill paying feature and gender". Which of the following is true regarding this statement?
A) The correlation between the use of online bill paying feature and gender is negative.
B) The correlation between the use of online bill paying feature and gender is positive.
C) There may be an association between the use of online bill paying feature and gender, but these variables are both categorical so they cannot be correlated.
D) More males will bank online compared with females.
E) More females will bank online compared with males.
Question
Consider the following to answer the question(s) below:
A consumer research group investigating the relationship between the price of meat (per kilogram) and the fat content (grams) gathered data that produced the following scatterplot.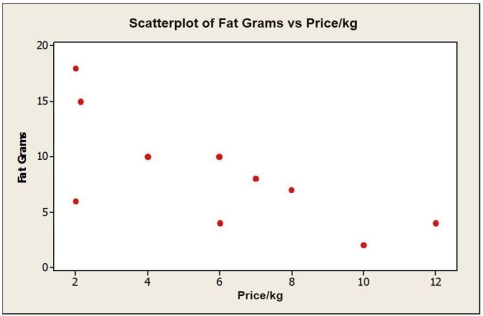
Which best describes the association between the price of meat and fat content?
A) Negative, moderately strong, linear
B) Negative, very weak, linear
C) Positive, strong, linear
D) Positive, weak, linear
E) Nonlinear
Question
Consider the following to answer the question(s) below:
To determine whether the tip left at the end of a meal is related to the size of the total bill at their restaurant, Chez Michelle, data were gathered for 10 customers. The data and summary statistics are shown below.
Shown below is a correlation table showing correlation coefficients between stock price, earnings per share (EPS), and the price/earnings (P/E) ratio for a sample of 19 publicly traded companies.
Correlation: Stock Price, EPS, P/E
 a. What is the correlation between stock price and EPS? Interpret.
b. What is the correlation between stock price and P/E? Interpret.
c. What is the correlation between EPS and P/E? Interpret.
To determine whether the tip left at the end of a meal is related to the size of the total bill at their restaurant, Chez Michelle, data were gathered for 10 customers. The data and summary statistics are shown below.
Shown below is a correlation table showing correlation coefficients between stock price, earnings per share (EPS), and the price/earnings (P/E) ratio for a sample of 19 publicly traded companies.
Correlation: Stock Price, EPS, P/E
a. What is the correlation between stock price and EPS? Interpret.b. What is the correlation between stock price and P/E? Interpret.
c. What is the correlation between EPS and P/E? Interpret.
Question
Consider the following to answer the question(s) below:
To determine whether the tip left at the end of a meal is related to the size of the total bill at their restaurant, Chez Michelle, data were gathered for 10 customers. The data and summary statistics are shown below.
The following scatterplot shows a relationship between x and y that results in a correlation coefficient of r = 0. Explain why r = 0 in this situation even though there appears to be a strong relationship between the x and y variables.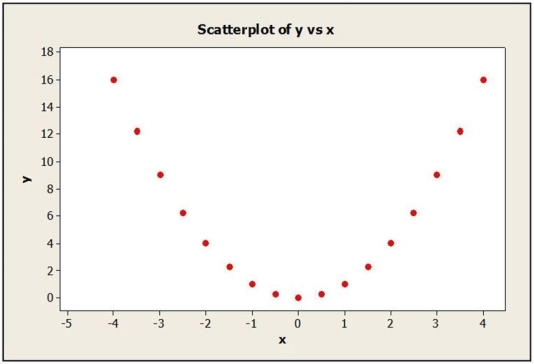
Question
Consider the following to answer the question(s) below:
To determine whether the tip left at the end of a meal is related to the size of the total bill at their restaurant, Chez Michelle, data were gathered for 10 customers. The data and summary statistics are shown below.
The following scatterplot shows monthly sales figures (in units) and number of months of experience on the job for a sample of 18 salespeople. a. Describe the association between monthly sales and level of experience.
b. Do these data satisfy the conditions for computing a correlation coefficient? Explain.
c. Estimate the correlation. Which value of r looks most probable: 0.1, 0.3, or 0.9?
To determine whether the tip left at the end of a meal is related to the size of the total bill at their restaurant, Chez Michelle, data were gathered for 10 customers. The data and summary statistics are shown below.
The following scatterplot shows monthly sales figures (in units) and number of months of experience on the job for a sample of 18 salespeople.
a. Describe the association between monthly sales and level of experience.b. Do these data satisfy the conditions for computing a correlation coefficient? Explain.
c. Estimate the correlation. Which value of r looks most probable: 0.1, 0.3, or 0.9?
Question
Consider the following to answer the question(s) below:
To determine whether the tip left at the end of a meal is related to the size of the total bill at their restaurant, Chez Michelle, data were gathered for 10 customers. The data and summary statistics are shown below.
A study examined consumption levels of oil and carbon dioxide emissions for a sample of municipalities. The response variable in this study is
A) oil brands.
B) oil consumption levels.
C) carbon dioxide emissions.
D) municipalities.
E) oil prices.
Question
Consider the following to answer the question(s) below:
To determine whether the tip left at the end of a meal is related to the size of the total bill at their restaurant, Chez Michelle, data were gathered for 10 customers. The data and summary statistics are shown below.
The following scatterplot shows Internet Usage and PC household adoption rate (per 100 inhabitants) for a sample of 15 countries.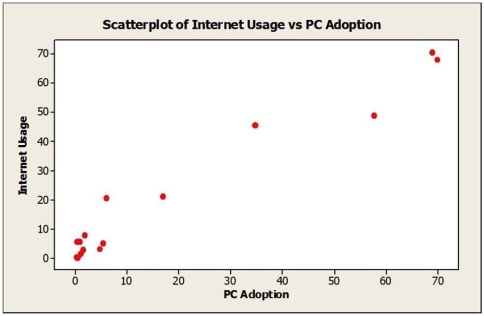 a. Describe the association between Internet usage and PC household adoption rate.
b. Do these data satisfy the conditions for computing a correlation coefficient? Explain.
c. Estimate the correlation. Which value of r looks most probable: 0.1, 0.3, or 0.9?
To determine whether the tip left at the end of a meal is related to the size of the total bill at their restaurant, Chez Michelle, data were gathered for 10 customers. The data and summary statistics are shown below.
The following scatterplot shows Internet Usage and PC household adoption rate (per 100 inhabitants) for a sample of 15 countries.
a. Describe the association between Internet usage and PC household adoption rate.b. Do these data satisfy the conditions for computing a correlation coefficient? Explain.
c. Estimate the correlation. Which value of r looks most probable: 0.1, 0.3, or 0.9?
Question
Consider the following to answer the question(s) below:
The following scatterplot shows monthly sales figures (in units) and the number of months of experience on the job for a sample of 18 salespeople.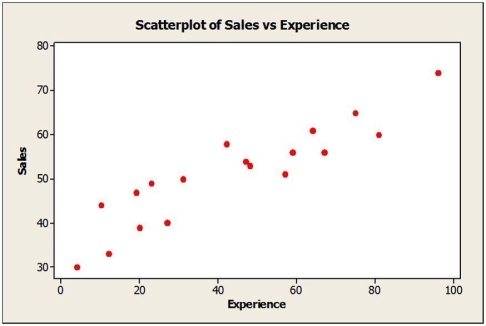
The correlation coefficient between monthly sales and number of months of experience is most likely
A) -0.235.
B) 0.
C) 0.180.
D) -0.914.
E) 0.914.
The following scatterplot shows monthly sales figures (in units) and the number of months of experience on the job for a sample of 18 salespeople.
The correlation coefficient between monthly sales and number of months of experience is most likely
A) -0.235.
B) 0.
C) 0.180.
D) -0.914.
E) 0.914.
Question
Consider the following to answer the question(s) below:
To determine whether the tip left at the end of a meal is related to the size of the total bill at their restaurant, Chez Michelle, data were gathered for 10 customers. The data and summary statistics are shown below.
Based on the scatterplots shown below, describe the association between x and y.
a.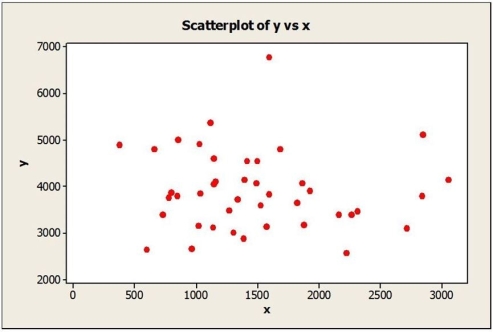 b.
b. 
To determine whether the tip left at the end of a meal is related to the size of the total bill at their restaurant, Chez Michelle, data were gathered for 10 customers. The data and summary statistics are shown below.
Based on the scatterplots shown below, describe the association between x and y.
a.
b. Question
Consider the following to answer the question(s) below:
The following scatterplot shows monthly sales figures (in units) and the number of months of experience on the job for a sample of 18 salespeople.
The association between monthly sales and number of months of experience can be described as
A) positive and weak.
B) negative and weak.
C) negative and strong.
D) positive and strong.
E) nonlinear.
Question
Consider the following to answer the question(s) below:
To determine whether the tip left at the end of a meal is related to the size of the total bill at their restaurant, Chez Michelle, data were gathered for 10 customers. The data and summary statistics are shown below.
In discussing how its customers use online services, a bank manager noted "there seems to be a strong correlation between the use of the online bill paying feature and gender". Comment on this statement.
Question
Consider the following to answer the question(s) below:
To determine whether the tip left at the end of a meal is related to the size of the total bill at their restaurant, Chez Michelle, data were gathered for 10 customers. The data and summary statistics are shown below.
In commenting on the increase in home foreclosures, a news reporter stated "there appears to be a strong correlation between home foreclosures and job loss of the head of household." Comment on this statement.
Question
Consider the following to answer the question(s) below:
To determine whether the tip left at the end of a meal is related to the size of the total bill at their restaurant, Chez Michelle, data were gathered for 10 customers. The data and summary statistics are shown below.
A supermarket chain gathers data on the amount they spend on promotional material (specials, coupons, etc.) and sales revenue generated each quarter. The predictor variable is
A) sales revenue.
B) amount spent on promotional material.
C) number of coupons offered.
D) supermarket chains.
E) number of quarter.
Question
Consider the following to answer the question(s) below:
A consumer research group investigating the relationship between the price of meat (per kilogram) and the fat content (grams) gathered data that produced the following scatterplot.
If the point in the lower left hand corner ($2.00 per kilogram, 6 grams of fat) were removed, the correlation would most likely
A) remain the same.
B) become stronger negative.
C) become weaker negative.
D) become positive.
E) become nonlinear.
Question
Consider the following to answer the question(s) below:
To determine whether the tip left at the end of a meal is related to the size of the total bill at their restaurant, Chez Michelle, data were gathered for 10 customers. The data and summary statistics are shown below.
A consumer research group investigating the relationship between the price of meat (per kilogram) and the fat content (grams) gathered data that produced the following scatterplot.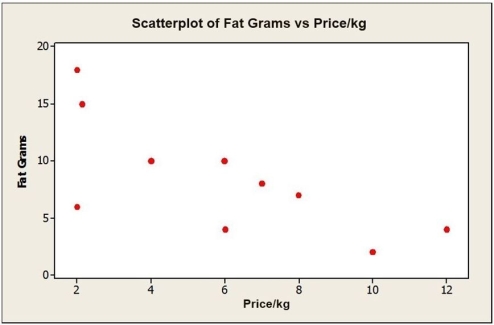 a. Describe the association between the price of meat and fat content.
b. Estimate the correlation. Which value of r looks most probable: -0.9, -0.5, or -0.1?
c. If the point in the lower left hand corner ($2.00 per kilogram, 6 grams of fat) is removed, would the correlation become stronger, weaker, or remain the same? Explain.
To determine whether the tip left at the end of a meal is related to the size of the total bill at their restaurant, Chez Michelle, data were gathered for 10 customers. The data and summary statistics are shown below.
A consumer research group investigating the relationship between the price of meat (per kilogram) and the fat content (grams) gathered data that produced the following scatterplot.
a. Describe the association between the price of meat and fat content.b. Estimate the correlation. Which value of r looks most probable: -0.9, -0.5, or -0.1?
c. If the point in the lower left hand corner ($2.00 per kilogram, 6 grams of fat) is removed, would the correlation become stronger, weaker, or remain the same? Explain.
Question
Consider the following to answer the question(s) below:
To determine whether the tip left at the end of a meal is related to the size of the total bill at their restaurant, Chez Michelle, data were gathered for 10 customers. The data and summary statistics are shown below.
Based on the scatterplots shown below, describe the association between x and y.
a.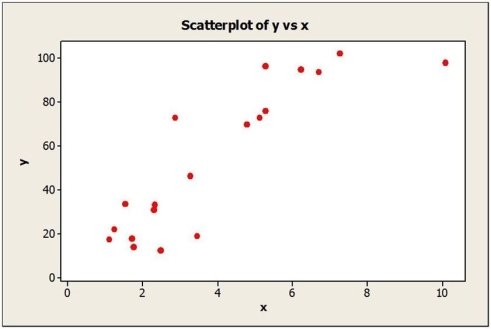 b.
b. 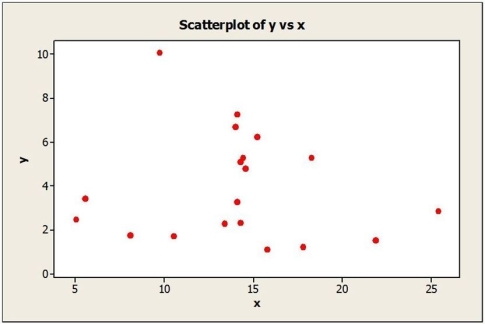
To determine whether the tip left at the end of a meal is related to the size of the total bill at their restaurant, Chez Michelle, data were gathered for 10 customers. The data and summary statistics are shown below.
Based on the scatterplots shown below, describe the association between x and y.
a.
b. Question
Consider the following to answer the question(s) below:
To determine whether the tip left at the end of a meal is related to the size of the total bill at their restaurant, Chez Michelle, data were gathered for 10 customers. The data and summary statistics are shown below.
For each of the following scenarios, indicate which is the predictor variable and which is the response variable.
a. A supermarket chain gathers data on the amount they spend on promotional material (specials, coupons, etc.) and sales revenue generated each quarter.
b. Government sponsored research investigated the relationship between the number of hours individuals spend on the Internet and age.
c. A real estate association conducted a study on home prices and economic strength for different regions of Canada.
Question
Consider the following to answer the question(s) below:
To determine whether the tip left at the end of a meal is related to the size of the total bill at their restaurant, Chez Michelle, data were gathered for 10 customers. The data and summary statistics are shown below.
Shown below is a correlation table showing correlation coefficients between population (in millions), PC household adoption rate and cell phone adoption rate for a sample of 16 countries.
Correlation: PC Adoption, Cell Phone Adoption, Population
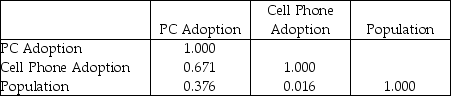 a. What is the correlation between PC household adoption rate and population? Interpret.
b. What is the correlation between cell phone adoption rate and population? Interpret.
c. What is the correlation between PC household adoption rate and cell phone adoption rate? Interpret.
To determine whether the tip left at the end of a meal is related to the size of the total bill at their restaurant, Chez Michelle, data were gathered for 10 customers. The data and summary statistics are shown below.
Shown below is a correlation table showing correlation coefficients between population (in millions), PC household adoption rate and cell phone adoption rate for a sample of 16 countries.
Correlation: PC Adoption, Cell Phone Adoption, Population
a. What is the correlation between PC household adoption rate and population? Interpret.b. What is the correlation between cell phone adoption rate and population? Interpret.
c. What is the correlation between PC household adoption rate and cell phone adoption rate? Interpret.
Question
Consider the following to answer the question(s) below:
To determine whether the tip left at the end of a meal is related to the size of the total bill at their restaurant, Chez Michelle, data were gathered for 10 customers. The data and summary statistics are shown below.
For each of the following scenarios, indicate which is the predictor variable and which is the response variable.
a. A study examined consumption levels of oil and carbon dioxide emissions for a sample of municipalities.
b. Data were collected on job performance rating and hours of training for a sample of employees at a telecommunications repair facility.
c. Salary data as well as years of managerial experience were collected for a sample of executives in the high tech industry.
Question
Consider the following to answer the question(s) below:
A consumer research group investigating the relationship between the price of meat (per kilogram) and the fat content (grams) gathered data that produced the following scatterplot.
A perfect correlation between two variables will always produce which of the following?
A) a correlation coefficient of -1.0
B) a scatterplot with a pattern running from lower left to upper right
C) a correlation coefficient of 1.0
D) a scatterplot where all points lie on a single straight line
E) a scatterplot with a pattern running from upper left to lower right
Question
Consider the following to answer the question(s) below:
A consumer research group investigating the relationship between the price of meat (per kilogram) and the fat content (grams) gathered data that produced the following scatterplot.
Consider the following sample data. The standard deviations from the data are 3.67 for Y, and 45.28 for X. These sample data are shown as follows: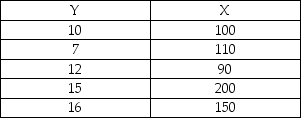 Given this data, the sample correlation is approximately
A) 0.68.
B) 0.54.
C) 0.16.
D) 0.39.
E) 0.20.
A consumer research group investigating the relationship between the price of meat (per kilogram) and the fat content (grams) gathered data that produced the following scatterplot.
Consider the following sample data. The standard deviations from the data are 3.67 for Y, and 45.28 for X. These sample data are shown as follows:
Given this data, the sample correlation is approximatelyA) 0.68.
B) 0.54.
C) 0.16.
D) 0.39.
E) 0.20.
Question
Consider the following to answer the question(s) below:
A consumer research group investigating the relationship between the price of meat (per kilogram) and the fat content (grams) gathered data that produced the following scatterplot.
In a university statistics course a correlation coefficient of -0.8 was found between the number of classes missed and the course grade. This can be interpreted to mean that
A) the more classes missed, the lower the course grade.
B) a lower course grade is caused by missing more classes.
C) the correlation is strong and positive.
D) a higher grade can be achieved by missing fewer classes.
E) the more classes missed, the higher the course grade.
Question
Consider the following to answer the question(s) below:
A consumer research group investigating the relationship between the price of meat (per kilogram) and the fat content (grams) gathered data that produced the following scatterplot.
Assume that a medical research study found a correlation coefficient of -0.73 between regular use of sunscreen and the skin cancer rate. This could be interpreted to mean that
A) the greater the regular use of sunscreen, the lower the person's chances of getting skin cancer.
B) skin cancer is caused by not using sunscreen regularly.
C) the greater the regular use of sunscreen, the higher the person's chances of getting skin cancer.
D) skin cancer can be prevented by regular use of sunscreen.
E) the lower the regular use of sunscreen, the lower the person's chances of getting skin cancer.
Question
Consider the following to answer the question(s) below:
A consumer research group investigating the relationship between the price of meat (per kilogram) and the fat content (grams) gathered data that produced the following scatterplot.
The University recently sampled five full time students who work off campus in order to look at their GPA and their work schedules. The standard deviation for GPA is 0.91 and the standard deviation for hours worked is 6.78. These sample data are shown as follows: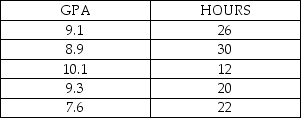 Given these data the sample correlation is
A) -0.49.
B) -0.39.
C) -0.42.
D) -0.34.
E) -0.36.
A consumer research group investigating the relationship between the price of meat (per kilogram) and the fat content (grams) gathered data that produced the following scatterplot.
The University recently sampled five full time students who work off campus in order to look at their GPA and their work schedules. The standard deviation for GPA is 0.91 and the standard deviation for hours worked is 6.78. These sample data are shown as follows:
Given these data the sample correlation isA) -0.49.
B) -0.39.
C) -0.42.
D) -0.34.
E) -0.36.
Question
Consider the following to answer the question(s) below:
A consumer research group investigating the relationship between the price of meat (per kilogram) and the fat content (grams) gathered data that produced the following scatterplot.
A study was done in which the daily temperature and the number of traffic accidents within the city were recorded. The standard deviations for the samples are 13.13 for temperature and 2.55 for accidents. These sample data are shown as follows: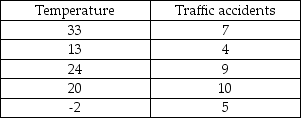 Given these data, the sample correlation coefficient is approximately
A) 0.55.
B) -0.12.
C) 0.39.
D) -0.55.
E) -0.39.
A consumer research group investigating the relationship between the price of meat (per kilogram) and the fat content (grams) gathered data that produced the following scatterplot.
A study was done in which the daily temperature and the number of traffic accidents within the city were recorded. The standard deviations for the samples are 13.13 for temperature and 2.55 for accidents. These sample data are shown as follows:
Given these data, the sample correlation coefficient is approximatelyA) 0.55.
B) -0.12.
C) 0.39.
D) -0.55.
E) -0.39.
Question
Consider the following to answer the question(s) below:
A consumer research group investigating the relationship between the price of meat (per kilogram) and the fat content (grams) gathered data that produced the following scatterplot.
If two variables have a curvilinear relationship, which of the following is true?
A) The correlation coefficient will not be able to measure strength of the association.
B) The correlation coefficient will be equal to-1.
C) The correlation coefficient will be equal to 1.
D) The scatter plot is useless to indicate that the relationship is curved.
E) Only outliers make the curvilinear pattern.
Question
Consider the following to answer the question(s) below:
A consumer research group investigating the relationship between the price of meat (per kilogram) and the fat content (grams) gathered data that produced the following scatterplot.
A student wants to investigate the association between number of cases of mosquito-borne diseases and ice cream sales in the campus area. Which of the following statements is true?
A) It looks like there is a strong positive correlation.
B) It looks like there is a strong negative correlation.
C) The variables are not quantitative, so the student reports about a strong positive association.
D) The variables are not quantitative, so the student reports about nonlinear association.
E) There is a lurking variable, weather, in this study. As the weather grows warmer, more people buy ice cream and more people go outside.
Question
Consider the following to answer the question(s) below:
A consumer research group investigating the relationship between the price of meat (per kilogram) and the fat content (grams) gathered data that produced the following scatterplot.
Which of the following statements is correct?
A) A scatter plot showing two variables with a positive linear relationship will have all points on a straight line.
B) The stronger the linear positive relationship between two variables, the closer the correlation coefficient will be to -1.
C) Two variables that are uncorrelated with one another may still be related in a nonlinear manner.
D) A curvilinear relationship will always have a correlation coefficient of exactly zero.
E) The stronger the linear and negative association between two variables, the closer the correlation coefficient will be to +1.
Question
Consider the following to answer the question(s) below:
A consumer research group investigating the relationship between the price of meat (per kilogram) and the fat content (grams) gathered data that produced the following scatterplot.
If the correlation coefficient for the variables is determined to be 0.70, which of the following is known to be true?
A) The relationship between the variables is nonlinear.
B) The correlation is negative.
C) The scatterplot for the variables will be upward sloping from left to right.
D) The scatterplot for the variables will be downward sloping from left to right.
E) The scatterplot shows a curvilinear pattern.
Question
Consider the following to answer the question(s) below:
A consumer research group investigating the relationship between the price of meat (per kilogram) and the fat content (grams) gathered data that produced the following scatterplot.
Which of the following statements about the relationship associated with the given scatterplot is true?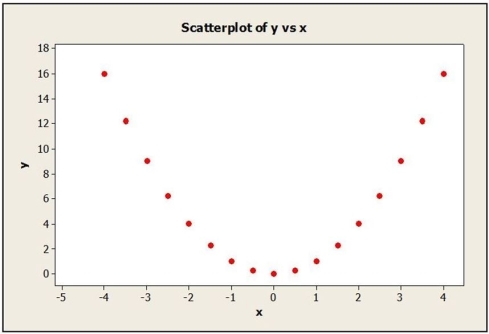
A) The scatterplot indicates strong linear correlation and r is about 0.70.
B) The scatterplot indicates strong linear correlation and r is about -0.70.
C) The scatterplot indicates moderate linear correlation and r is about 0.50.
D) The scatterplot indicates moderate linear correlation and r is about -0.50.
E) There is a certain association, but not linear.
Question
Consider the following to answer the question(s) below:
A consumer research group investigating the relationship between the price of meat (per kilogram) and the fat content (grams) gathered data that produced the following scatterplot.
Shown below is a correlation table showing correlation coefficients between stock price, earnings per share (EPS), and the price/earnings (P/E) ratio for a sample of 19 publicly traded companies. Which of the following statements is false? Correlation: Stock Price, EPS, P/E
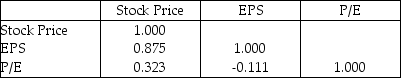
A) Since r = 0.323 for P/E and Stock Price, there is a relatively weak positive correlation between P/E and Stock Price.
B) The strongest correlation is between EPS and Stock Price.
C) There is a weak negative correlation between P/E and EPS.
D) The strongest correlation is between P/E and Stock Price.
E) The weakest correlation is between P/E and EPS.
A consumer research group investigating the relationship between the price of meat (per kilogram) and the fat content (grams) gathered data that produced the following scatterplot.
Shown below is a correlation table showing correlation coefficients between stock price, earnings per share (EPS), and the price/earnings (P/E) ratio for a sample of 19 publicly traded companies. Which of the following statements is false? Correlation: Stock Price, EPS, P/E
A) Since r = 0.323 for P/E and Stock Price, there is a relatively weak positive correlation between P/E and Stock Price.
B) The strongest correlation is between EPS and Stock Price.
C) There is a weak negative correlation between P/E and EPS.
D) The strongest correlation is between P/E and Stock Price.
E) The weakest correlation is between P/E and EPS.

Unlock Deck
Sign up to unlock the cards in this deck!
Unlock Deck
Unlock Deck
1/32
Play
Full screen (f)
Deck 6: Scatterplots, Association, and Correlation
1
Consider the following to answer the question(s) below:
To determine whether the tip left at the end of a meal is related to the size of the total bill at their restaurant, Chez Michelle, data were gathered for 10 customers. The data and summary statistics are shown below.
Government sponsored research investigated the relationship between the number of hours individuals spend on the Internet and age. Which of the following statements is true?
A) Age is the predictor variable and number of hours spent on the Internet is the response variable.
B) Government is the predictor variable and the number of hours spent on the Internet is the response variable.
C) Age is the response variable and the number of hours spent on the Internet is the predictor variable.
D) Age is the predictor variable and government sponsored research is the response variable.
E) Number of individuals is the predictor variable and government sponsored research is the response variable.
Age is the predictor variable and number of hours spent on the Internet is the response variable.
2
Consider the following to answer the question(s) below:
To determine whether the tip left at the end of a meal is related to the size of the total bill at their restaurant, Chez Michelle, data were gathered for 10 customers. The data and summary statistics are shown below.
In discussing how its customers use online services, a bank manager noted "there seems to be a strong correlation between the use of the online bill paying feature and gender". Which of the following is true regarding this statement?
A) The correlation between the use of online bill paying feature and gender is negative.
B) The correlation between the use of online bill paying feature and gender is positive.
C) There may be an association between the use of online bill paying feature and gender, but these variables are both categorical so they cannot be correlated.
D) More males will bank online compared with females.
E) More females will bank online compared with males.
There may be an association between the use of online bill paying feature and gender, but these variables are both categorical so they cannot be correlated.
3
Consider the following to answer the question(s) below:
A consumer research group investigating the relationship between the price of meat (per kilogram) and the fat content (grams) gathered data that produced the following scatterplot.
Which best describes the association between the price of meat and fat content?
A) Negative, moderately strong, linear
B) Negative, very weak, linear
C) Positive, strong, linear
D) Positive, weak, linear
E) Nonlinear
Negative, moderately strong, linear
4
Consider the following to answer the question(s) below:
To determine whether the tip left at the end of a meal is related to the size of the total bill at their restaurant, Chez Michelle, data were gathered for 10 customers. The data and summary statistics are shown below.
Shown below is a correlation table showing correlation coefficients between stock price, earnings per share (EPS), and the price/earnings (P/E) ratio for a sample of 19 publicly traded companies.
Correlation: Stock Price, EPS, P/E
a. What is the correlation between stock price and EPS? Interpret.
b. What is the correlation between stock price and P/E? Interpret.
c. What is the correlation between EPS and P/E? Interpret.
To determine whether the tip left at the end of a meal is related to the size of the total bill at their restaurant, Chez Michelle, data were gathered for 10 customers. The data and summary statistics are shown below.
Shown below is a correlation table showing correlation coefficients between stock price, earnings per share (EPS), and the price/earnings (P/E) ratio for a sample of 19 publicly traded companies.
Correlation: Stock Price, EPS, P/E
a. What is the correlation between stock price and EPS? Interpret.b. What is the correlation between stock price and P/E? Interpret.
c. What is the correlation between EPS and P/E? Interpret.
Unlock Deck
Unlock for access to all 32 flashcards in this deck.
Unlock Deck
k this deck
5
Consider the following to answer the question(s) below:
To determine whether the tip left at the end of a meal is related to the size of the total bill at their restaurant, Chez Michelle, data were gathered for 10 customers. The data and summary statistics are shown below.
The following scatterplot shows a relationship between x and y that results in a correlation coefficient of r = 0. Explain why r = 0 in this situation even though there appears to be a strong relationship between the x and y variables.
Unlock Deck
Unlock for access to all 32 flashcards in this deck.
Unlock Deck
k this deck
6
Consider the following to answer the question(s) below:
To determine whether the tip left at the end of a meal is related to the size of the total bill at their restaurant, Chez Michelle, data were gathered for 10 customers. The data and summary statistics are shown below.
The following scatterplot shows monthly sales figures (in units) and number of months of experience on the job for a sample of 18 salespeople. a. Describe the association between monthly sales and level of experience.
b. Do these data satisfy the conditions for computing a correlation coefficient? Explain.
c. Estimate the correlation. Which value of r looks most probable: 0.1, 0.3, or 0.9?
To determine whether the tip left at the end of a meal is related to the size of the total bill at their restaurant, Chez Michelle, data were gathered for 10 customers. The data and summary statistics are shown below.
The following scatterplot shows monthly sales figures (in units) and number of months of experience on the job for a sample of 18 salespeople.
a. Describe the association between monthly sales and level of experience.b. Do these data satisfy the conditions for computing a correlation coefficient? Explain.
c. Estimate the correlation. Which value of r looks most probable: 0.1, 0.3, or 0.9?
Unlock Deck
Unlock for access to all 32 flashcards in this deck.
Unlock Deck
k this deck
7
Consider the following to answer the question(s) below:
To determine whether the tip left at the end of a meal is related to the size of the total bill at their restaurant, Chez Michelle, data were gathered for 10 customers. The data and summary statistics are shown below.
A study examined consumption levels of oil and carbon dioxide emissions for a sample of municipalities. The response variable in this study is
A) oil brands.
B) oil consumption levels.
C) carbon dioxide emissions.
D) municipalities.
E) oil prices.
Unlock Deck
Unlock for access to all 32 flashcards in this deck.
Unlock Deck
k this deck
8
Consider the following to answer the question(s) below:
To determine whether the tip left at the end of a meal is related to the size of the total bill at their restaurant, Chez Michelle, data were gathered for 10 customers. The data and summary statistics are shown below.
The following scatterplot shows Internet Usage and PC household adoption rate (per 100 inhabitants) for a sample of 15 countries. a. Describe the association between Internet usage and PC household adoption rate.
b. Do these data satisfy the conditions for computing a correlation coefficient? Explain.
c. Estimate the correlation. Which value of r looks most probable: 0.1, 0.3, or 0.9?
To determine whether the tip left at the end of a meal is related to the size of the total bill at their restaurant, Chez Michelle, data were gathered for 10 customers. The data and summary statistics are shown below.
The following scatterplot shows Internet Usage and PC household adoption rate (per 100 inhabitants) for a sample of 15 countries.
a. Describe the association between Internet usage and PC household adoption rate.b. Do these data satisfy the conditions for computing a correlation coefficient? Explain.
c. Estimate the correlation. Which value of r looks most probable: 0.1, 0.3, or 0.9?
Unlock Deck
Unlock for access to all 32 flashcards in this deck.
Unlock Deck
k this deck
9
Consider the following to answer the question(s) below:
The following scatterplot shows monthly sales figures (in units) and the number of months of experience on the job for a sample of 18 salespeople.
The correlation coefficient between monthly sales and number of months of experience is most likely
A) -0.235.
B) 0.
C) 0.180.
D) -0.914.
E) 0.914.
The following scatterplot shows monthly sales figures (in units) and the number of months of experience on the job for a sample of 18 salespeople.
The correlation coefficient between monthly sales and number of months of experience is most likely
A) -0.235.
B) 0.
C) 0.180.
D) -0.914.
E) 0.914.
Unlock Deck
Unlock for access to all 32 flashcards in this deck.
Unlock Deck
k this deck
10
Consider the following to answer the question(s) below:
To determine whether the tip left at the end of a meal is related to the size of the total bill at their restaurant, Chez Michelle, data were gathered for 10 customers. The data and summary statistics are shown below.
Based on the scatterplots shown below, describe the association between x and y.
a. b.
To determine whether the tip left at the end of a meal is related to the size of the total bill at their restaurant, Chez Michelle, data were gathered for 10 customers. The data and summary statistics are shown below.
Based on the scatterplots shown below, describe the association between x and y.
a.
b. Unlock Deck
Unlock for access to all 32 flashcards in this deck.
Unlock Deck
k this deck
11
Consider the following to answer the question(s) below:
The following scatterplot shows monthly sales figures (in units) and the number of months of experience on the job for a sample of 18 salespeople.
The association between monthly sales and number of months of experience can be described as
A) positive and weak.
B) negative and weak.
C) negative and strong.
D) positive and strong.
E) nonlinear.
Unlock Deck
Unlock for access to all 32 flashcards in this deck.
Unlock Deck
k this deck
12
Consider the following to answer the question(s) below:
To determine whether the tip left at the end of a meal is related to the size of the total bill at their restaurant, Chez Michelle, data were gathered for 10 customers. The data and summary statistics are shown below.
In discussing how its customers use online services, a bank manager noted "there seems to be a strong correlation between the use of the online bill paying feature and gender". Comment on this statement.
Unlock Deck
Unlock for access to all 32 flashcards in this deck.
Unlock Deck
k this deck
13
Consider the following to answer the question(s) below:
To determine whether the tip left at the end of a meal is related to the size of the total bill at their restaurant, Chez Michelle, data were gathered for 10 customers. The data and summary statistics are shown below.
In commenting on the increase in home foreclosures, a news reporter stated "there appears to be a strong correlation between home foreclosures and job loss of the head of household." Comment on this statement.
Unlock Deck
Unlock for access to all 32 flashcards in this deck.
Unlock Deck
k this deck
14
Consider the following to answer the question(s) below:
To determine whether the tip left at the end of a meal is related to the size of the total bill at their restaurant, Chez Michelle, data were gathered for 10 customers. The data and summary statistics are shown below.
A supermarket chain gathers data on the amount they spend on promotional material (specials, coupons, etc.) and sales revenue generated each quarter. The predictor variable is
A) sales revenue.
B) amount spent on promotional material.
C) number of coupons offered.
D) supermarket chains.
E) number of quarter.
Unlock Deck
Unlock for access to all 32 flashcards in this deck.
Unlock Deck
k this deck
15
Consider the following to answer the question(s) below:
A consumer research group investigating the relationship between the price of meat (per kilogram) and the fat content (grams) gathered data that produced the following scatterplot.
If the point in the lower left hand corner ($2.00 per kilogram, 6 grams of fat) were removed, the correlation would most likely
A) remain the same.
B) become stronger negative.
C) become weaker negative.
D) become positive.
E) become nonlinear.
Unlock Deck
Unlock for access to all 32 flashcards in this deck.
Unlock Deck
k this deck
16
Consider the following to answer the question(s) below:
To determine whether the tip left at the end of a meal is related to the size of the total bill at their restaurant, Chez Michelle, data were gathered for 10 customers. The data and summary statistics are shown below.
A consumer research group investigating the relationship between the price of meat (per kilogram) and the fat content (grams) gathered data that produced the following scatterplot. a. Describe the association between the price of meat and fat content.
b. Estimate the correlation. Which value of r looks most probable: -0.9, -0.5, or -0.1?
c. If the point in the lower left hand corner ($2.00 per kilogram, 6 grams of fat) is removed, would the correlation become stronger, weaker, or remain the same? Explain.
To determine whether the tip left at the end of a meal is related to the size of the total bill at their restaurant, Chez Michelle, data were gathered for 10 customers. The data and summary statistics are shown below.
A consumer research group investigating the relationship between the price of meat (per kilogram) and the fat content (grams) gathered data that produced the following scatterplot.
a. Describe the association between the price of meat and fat content.b. Estimate the correlation. Which value of r looks most probable: -0.9, -0.5, or -0.1?
c. If the point in the lower left hand corner ($2.00 per kilogram, 6 grams of fat) is removed, would the correlation become stronger, weaker, or remain the same? Explain.
Unlock Deck
Unlock for access to all 32 flashcards in this deck.
Unlock Deck
k this deck
17
Consider the following to answer the question(s) below:
To determine whether the tip left at the end of a meal is related to the size of the total bill at their restaurant, Chez Michelle, data were gathered for 10 customers. The data and summary statistics are shown below.
Based on the scatterplots shown below, describe the association between x and y.
a. b.
To determine whether the tip left at the end of a meal is related to the size of the total bill at their restaurant, Chez Michelle, data were gathered for 10 customers. The data and summary statistics are shown below.
Based on the scatterplots shown below, describe the association between x and y.
a.
b. Unlock Deck
Unlock for access to all 32 flashcards in this deck.
Unlock Deck
k this deck
18
Consider the following to answer the question(s) below:
To determine whether the tip left at the end of a meal is related to the size of the total bill at their restaurant, Chez Michelle, data were gathered for 10 customers. The data and summary statistics are shown below.
For each of the following scenarios, indicate which is the predictor variable and which is the response variable.
a. A supermarket chain gathers data on the amount they spend on promotional material (specials, coupons, etc.) and sales revenue generated each quarter.
b. Government sponsored research investigated the relationship between the number of hours individuals spend on the Internet and age.
c. A real estate association conducted a study on home prices and economic strength for different regions of Canada.
Unlock Deck
Unlock for access to all 32 flashcards in this deck.
Unlock Deck
k this deck
19
Consider the following to answer the question(s) below:
To determine whether the tip left at the end of a meal is related to the size of the total bill at their restaurant, Chez Michelle, data were gathered for 10 customers. The data and summary statistics are shown below.
Shown below is a correlation table showing correlation coefficients between population (in millions), PC household adoption rate and cell phone adoption rate for a sample of 16 countries.
Correlation: PC Adoption, Cell Phone Adoption, Population
a. What is the correlation between PC household adoption rate and population? Interpret.
b. What is the correlation between cell phone adoption rate and population? Interpret.
c. What is the correlation between PC household adoption rate and cell phone adoption rate? Interpret.
To determine whether the tip left at the end of a meal is related to the size of the total bill at their restaurant, Chez Michelle, data were gathered for 10 customers. The data and summary statistics are shown below.
Shown below is a correlation table showing correlation coefficients between population (in millions), PC household adoption rate and cell phone adoption rate for a sample of 16 countries.
Correlation: PC Adoption, Cell Phone Adoption, Population
a. What is the correlation between PC household adoption rate and population? Interpret.b. What is the correlation between cell phone adoption rate and population? Interpret.
c. What is the correlation between PC household adoption rate and cell phone adoption rate? Interpret.
Unlock Deck
Unlock for access to all 32 flashcards in this deck.
Unlock Deck
k this deck
20
Consider the following to answer the question(s) below:
To determine whether the tip left at the end of a meal is related to the size of the total bill at their restaurant, Chez Michelle, data were gathered for 10 customers. The data and summary statistics are shown below.
For each of the following scenarios, indicate which is the predictor variable and which is the response variable.
a. A study examined consumption levels of oil and carbon dioxide emissions for a sample of municipalities.
b. Data were collected on job performance rating and hours of training for a sample of employees at a telecommunications repair facility.
c. Salary data as well as years of managerial experience were collected for a sample of executives in the high tech industry.
Unlock Deck
Unlock for access to all 32 flashcards in this deck.
Unlock Deck
k this deck
21
Consider the following to answer the question(s) below:
A consumer research group investigating the relationship between the price of meat (per kilogram) and the fat content (grams) gathered data that produced the following scatterplot.
A perfect correlation between two variables will always produce which of the following?
A) a correlation coefficient of -1.0
B) a scatterplot with a pattern running from lower left to upper right
C) a correlation coefficient of 1.0
D) a scatterplot where all points lie on a single straight line
E) a scatterplot with a pattern running from upper left to lower right
Unlock Deck
Unlock for access to all 32 flashcards in this deck.
Unlock Deck
k this deck
22
Consider the following to answer the question(s) below:
A consumer research group investigating the relationship between the price of meat (per kilogram) and the fat content (grams) gathered data that produced the following scatterplot.
Consider the following sample data. The standard deviations from the data are 3.67 for Y, and 45.28 for X. These sample data are shown as follows: Given this data, the sample correlation is approximately
A) 0.68.
B) 0.54.
C) 0.16.
D) 0.39.
E) 0.20.
A consumer research group investigating the relationship between the price of meat (per kilogram) and the fat content (grams) gathered data that produced the following scatterplot.
Consider the following sample data. The standard deviations from the data are 3.67 for Y, and 45.28 for X. These sample data are shown as follows:
Given this data, the sample correlation is approximatelyA) 0.68.
B) 0.54.
C) 0.16.
D) 0.39.
E) 0.20.
Unlock Deck
Unlock for access to all 32 flashcards in this deck.
Unlock Deck
k this deck
23
Consider the following to answer the question(s) below:
A consumer research group investigating the relationship between the price of meat (per kilogram) and the fat content (grams) gathered data that produced the following scatterplot.
In a university statistics course a correlation coefficient of -0.8 was found between the number of classes missed and the course grade. This can be interpreted to mean that
A) the more classes missed, the lower the course grade.
B) a lower course grade is caused by missing more classes.
C) the correlation is strong and positive.
D) a higher grade can be achieved by missing fewer classes.
E) the more classes missed, the higher the course grade.
Unlock Deck
Unlock for access to all 32 flashcards in this deck.
Unlock Deck
k this deck
24
Consider the following to answer the question(s) below:
A consumer research group investigating the relationship between the price of meat (per kilogram) and the fat content (grams) gathered data that produced the following scatterplot.
Assume that a medical research study found a correlation coefficient of -0.73 between regular use of sunscreen and the skin cancer rate. This could be interpreted to mean that
A) the greater the regular use of sunscreen, the lower the person's chances of getting skin cancer.
B) skin cancer is caused by not using sunscreen regularly.
C) the greater the regular use of sunscreen, the higher the person's chances of getting skin cancer.
D) skin cancer can be prevented by regular use of sunscreen.
E) the lower the regular use of sunscreen, the lower the person's chances of getting skin cancer.
Unlock Deck
Unlock for access to all 32 flashcards in this deck.
Unlock Deck
k this deck
25
Consider the following to answer the question(s) below:
A consumer research group investigating the relationship between the price of meat (per kilogram) and the fat content (grams) gathered data that produced the following scatterplot.
The University recently sampled five full time students who work off campus in order to look at their GPA and their work schedules. The standard deviation for GPA is 0.91 and the standard deviation for hours worked is 6.78. These sample data are shown as follows: Given these data the sample correlation is
A) -0.49.
B) -0.39.
C) -0.42.
D) -0.34.
E) -0.36.
A consumer research group investigating the relationship between the price of meat (per kilogram) and the fat content (grams) gathered data that produced the following scatterplot.
The University recently sampled five full time students who work off campus in order to look at their GPA and their work schedules. The standard deviation for GPA is 0.91 and the standard deviation for hours worked is 6.78. These sample data are shown as follows:
Given these data the sample correlation isA) -0.49.
B) -0.39.
C) -0.42.
D) -0.34.
E) -0.36.
Unlock Deck
Unlock for access to all 32 flashcards in this deck.
Unlock Deck
k this deck
26
Consider the following to answer the question(s) below:
A consumer research group investigating the relationship between the price of meat (per kilogram) and the fat content (grams) gathered data that produced the following scatterplot.
A study was done in which the daily temperature and the number of traffic accidents within the city were recorded. The standard deviations for the samples are 13.13 for temperature and 2.55 for accidents. These sample data are shown as follows: Given these data, the sample correlation coefficient is approximately
A) 0.55.
B) -0.12.
C) 0.39.
D) -0.55.
E) -0.39.
A consumer research group investigating the relationship between the price of meat (per kilogram) and the fat content (grams) gathered data that produced the following scatterplot.
A study was done in which the daily temperature and the number of traffic accidents within the city were recorded. The standard deviations for the samples are 13.13 for temperature and 2.55 for accidents. These sample data are shown as follows:
Given these data, the sample correlation coefficient is approximatelyA) 0.55.
B) -0.12.
C) 0.39.
D) -0.55.
E) -0.39.
Unlock Deck
Unlock for access to all 32 flashcards in this deck.
Unlock Deck
k this deck
27
Consider the following to answer the question(s) below:
A consumer research group investigating the relationship between the price of meat (per kilogram) and the fat content (grams) gathered data that produced the following scatterplot.
If two variables have a curvilinear relationship, which of the following is true?
A) The correlation coefficient will not be able to measure strength of the association.
B) The correlation coefficient will be equal to-1.
C) The correlation coefficient will be equal to 1.
D) The scatter plot is useless to indicate that the relationship is curved.
E) Only outliers make the curvilinear pattern.
Unlock Deck
Unlock for access to all 32 flashcards in this deck.
Unlock Deck
k this deck
28
Consider the following to answer the question(s) below:
A consumer research group investigating the relationship between the price of meat (per kilogram) and the fat content (grams) gathered data that produced the following scatterplot.
A student wants to investigate the association between number of cases of mosquito-borne diseases and ice cream sales in the campus area. Which of the following statements is true?
A) It looks like there is a strong positive correlation.
B) It looks like there is a strong negative correlation.
C) The variables are not quantitative, so the student reports about a strong positive association.
D) The variables are not quantitative, so the student reports about nonlinear association.
E) There is a lurking variable, weather, in this study. As the weather grows warmer, more people buy ice cream and more people go outside.
Unlock Deck
Unlock for access to all 32 flashcards in this deck.
Unlock Deck
k this deck
29
Consider the following to answer the question(s) below:
A consumer research group investigating the relationship between the price of meat (per kilogram) and the fat content (grams) gathered data that produced the following scatterplot.
Which of the following statements is correct?
A) A scatter plot showing two variables with a positive linear relationship will have all points on a straight line.
B) The stronger the linear positive relationship between two variables, the closer the correlation coefficient will be to -1.
C) Two variables that are uncorrelated with one another may still be related in a nonlinear manner.
D) A curvilinear relationship will always have a correlation coefficient of exactly zero.
E) The stronger the linear and negative association between two variables, the closer the correlation coefficient will be to +1.
Unlock Deck
Unlock for access to all 32 flashcards in this deck.
Unlock Deck
k this deck
30
Consider the following to answer the question(s) below:
A consumer research group investigating the relationship between the price of meat (per kilogram) and the fat content (grams) gathered data that produced the following scatterplot.
If the correlation coefficient for the variables is determined to be 0.70, which of the following is known to be true?
A) The relationship between the variables is nonlinear.
B) The correlation is negative.
C) The scatterplot for the variables will be upward sloping from left to right.
D) The scatterplot for the variables will be downward sloping from left to right.
E) The scatterplot shows a curvilinear pattern.
Unlock Deck
Unlock for access to all 32 flashcards in this deck.
Unlock Deck
k this deck
31
Consider the following to answer the question(s) below:
A consumer research group investigating the relationship between the price of meat (per kilogram) and the fat content (grams) gathered data that produced the following scatterplot.
Which of the following statements about the relationship associated with the given scatterplot is true?
A) The scatterplot indicates strong linear correlation and r is about 0.70.
B) The scatterplot indicates strong linear correlation and r is about -0.70.
C) The scatterplot indicates moderate linear correlation and r is about 0.50.
D) The scatterplot indicates moderate linear correlation and r is about -0.50.
E) There is a certain association, but not linear.
Unlock Deck
Unlock for access to all 32 flashcards in this deck.
Unlock Deck
k this deck
32
Consider the following to answer the question(s) below:
A consumer research group investigating the relationship between the price of meat (per kilogram) and the fat content (grams) gathered data that produced the following scatterplot.
Shown below is a correlation table showing correlation coefficients between stock price, earnings per share (EPS), and the price/earnings (P/E) ratio for a sample of 19 publicly traded companies. Which of the following statements is false? Correlation: Stock Price, EPS, P/E
A) Since r = 0.323 for P/E and Stock Price, there is a relatively weak positive correlation between P/E and Stock Price.
B) The strongest correlation is between EPS and Stock Price.
C) There is a weak negative correlation between P/E and EPS.
D) The strongest correlation is between P/E and Stock Price.
E) The weakest correlation is between P/E and EPS.
Unlock Deck
Unlock for access to all 32 flashcards in this deck.
Unlock Deck
k this deck
Unlock Deck
Unlock for access to all 32 flashcards in this deck.


