Exam 6: Scatterplots, Association, and Correlation
Exam 2: Data30 Questions
Exam 3: Surveys and Sampling28 Questions
Exam 4: Displaying and Describing Categorical Data32 Questions
Exam 5: Displaying and Describing Quantitative Data32 Questions
Exam 6: Scatterplots, Association, and Correlation32 Questions
Exam 7: Introduction to Linear Regression32 Questions
Exam 8: Randomness and Probability32 Questions
Exam 9: Random Variables and Probability Distributions28 Questions
Exam 10: Sampling Distributions28 Questions
Exam 11: Confidence Intervals for Proportions32 Questions
Exam 12: Testing Hypotheses About Proportions36 Questions
Exam 13: Confidence Intervals and Hypothesis Tests for Means36 Questions
Exam 14: Comparing Two Means32 Questions
Exam 15: Design of Experiments and Analysis of Variance Anova24 Questions
Exam 16: Inference for Counts: Chi-Square Tests26 Questions
Exam 17: Nonparametric Methods26 Questions
Exam 18: Inference for Regression32 Questions
Exam 19: Understanding Regression Residuals28 Questions
Exam 20: Multiple Regression22 Questions
Exam 21: Building Multiple Regression Models22 Questions
Exam 22: Time Series Analysis28 Questions
Exam 23: Decision Making and Risk32 Questions
Exam 24: Quality Control28 Questions
Exam 25: Exploring and Collecting Data32 Questions
Exam 26: Understanding Probability Distributions and Statistical Inference73 Questions
Exam 27: Exploring Relationships Among Variables40 Questions
Exam 28: Using Statistics for Decision Making26 Questions
Select questions type
Consider the following to answer the question(s) below:
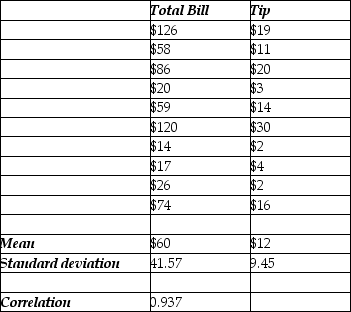
To determine whether the tip left at the end of a meal is related to the size of the total bill at their restaurant, Chez Michelle, data were gathered for 10 customers. The data and summary statistics are shown below.
 -A study examined consumption levels of oil and carbon dioxide emissions for a sample of municipalities. The response variable in this study is
Free
(Multiple Choice)
4.9/5  (40)
(40)
Correct Answer: Verified
C
Consider the following to answer the question(s) below:
A consumer research group investigating the relationship between the price of meat (per kilogram) and the fat content (grams) gathered data that produced the following scatterplot. 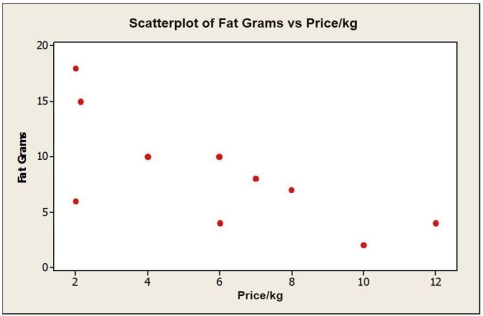 -The University recently sampled five full time students who work off campus in order to look at their GPA and their work schedules. The standard deviation for GPA is 0.91 and the standard deviation for hours worked is 6.78. These sample data are shown as follows:
 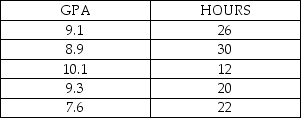 Given these data the sample correlation is
Free
(Multiple Choice)
4.8/5 (38)
Correct Answer:Verified
A
Consider the following to answer the question(s) below:
A consumer research group investigating the relationship between the price of meat (per kilogram) and the fat content (grams) gathered data that produced the following scatterplot.
-If two variables have a curvilinear relationship, which of the following is true?
Free
(Multiple Choice)
4.9/5 (39)
Correct Answer:Verified
A
Consider the following to answer the question(s) below:
To determine whether the tip left at the end of a meal is related to the size of the total bill at their restaurant, Chez Michelle, data were gathered for 10 customers. The data and summary statistics are shown below.
-In discussing how its customers use online services, a bank manager noted "there seems to be a strong correlation between the use of the online bill paying feature and gender". Comment on this statement.
(Essay)
4.8/5 (42)
Consider the following to answer the question(s) below:
To determine whether the tip left at the end of a meal is related to the size of the total bill at their restaurant, Chez Michelle, data were gathered for 10 customers. The data and summary statistics are shown below.
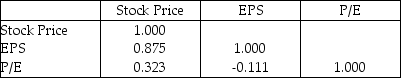
-Shown below is a correlation table showing correlation coefficients between stock price, earnings per share (EPS), and the price/earnings (P/E) ratio for a sample of 19 publicly traded companies.
Correlation: Stock Price, EPS, P/E
 a. What is the correlation between stock price and EPS? Interpret.
b. What is the correlation between stock price and P/E? Interpret.
c. What is the correlation between EPS and P/E? Interpret.
a. What is the correlation between stock price and EPS? Interpret.
b. What is the correlation between stock price and P/E? Interpret.
c. What is the correlation between EPS and P/E? Interpret.
(Essay)
4.7/5 (31)
Consider the following to answer the question(s) below:
To determine whether the tip left at the end of a meal is related to the size of the total bill at their restaurant, Chez Michelle, data were gathered for 10 customers. The data and summary statistics are shown below.
-A supermarket chain gathers data on the amount they spend on promotional material (specials, coupons, etc.) and sales revenue generated each quarter. The predictor variable is
(Multiple Choice)
4.8/5 (32)
Consider the following to answer the question(s) below:
A consumer research group investigating the relationship between the price of meat (per kilogram) and the fat content (grams) gathered data that produced the following scatterplot.
-Which best describes the association between the price of meat and fat content?
(Multiple Choice)
4.8/5 (38)
Consider the following to answer the question(s) below:
To determine whether the tip left at the end of a meal is related to the size of the total bill at their restaurant, Chez Michelle, data were gathered for 10 customers. The data and summary statistics are shown below.
-Based on the scatterplots shown below, describe the association between x and y.
a. 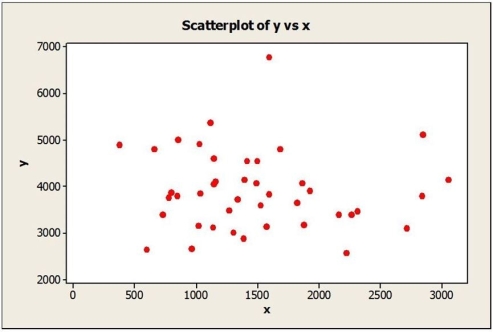 b.
b. 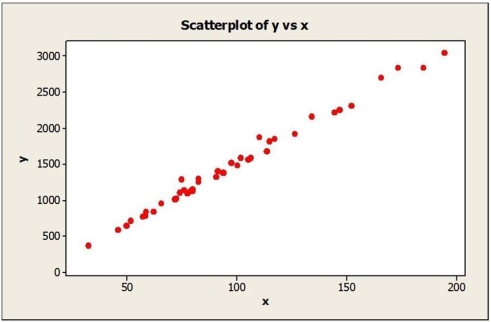
(Essay)
4.9/5 (36)
Consider the following to answer the question(s) below:
A consumer research group investigating the relationship between the price of meat (per kilogram) and the fat content (grams) gathered data that produced the following scatterplot.
-Assume that a medical research study found a correlation coefficient of -0.73 between regular use of sunscreen and the skin cancer rate. This could be interpreted to mean that
(Multiple Choice)
4.9/5 (39)
Consider the following to answer the question(s) below:
The following scatterplot shows monthly sales figures (in units) and the number of months of experience on the job for a sample of 18 salespeople. 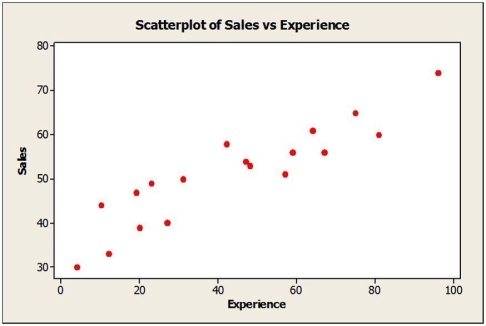 -The association between monthly sales and number of months of experience can be described as
(Multiple Choice)
4.8/5 (37)
Consider the following to answer the question(s) below:
A consumer research group investigating the relationship between the price of meat (per kilogram) and the fat content (grams) gathered data that produced the following scatterplot.
-Consider the following sample data. The standard deviations from the data are 3.67 for Y, and 45.28 for X. These sample data are shown as follows: 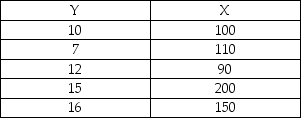 Given this data, the sample correlation is approximately
(Multiple Choice)
4.8/5 (36)
Consider the following to answer the question(s) below:
A consumer research group investigating the relationship between the price of meat (per kilogram) and the fat content (grams) gathered data that produced the following scatterplot.
-Shown below is a correlation table showing correlation coefficients between stock price, earnings per share (EPS), and the price/earnings (P/E) ratio for a sample of 19 publicly traded companies. Which of the following statements is false? Correlation: Stock Price, EPS, P/E
(Multiple Choice)
4.7/5 (34)
Consider the following to answer the question(s) below:
A consumer research group investigating the relationship between the price of meat (per kilogram) and the fat content (grams) gathered data that produced the following scatterplot.
-If the correlation coefficient for the variables is determined to be 0.70, which of the following is known to be true?
(Multiple Choice)
4.9/5 (34)
Consider the following to answer the question(s) below:
A consumer research group investigating the relationship between the price of meat (per kilogram) and the fat content (grams) gathered data that produced the following scatterplot.
-A study was done in which the daily temperature and the number of traffic accidents within the city were recorded. The standard deviations for the samples are 13.13 for temperature and 2.55 for accidents. These sample data are shown as follows: 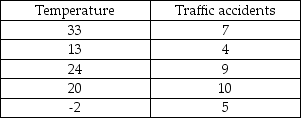 Given these data, the sample correlation coefficient is approximately
(Multiple Choice)
4.8/5 (37)
Consider the following to answer the question(s) below:
To determine whether the tip left at the end of a meal is related to the size of the total bill at their restaurant, Chez Michelle, data were gathered for 10 customers. The data and summary statistics are shown below.
-Shown below is a correlation table showing correlation coefficients between population (in millions), PC household adoption rate and cell phone adoption rate for a sample of 16 countries.
Correlation: PC Adoption, Cell Phone Adoption, Population
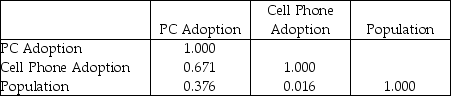 a. What is the correlation between PC household adoption rate and population? Interpret.
b. What is the correlation between cell phone adoption rate and population? Interpret.
c. What is the correlation between PC household adoption rate and cell phone adoption rate? Interpret.
a. What is the correlation between PC household adoption rate and population? Interpret.
b. What is the correlation between cell phone adoption rate and population? Interpret.
c. What is the correlation between PC household adoption rate and cell phone adoption rate? Interpret.
(Essay)
4.7/5 (39)
Consider the following to answer the question(s) below:
To determine whether the tip left at the end of a meal is related to the size of the total bill at their restaurant, Chez Michelle, data were gathered for 10 customers. The data and summary statistics are shown below.
-The following scatterplot shows Internet Usage and PC household adoption rate (per 100 inhabitants) for a sample of 15 countries. 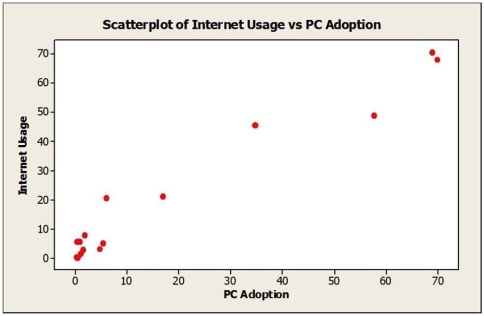 a. Describe the association between Internet usage and PC household adoption rate.
b. Do these data satisfy the conditions for computing a correlation coefficient? Explain.
c. Estimate the correlation. Which value of r looks most probable: 0.1, 0.3, or 0.9?
a. Describe the association between Internet usage and PC household adoption rate.
b. Do these data satisfy the conditions for computing a correlation coefficient? Explain.
c. Estimate the correlation. Which value of r looks most probable: 0.1, 0.3, or 0.9?
(Essay)
4.8/5 (40)
Consider the following to answer the question(s) below:
A consumer research group investigating the relationship between the price of meat (per kilogram) and the fat content (grams) gathered data that produced the following scatterplot.
-A student wants to investigate the association between number of cases of mosquito-borne diseases and ice cream sales in the campus area. Which of the following statements is true?
(Multiple Choice)
4.9/5 (38)
Consider the following to answer the question(s) below:
To determine whether the tip left at the end of a meal is related to the size of the total bill at their restaurant, Chez Michelle, data were gathered for 10 customers. The data and summary statistics are shown below.
-For each of the following scenarios, indicate which is the predictor variable and which is the response variable.
a. A supermarket chain gathers data on the amount they spend on promotional material (specials, coupons, etc.) and sales revenue generated each quarter.
b. Government sponsored research investigated the relationship between the number of hours individuals spend on the Internet and age.
c. A real estate association conducted a study on home prices and economic strength for different regions of Canada.
(Essay)
4.8/5 (34)
Consider the following to answer the question(s) below:
A consumer research group investigating the relationship between the price of meat (per kilogram) and the fat content (grams) gathered data that produced the following scatterplot.
-If the point in the lower left hand corner ($2.00 per kilogram, 6 grams of fat) were removed, the correlation would most likely
(Multiple Choice)
4.8/5 (32)
Consider the following to answer the question(s) below:
To determine whether the tip left at the end of a meal is related to the size of the total bill at their restaurant, Chez Michelle, data were gathered for 10 customers. The data and summary statistics are shown below.
-In discussing how its customers use online services, a bank manager noted "there seems to be a strong correlation between the use of the online bill paying feature and gender". Which of the following is true regarding this statement?
(Multiple Choice)
4.7/5 (28)
Filters
- Essay(0)
- Multiple Choice(0)
- Short Answer(0)
- True False(0)
- Matching(0)