Deck 2: Limits and Derivatives
Full screen (f)
Question
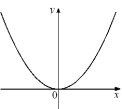
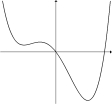
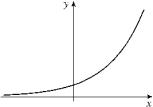
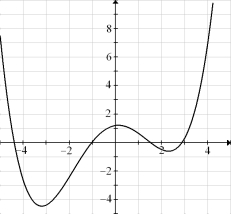
Given the graph of y = f (x) below, select a graph which best represents the graph of 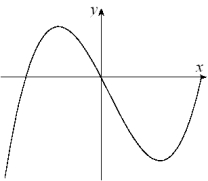
A)
B)
C)

D)

E)
F)
G)
H)

A)
B)
C)
D)
E)
F)
G)
H)
Question
Question
Given the graph of y = f (x) below, select a graph which best represents the graph of 
 a.
a.  e.
e.  b.
b.  f.
f.  c.
c. 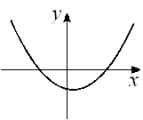 g.
g.  d.
d.  h.
h. 
a. e. b. f. c. g. d. h. Question
Given the graph of  , answer the questions that follow.
 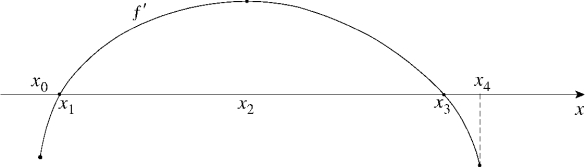 (a) Find all values of x at which
(i) f is increasing.(iv) (vii)
(vii)  (ii) f is decreasing.(v) f has an inflection point.(viii) f has a local maximum.(iii)
  (b) Sketch a graph which could represent y = f (x).
, answer the questions that follow. (a) Find all values of x at which(i) f is increasing.(iv)
(vii) (ii) f is decreasing.(v) f has an inflection point.(viii) f has a local maximum.(iii) (b) Sketch a graph which could represent y = f (x). Question
Given the graph of y = f (x), sketch the graph of y =  (a)
(a) 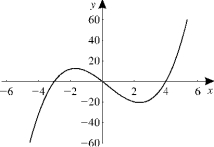 (b)
(b) 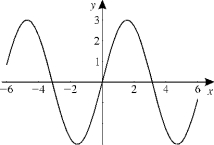 (c)
(c)  (d)
(d) 
(a) (b) (c) (d) Question
Given the graph of below, select a graph which could be that of y = f (x). 
A)
B)

C)

D)

E)

F)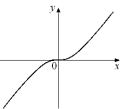
G)
H)

A)
B)
C)
D)
E)
F)
G)
H)
Question
Given the graph of below, select a graph which could be that of y = f (x). 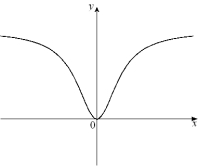
A)
B)
C)

D)

E)
F)

G)
H)
A)
B)
C)
D)
E)
F)
G)
H)
Question
Given the graph of below, select a graph which could be that of y = f (x). 
A)
B)

C)
D)

E)
F)
G)

H)

A)
B)
C)
D)
E)
F)
G)
H)
Question
Given the graph of y = f (x) below, select a graph which best represents the graph of 
A)
B)
C)
D)
E)
F)
G)
H)
A)
B)
C)
D)
E)
F)
G)
H)
Question
Given the graph of  , answer the questions that follow.
 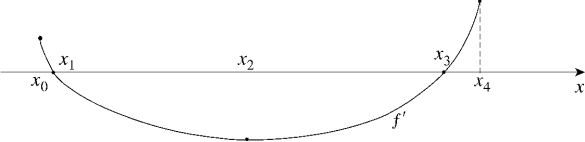 (a) Find all values of x at which
(i) f is increasing.(iv) (vii)
(vii)  (ii) f is decreasing.(v) f has an inflection point.(viii) f has a local maximum.(iii)
  (vi)
(vi)  (ix) f has a local minimum.(b) Sketch a graph which could represent y = f (x).
, answer the questions that follow. (a) Find all values of x at which(i) f is increasing.(iv)
(vii) (ii) f is decreasing.(v) f has an inflection point.(viii) f has a local maximum.(iii) (vi) (ix) f has a local minimum.(b) Sketch a graph which could represent y = f (x). Question
Given the graph of y = f (x) below, select a graph which best represents the graph of 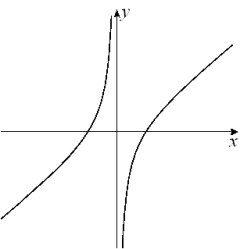
A)
B)
C)

D)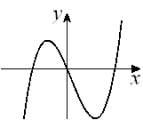
E)

F)
G)
H)
A)
B)
C)
D)
E)
F)
G)
H)
Question
Given the graph of y = f (x) below, select a graph which best represents the graph of 
A)
B)
C)

D)
E)
F)
G)
H)
A)
B)
C)
D)
E)
F)
G)
H)
Question
Given the graph of y = f (x), answer the following questions. 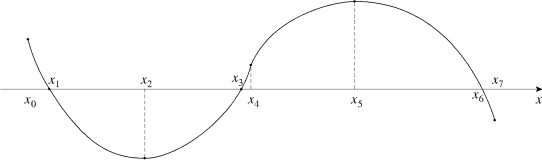 Find all values of x at which
(a) (b)
(b)  (c)
(c)  (d) f is increasing.(e) f is decreasing.(f)
  (g)
(g)  (h) f has an inflection point.(i)
  (j)
(j) 
Find all values of x at which(a)
(b) (c) (d) f is increasing.(e) f is decreasing.(f) (g) (h) f has an inflection point.(i) (j) Question
Given the graph of y = f (x) below, select a graph which best represents the graph of 
A)

B)
C)
D)
E)
F)
G)
H)
A)
B)
C)
D)
E)
F)
G)
H)
Question
Given the graph of below, select a graph which could be that of y = f (x). 
A)
B)
C)
D)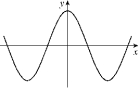
E)
F)

G)
H)

A)
B)
C)
D)
E)
F)
G)
H)
Question
Given the graph of y = f (x) below, select a graph which best represents the graph of 
A)

B)

C) 1eaa8e2_0f37_9ed6_96ab_237635657d14_TB2033_11
D)
E)

F)
G)

H)

A)
B)
C) 1eaa8e2_0f37_9ed6_96ab_237635657d14_TB2033_11
D)
E)
F)
G)
H)
Question
Given the graph of below, select a graph which could be that of y = f (x). 
A)
B)

C)
D)
E)
F)

G)
H)
A)
B)
C)
D)
E)
F)
G)
H)
Question
Given the graph of below, select a graph which could be that of y = f (x). 
A)
B)
C)
D)
E)
F)
G)
H)

A)
B)
C)
D)
E)
F)
G)
H)
Question
Given the graph of  , answer the questions that follow.
  (a) Find all values of x at which
(i) f is increasing.(iv) (vii)
(vii)  (ii) f is decreasing.(v)
  (viii) f has a local maximum.(iii)
  (vi)
(vi)  (ix) f has a local minimum.(b) Sketch a graph which could represent y = f (x).
, answer the questions that follow. (a) Find all values of x at which(i) f is increasing.(iv)
(vii) (ii) f is decreasing.(v) (viii) f has a local maximum.(iii) (vi) (ix) f has a local minimum.(b) Sketch a graph which could represent y = f (x). Question
Given the graph of y = f (x) below, select a graph which best represents the graph of 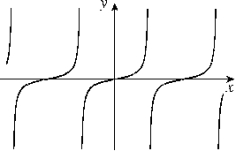
A)

B)
C)
D)
E)
F)
G)
H)
A)
B)
C)
D)
E)
F)
G)
H)
Question
Given the graph of y = f (x) below, sketch the graph of  .
. 
. Question
Question
Question
Given the graph of y = f (x) below, sketch the graph of  .
. 
. Question
Question
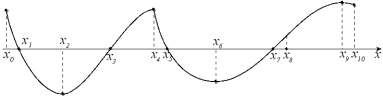
For the function f whose graph is given, arrange the following values in increasing order and explain your reasoning. 
Question
Consider the function  (a) What is the domain of f?
(b) At what number(s), if any, is f discontinuous? Explain your answer.(c) At what number(s), if any, is f not differentiable? Explain your answer.
(a) What is the domain of f?(b) At what number(s), if any, is f discontinuous? Explain your answer.(c) At what number(s), if any, is f not differentiable? Explain your answer.
Question
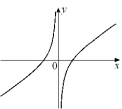
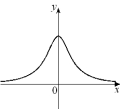
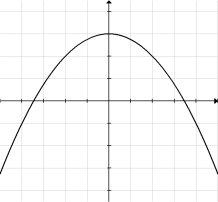
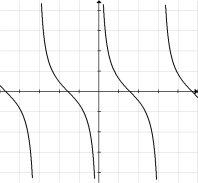
Below are the graphs of a function and its first and second derivatives. Identify which of the following graphs (a, b, and c) is f (x), which is  , and which is
  . Justify your choices.
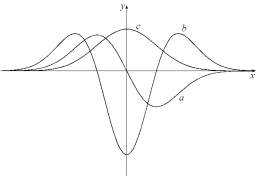
, and which is . Justify your choices. Question
Determine a function f and a number a where the given limit represents the derivative of f at a.(a) 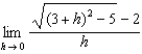 (b)
(b) 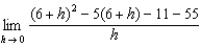 (c)
(c)  (d)
(d) 
(b) (c) (d) Question
Question
The graph of f is given below. State, with reasons, the number(s) at which
(a) f is not differentiable. (b) f is not continuous.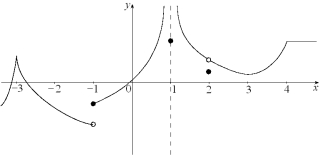
(a) f is not differentiable. (b) f is not continuous.
Question
Given the graph of y = f (x), find all values of x for which
(a) (b)
(b)  (c)
(c)  (d)
(d) 
(a)
(b) (c) (d) Question
If f (x) = 5, which of the following represents  a.
a.  e.
e.  b.3
b.3
F) c.
c.  g.Does not exist
D)5
H)None of the above
a. e. b.3F)
c. g.Does not existD)5
H)None of the above
Question
Find the derivative of  using the definition of the derivative.
using the definition of the derivative. Question
Water is flowing into a large cylindrical tank at a constant rate. Let H (t) represent the height of the water level at time t.(a) Sketch a possible graph of H (t).(b) Describe how the rate of change of H with respect to t varies as t increases.(c) Sketch a graph of 
Question
Given the graph of y = f (x) below, sketch the graph of  .
. 
. Question
A tank is in the shape of a large, inverted (point-down) cone. Water is owing into the tank
at a constant rate. Let H (t) represent the height of the water level at time t.(a) Sketch a possible graph of H (t).(b) Describe how the rate of change of H with respect to t varies as t increases.(c) Sketch a graph of
at a constant rate. Let H (t) represent the height of the water level at time t.(a) Sketch a possible graph of H (t).(b) Describe how the rate of change of H with respect to t varies as t increases.(c) Sketch a graph of
Question
Given the graph of y = f (x) below, sketch the graph of  .
. 
. Question
Question
The graph of f is given below. State, with reasons, the number(s) at which
(a) f is not differentiable. (b) f is not continuous.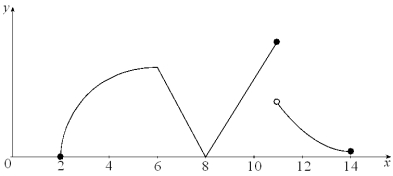
(a) f is not differentiable. (b) f is not continuous.
Question
Question
Question
Given the following information about limits, select a graph which could be the graph of y = f (x).
A)

B)
C)

D)

E)
F)
G)
H)

A)
B)
C)
D)
E)
F)
G)
H)
Question
(a) Find the slope of the tangent line to the curve  (i)
(i)
using Definition 1 from Section 2.6.(ii)
using Definition 2 from Section 2.6.(b) Using your results from part (a), find an equation of the tangent line at (1, 0).
(i)using Definition 1 from Section 2.6.(ii)
using Definition 2 from Section 2.6.(b) Using your results from part (a), find an equation of the tangent line at (1, 0).
Question
Question
Question
Question
Suppose that  . f is not defined for
  .(a) For which of these two values does f have an infinite discontinuity? Explain.(b) For which of these two values does f have a removable discontinuity? Explain.
. f is not defined for .(a) For which of these two values does f have an infinite discontinuity? Explain.(b) For which of these two values does f have a removable discontinuity? Explain. Question
Question
Question
Question
Using the graph below, determine the following:  (a)
(a)  (b)
(b)  (c)
(c)  (d)
(d)  (e)
(e)  (f)
(f)  (g) Find the horizontal asymptote(s) of the graph of y = f (x).(h) Find the vertical asymptote(s) of the graph of y = f (x).
(a) (b) (c) (d) (e) (f) (g) Find the horizontal asymptote(s) of the graph of y = f (x).(h) Find the vertical asymptote(s) of the graph of y = f (x). Question
Question
Question
Given the following information about limits, select a graph which could be the graph of y = f (x).
A)

B)

C)
D)

E)

F)

G)

H)

A)
B)
C)
D)
E)
F)
G)
H)
Question
Question
Question
Given the following information about limits, select a graph which could be the graph of y = f (x).
A)
B)

C)
D)
E)

F)

G)
H)
A)
B)
C)
D)
E)
F)
G)
H)
Question
Question
Question
At what value(s) of x is the function 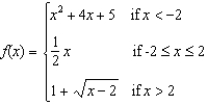
Question
Given the following information about limits, sketch a graph which could be the graph of y = f (x). Label all horizontal and vertical asymptotes. 
Question
At what value(s) of x is the function 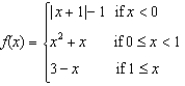 discontinuous?
discontinuous? Question
Question
Question
Question
Question
Given the following information about limits, sketch a graph which could be the graph of y = f (x). Label all horizontal and vertical asymptotes. 
Question
Question
Find the limit.(a)  (b)
(b)  (c)
(c) 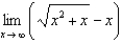
(b) (c) Question
Given the following information about limits, sketch a graph which could be the graph of y = f (x). Label all horizontal and vertical asymptotes. 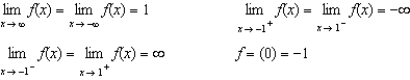
Question
Question
Question
Find the limit.(a)  (b)
(b)  (c)
(c) 
(b) (c) Question
Question
Question
Question
Find the vertical asymptote(s) of the curve 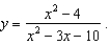
Question
Given the graph of f below, state the intervals on which f is continuous. 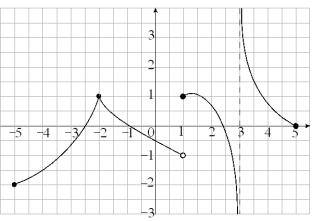
Question
Find the limit.(a)  (b)
(b) 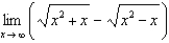 (c)
(c) 
(b) (c) 
Unlock Deck
Sign up to unlock the cards in this deck!
Unlock Deck
Unlock Deck
1/127
Play
Full screen (f)
Deck 2: Limits and Derivatives
1
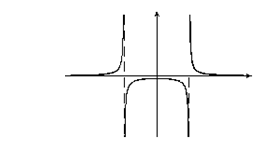
Given the graph of y = f (x) below, select a graph which best represents the graph of
A)
B)
C)
D)
E)
F)
G)
H)
A)
B)
C)
D)
E)
F)
G)
H)
2
In order to determine an appropriate delivery schedule to a group of rural homes in North Dakota, a fuel oil distributor monitors fuel oil consumption and the daily outdoor temperature (in degrees Fahrenheit). A table was constructed for a function F (T) of fuel oil consumption (in gallons per day) as a function of the temperature T.(a) Sketch a graph which you believe would approximate the graph of y = F (T).(b) What is the meaning of What are its units?
(c) Write a sentence that would explain to an intelligent layperson the meaning of
(c) Write a sentence that would explain to an intelligent layperson the meaning of
(a) 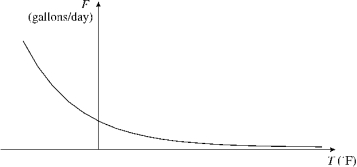
(There are many possible graphs, though presumably they are all decreasing!)
(b) represents the rate of change of fuel oil consumption with respect to temperature. Its units are (gallons/day) / ( F).
(c) means that as the temperature increases past 0 F, the fuel consumption is decreasing by 0.4 (gallons/day) / (F).
3
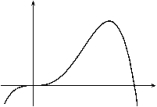
Given the graph of y = f (x) below, select a graph which best represents the graph of a. e. b. f. c. g. d. h.
a. e. b. f. c. g. d. h. D
4
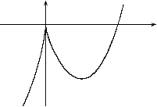
Given the graph of , answer the questions that follow. (a) Find all values of x at which
(i) f is increasing.(iv) (vii) (ii) f is decreasing.(v) f has an inflection point.(viii) f has a local maximum.(iii) (b) Sketch a graph which could represent y = f (x).
, answer the questions that follow. (a) Find all values of x at which(i) f is increasing.(iv)
(vii) (ii) f is decreasing.(v) f has an inflection point.(viii) f has a local maximum.(iii) (b) Sketch a graph which could represent y = f (x). Unlock Deck
Unlock for access to all 127 flashcards in this deck.
Unlock Deck
k this deck
5
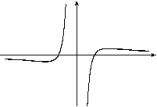
Given the graph of y = f (x), sketch the graph of y = (a) (b) (c) (d)
(a) (b) (c) (d) Unlock Deck
Unlock for access to all 127 flashcards in this deck.
Unlock Deck
k this deck
6
Given the graph of below, select a graph which could be that of y = f (x).
A)
B)
C)
D)
E)
F)
G)
H)
A)
B)
C)
D)
E)
F)
G)
H)
Unlock Deck
Unlock for access to all 127 flashcards in this deck.
Unlock Deck
k this deck
7
Given the graph of below, select a graph which could be that of y = f (x).
A)
B)
C)
D)
E)
F)
G)
H)
A)
B)
C)
D)
E)
F)
G)
H)
Unlock Deck
Unlock for access to all 127 flashcards in this deck.
Unlock Deck
k this deck
8
Given the graph of below, select a graph which could be that of y = f (x).
A)
B)
C)
D)
E)
F)
G)
H)
A)
B)
C)
D)
E)
F)
G)
H)
Unlock Deck
Unlock for access to all 127 flashcards in this deck.
Unlock Deck
k this deck
9
Given the graph of y = f (x) below, select a graph which best represents the graph of
A)
B)
C)
D)
E)
F)
G)
H)
A)
B)
C)
D)
E)
F)
G)
H)
Unlock Deck
Unlock for access to all 127 flashcards in this deck.
Unlock Deck
k this deck
10
Given the graph of , answer the questions that follow. (a) Find all values of x at which
(i) f is increasing.(iv) (vii) (ii) f is decreasing.(v) f has an inflection point.(viii) f has a local maximum.(iii) (vi) (ix) f has a local minimum.(b) Sketch a graph which could represent y = f (x).
, answer the questions that follow. (a) Find all values of x at which(i) f is increasing.(iv)
(vii) (ii) f is decreasing.(v) f has an inflection point.(viii) f has a local maximum.(iii) (vi) (ix) f has a local minimum.(b) Sketch a graph which could represent y = f (x). Unlock Deck
Unlock for access to all 127 flashcards in this deck.
Unlock Deck
k this deck
11
Given the graph of y = f (x) below, select a graph which best represents the graph of
A)
B)
C)
D)
E)
F)
G)
H)
A)
B)
C)
D)
E)
F)
G)
H)
Unlock Deck
Unlock for access to all 127 flashcards in this deck.
Unlock Deck
k this deck
12
Given the graph of y = f (x) below, select a graph which best represents the graph of
A)
B)
C)
D)
E)
F)
G)
H)
A)
B)
C)
D)
E)
F)
G)
H)
Unlock Deck
Unlock for access to all 127 flashcards in this deck.
Unlock Deck
k this deck
13
Given the graph of y = f (x), answer the following questions. Find all values of x at which
(a) (b) (c) (d) f is increasing.(e) f is decreasing.(f) (g) (h) f has an inflection point.(i) (j)
Find all values of x at which(a)
(b) (c) (d) f is increasing.(e) f is decreasing.(f) (g) (h) f has an inflection point.(i) (j) Unlock Deck
Unlock for access to all 127 flashcards in this deck.
Unlock Deck
k this deck
14
Given the graph of y = f (x) below, select a graph which best represents the graph of
A)
B)
C)
D)
E)
F)
G)
H)
A)
B)
C)
D)
E)
F)
G)
H)
Unlock Deck
Unlock for access to all 127 flashcards in this deck.
Unlock Deck
k this deck
15
Given the graph of below, select a graph which could be that of y = f (x).
A)
B)
C)
D)
E)
F)
G)
H)
A)
B)
C)
D)
E)
F)
G)
H)
Unlock Deck
Unlock for access to all 127 flashcards in this deck.
Unlock Deck
k this deck
16
Given the graph of y = f (x) below, select a graph which best represents the graph of
A)
B)
C) 1eaa8e2_0f37_9ed6_96ab_237635657d14_TB2033_11
D)
E)
F)
G)
H)
A)
B)
C) 1eaa8e2_0f37_9ed6_96ab_237635657d14_TB2033_11
D)
E)
F)
G)
H)
Unlock Deck
Unlock for access to all 127 flashcards in this deck.
Unlock Deck
k this deck
17
Given the graph of below, select a graph which could be that of y = f (x).
A)
B)
C)
D)
E)
F)
G)
H)
A)
B)
C)
D)
E)
F)
G)
H)
Unlock Deck
Unlock for access to all 127 flashcards in this deck.
Unlock Deck
k this deck
18
Given the graph of below, select a graph which could be that of y = f (x).
A)
B)
C)
D)
E)
F)
G)
H)
A)
B)
C)
D)
E)
F)
G)
H)
Unlock Deck
Unlock for access to all 127 flashcards in this deck.
Unlock Deck
k this deck
19
Given the graph of , answer the questions that follow. (a) Find all values of x at which
(i) f is increasing.(iv) (vii) (ii) f is decreasing.(v) (viii) f has a local maximum.(iii) (vi) (ix) f has a local minimum.(b) Sketch a graph which could represent y = f (x).
, answer the questions that follow. (a) Find all values of x at which(i) f is increasing.(iv)
(vii) (ii) f is decreasing.(v) (viii) f has a local maximum.(iii) (vi) (ix) f has a local minimum.(b) Sketch a graph which could represent y = f (x). Unlock Deck
Unlock for access to all 127 flashcards in this deck.
Unlock Deck
k this deck
20
Given the graph of y = f (x) below, select a graph which best represents the graph of
A)
B)
C)
D)
E)
F)
G)
H)
A)
B)
C)
D)
E)
F)
G)
H)
Unlock Deck
Unlock for access to all 127 flashcards in this deck.
Unlock Deck
k this deck
21
Given the graph of y = f (x) below, sketch the graph of .
. Unlock Deck
Unlock for access to all 127 flashcards in this deck.
Unlock Deck
k this deck
22
If f (1) = 5 and , find an equation of the tangent line at x = 1.
A)y = -3x + 5
B)y = 5x - 3
C)y = -3x + 8
D)y = -3x - 8
E)y = 3x + 8
F)y = 3x - 8
G)Does not exist
H)None of the above
A)y = -3x + 5
B)y = 5x - 3
C)y = -3x + 8
D)y = -3x - 8
E)y = 3x + 8
F)y = 3x - 8
G)Does not exist
H)None of the above
Unlock Deck
Unlock for access to all 127 flashcards in this deck.
Unlock Deck
k this deck
23
Find an equation of the line tangent to f (x) = x2 - 4x at the point (3, - 3).
A)2x - y = 9
E)x - y = 9
B)x - 2y = 9
F)y - x = 9
C)y - 2x = 9
G)2x - y = 4
D)2y - x = 9
H)x - 2y = 4
A)2x - y = 9
E)x - y = 9
B)x - 2y = 9
F)y - x = 9
C)y - 2x = 9
G)2x - y = 4
D)2y - x = 9
H)x - 2y = 4
Unlock Deck
Unlock for access to all 127 flashcards in this deck.
Unlock Deck
k this deck
24
Given the graph of y = f (x) below, sketch the graph of .
. Unlock Deck
Unlock for access to all 127 flashcards in this deck.
Unlock Deck
k this deck
25
If f (-1) = 3 and , find an equation of the tangent line at x = -1.
A)y = -5 + 2x
B)y = 1 + 2x
C)y = -2x + 1
D)y = 5 - 2x
E)y = -1 + 2x
F)y = 5 + 2x
G)Does not exist
H)None of the above
A)y = -5 + 2x
B)y = 1 + 2x
C)y = -2x + 1
D)y = 5 - 2x
E)y = -1 + 2x
F)y = 5 + 2x
G)Does not exist
H)None of the above
Unlock Deck
Unlock for access to all 127 flashcards in this deck.
Unlock Deck
k this deck
26
For the function f whose graph is given, arrange the following values in increasing order and explain your reasoning.
Unlock Deck
Unlock for access to all 127 flashcards in this deck.
Unlock Deck
k this deck
27
Consider the function (a) What is the domain of f?
(b) At what number(s), if any, is f discontinuous? Explain your answer.(c) At what number(s), if any, is f not differentiable? Explain your answer.
(a) What is the domain of f?(b) At what number(s), if any, is f discontinuous? Explain your answer.(c) At what number(s), if any, is f not differentiable? Explain your answer.
Unlock Deck
Unlock for access to all 127 flashcards in this deck.
Unlock Deck
k this deck
28
Below are the graphs of a function and its first and second derivatives. Identify which of the following graphs (a, b, and c) is f (x), which is , and which is . Justify your choices.
, and which is . Justify your choices. Unlock Deck
Unlock for access to all 127 flashcards in this deck.
Unlock Deck
k this deck
29
Determine a function f and a number a where the given limit represents the derivative of f at a.(a) (b) (c) (d)
(b) (c) (d) Unlock Deck
Unlock for access to all 127 flashcards in this deck.
Unlock Deck
k this deck
30
Find the derivative of f (x) = 3x - 5 using the definition of the derivative.
Unlock Deck
Unlock for access to all 127 flashcards in this deck.
Unlock Deck
k this deck
31
The graph of f is given below. State, with reasons, the number(s) at which
(a) f is not differentiable. (b) f is not continuous.
(a) f is not differentiable. (b) f is not continuous.
Unlock Deck
Unlock for access to all 127 flashcards in this deck.
Unlock Deck
k this deck
32
Given the graph of y = f (x), find all values of x for which
(a) (b) (c) (d)
(a)
(b) (c) (d) Unlock Deck
Unlock for access to all 127 flashcards in this deck.
Unlock Deck
k this deck
33
If f (x) = 5, which of the following represents a. e. b.3
F) c. g.Does not exist
D)5
H)None of the above
a. e. b.3F)
c. g.Does not existD)5
H)None of the above
Unlock Deck
Unlock for access to all 127 flashcards in this deck.
Unlock Deck
k this deck
34
Find the derivative of using the definition of the derivative.
using the definition of the derivative. Unlock Deck
Unlock for access to all 127 flashcards in this deck.
Unlock Deck
k this deck
35
Water is flowing into a large cylindrical tank at a constant rate. Let H (t) represent the height of the water level at time t.(a) Sketch a possible graph of H (t).(b) Describe how the rate of change of H with respect to t varies as t increases.(c) Sketch a graph of
Unlock Deck
Unlock for access to all 127 flashcards in this deck.
Unlock Deck
k this deck
36
Given the graph of y = f (x) below, sketch the graph of .
. Unlock Deck
Unlock for access to all 127 flashcards in this deck.
Unlock Deck
k this deck
37
A tank is in the shape of a large, inverted (point-down) cone. Water is owing into the tank
at a constant rate. Let H (t) represent the height of the water level at time t.(a) Sketch a possible graph of H (t).(b) Describe how the rate of change of H with respect to t varies as t increases.(c) Sketch a graph of
at a constant rate. Let H (t) represent the height of the water level at time t.(a) Sketch a possible graph of H (t).(b) Describe how the rate of change of H with respect to t varies as t increases.(c) Sketch a graph of
Unlock Deck
Unlock for access to all 127 flashcards in this deck.
Unlock Deck
k this deck
38
Given the graph of y = f (x) below, sketch the graph of .
. Unlock Deck
Unlock for access to all 127 flashcards in this deck.
Unlock Deck
k this deck
39
Find an equation of the line tangent to the curve y = x + (1/x) at the point
A)24x - 25y = 94
B)24x - 25y = -94
C)25x - 24y = 94
D)25x - 24y = -94
E)24x - 24y = 94
F)24x - 24y = -94
G)25x - 25y = 94
H)25x - 25y = -94
A)24x - 25y = 94
B)24x - 25y = -94
C)25x - 24y = 94
D)25x - 24y = -94
E)24x - 24y = 94
F)24x - 24y = -94
G)25x - 25y = 94
H)25x - 25y = -94
Unlock Deck
Unlock for access to all 127 flashcards in this deck.
Unlock Deck
k this deck
40
The graph of f is given below. State, with reasons, the number(s) at which
(a) f is not differentiable. (b) f is not continuous.
(a) f is not differentiable. (b) f is not continuous.
Unlock Deck
Unlock for access to all 127 flashcards in this deck.
Unlock Deck
k this deck
41
Find the value of the limit
A)
B)
C)
D)
E)
F)
G)0
H)
A)
B)
C)
D)
E)
F)
G)0
H)
Unlock Deck
Unlock for access to all 127 flashcards in this deck.
Unlock Deck
k this deck
42
-During which of the following periods was the rate of change of the average daily temperature the greatest?
A)[2, 3]
B)[3, 4]
C)[4, 5]
D)[5, 6]
E)[6, 7]
F)[2, 4]
G)[3, 5]
H)[3, 6]
Unlock Deck
Unlock for access to all 127 flashcards in this deck.
Unlock Deck
k this deck
43
Given the following information about limits, select a graph which could be the graph of y = f (x).
A)
B)
C)
D)
E)
F)
G)
H)
A)
B)
C)
D)
E)
F)
G)
H)
Unlock Deck
Unlock for access to all 127 flashcards in this deck.
Unlock Deck
k this deck
44
(a) Find the slope of the tangent line to the curve (i)
using Definition 1 from Section 2.6.(ii)
using Definition 2 from Section 2.6.(b) Using your results from part (a), find an equation of the tangent line at (1, 0).
(i)using Definition 1 from Section 2.6.(ii)
using Definition 2 from Section 2.6.(b) Using your results from part (a), find an equation of the tangent line at (1, 0).
Unlock Deck
Unlock for access to all 127 flashcards in this deck.
Unlock Deck
k this deck
45
Find the value of the limit
A)-2
B)1
C)2
D)4
E)-1
F)-3
G)0
H)3
A)-2
B)1
C)2
D)4
E)-1
F)-3
G)0
H)3
Unlock Deck
Unlock for access to all 127 flashcards in this deck.
Unlock Deck
k this deck
46
Find the value of the limit
A)3
B)
C)0
D)1
E)2
F)
G)
H)-3
A)3
B)
C)0
D)1
E)2
F)
G)
H)-3
Unlock Deck
Unlock for access to all 127 flashcards in this deck.
Unlock Deck
k this deck
47
Find the value of the limit
A)-2
B)1
C)
D)4
E)
F)2
G)0
H)-1
A)-2
B)1
C)
D)4
E)
F)2
G)0
H)-1
Unlock Deck
Unlock for access to all 127 flashcards in this deck.
Unlock Deck
k this deck
48
Suppose that . f is not defined for .(a) For which of these two values does f have an infinite discontinuity? Explain.(b) For which of these two values does f have a removable discontinuity? Explain.
. f is not defined for .(a) For which of these two values does f have an infinite discontinuity? Explain.(b) For which of these two values does f have a removable discontinuity? Explain. Unlock Deck
Unlock for access to all 127 flashcards in this deck.
Unlock Deck
k this deck
49
Below are the sunrise and sunset times (in standard time) for Moorhead, Minnesota on the 21st of each month in 2007.Sunrise and Sunset in Moorhead, Minnesota on the 21st of each month in 2007
Date
Day of Year
Sunrise
Sunset
Day Length (h)
Jan 21
21
08:03
17:14
9.18
Feb 21
52
07:21
18:01
10.67
Mar 21
80
06:28
18:41
12.22
Apr 21
111
05:29
19:24
13.92
May 21
141
04:45
20:02
15.28
Jun 21
172
04:32
20:25
15.88
Jul 21
202
04:54
20:12
15.30
Aug 21
233
05:32
19:27
13.92
Sep 21
264
06:12
18:27
12.25
Oct 21
294
06:53
17:29
10.60
Nov 21
325
07:39
16:47
9.13
Dec 21
355
08:09
16:41
8.53
(a) Find the rate of change in day length with respect to time (in hours per day)
(i)
from March 21 through July 21.(ii)
from March 21 through May 21.(iii)
from March 21 through April 21.(b) Estimate the instantaneous rate of change in day length per day (in hours per day) for March 21.(c) During which one-month period did the day length change the greatest amount?
(d) During which one month period did the average change in day length change the greatest amount? Is this the same time period as in part (c)? Explain.
Unlock Deck
Unlock for access to all 127 flashcards in this deck.
Unlock Deck
k this deck
50
Find the value of x at which the curve has a vertical asymptote.
A)-4
B)-3
C)-2
D)-1
E)
F)1
G)2
H)3
A)-4
B)-3
C)-2
D)-1
E)
F)1
G)2
H)3
Unlock Deck
Unlock for access to all 127 flashcards in this deck.
Unlock Deck
k this deck
51
The following table shows the relationship between pressure (in atmospheres) and volume (in liters) of hydrogen gas at 0 C.
(a) Find the average rate of change of volume with respect to pressure for the following pressure intervals:
(i) [3, 5]
(ii) [3, 4]
(iii) [2, 3]
(b) Estimate the rate of change of volume with respect to pressure if the pressure is 2 atmospheres.
(a) Find the average rate of change of volume with respect to pressure for the following pressure intervals:
(i) [3, 5]
(ii) [3, 4]
(iii) [2, 3]
(b) Estimate the rate of change of volume with respect to pressure if the pressure is 2 atmospheres.
Unlock Deck
Unlock for access to all 127 flashcards in this deck.
Unlock Deck
k this deck
52
Using the graph below, determine the following: (a) (b) (c) (d) (e) (f) (g) Find the horizontal asymptote(s) of the graph of y = f (x).(h) Find the vertical asymptote(s) of the graph of y = f (x).
(a) (b) (c) (d) (e) (f) (g) Find the horizontal asymptote(s) of the graph of y = f (x).(h) Find the vertical asymptote(s) of the graph of y = f (x). Unlock Deck
Unlock for access to all 127 flashcards in this deck.
Unlock Deck
k this deck
53
-During which of the following periods was the rate of change of the average daily temperature the smallest?
A)[2, 6]
B)[4, 8]
C)[4, 9]
D)[6, 10]
E)[8, 10]
F)[9, 10]
G)[10, 11]
H)[11, 12]
Unlock Deck
Unlock for access to all 127 flashcards in this deck.
Unlock Deck
k this deck
54
Find the value of x at which the curve has a vertical asymptote.
A)-4
B)-3
C)-2
D)-1
E)0
F)1
G)2
H)3
A)-4
B)-3
C)-2
D)-1
E)0
F)1
G)2
H)3
Unlock Deck
Unlock for access to all 127 flashcards in this deck.
Unlock Deck
k this deck
55
Given the following information about limits, select a graph which could be the graph of y = f (x).
A)
B)
C)
D)
E)
F)
G)
H)
A)
B)
C)
D)
E)
F)
G)
H)
Unlock Deck
Unlock for access to all 127 flashcards in this deck.
Unlock Deck
k this deck
56
Find the value of the limit
A)
B)3
C)7
D)
E)-3
F)
G)-7
H)
A)
B)3
C)7
D)
E)-3
F)
G)-7
H)
Unlock Deck
Unlock for access to all 127 flashcards in this deck.
Unlock Deck
k this deck
57
Find the value of the limit
A)
B)1
C)2
D)
E)-1
F)
G)-2
H)
A)
B)1
C)2
D)
E)-1
F)
G)-2
H)
Unlock Deck
Unlock for access to all 127 flashcards in this deck.
Unlock Deck
k this deck
58
Given the following information about limits, select a graph which could be the graph of y = f (x).
A)
B)
C)
D)
E)
F)
G)
H)
A)
B)
C)
D)
E)
F)
G)
H)
Unlock Deck
Unlock for access to all 127 flashcards in this deck.
Unlock Deck
k this deck
59
The following table shows the concentration (in mol/l) of a certain chemical in terms of reaction time (in hours) during a decomposition reaction.Time (hours)
0
5
10
20
30
50
Concentration (mol/L)
2.32
1.86
1.49
0.98
0.62
0.25
(a) Find the average rate of change of concentration with respect to time for the following time intervals:
(i) [0; 5] (ii) [10; 20] (iii) [30; 50]
(b) Plot the points from the table and fit an appropriate exponential model to the data.(c) From your model in part (b), determine the instantaneous rate of change of concentration with respect to time.(d) Is the rate of change of concentration increasing or decreasing with respect to time? Justify your answer.
Unlock Deck
Unlock for access to all 127 flashcards in this deck.
Unlock Deck
k this deck
60
The following table contains data from the historic flood of the Cedar River at Cedar Rapids, Iowa during June 2008. Readings were taken at 6:00 A.M. each day.Day
Stage (ft)
08
10.46
09
13.79
10
17.54
11
19.62
12
25.88
13
31.03
14
29.23
15
24.93
16
21.95
17
20.13
18
18.85
19
16.25
20
13.63
21
12.12
22
10.94
Source: US Army Corps of Engineers - Rock Island District - Water Control Center
(a) Find the average daily rate of change of the river level over each of the following periods:
(i) [08, 13]
(ii) [13, 22]
(iii) [12, 13]
(iv) [13, 14]
(b) Estimate the daily rate of change of the stage level on June 14th.
Unlock Deck
Unlock for access to all 127 flashcards in this deck.
Unlock Deck
k this deck
61
At what value(s) of x is the function
Unlock Deck
Unlock for access to all 127 flashcards in this deck.
Unlock Deck
k this deck
62
Given the following information about limits, sketch a graph which could be the graph of y = f (x). Label all horizontal and vertical asymptotes.
Unlock Deck
Unlock for access to all 127 flashcards in this deck.
Unlock Deck
k this deck
63
At what value(s) of x is the function discontinuous?
discontinuous? Unlock Deck
Unlock for access to all 127 flashcards in this deck.
Unlock Deck
k this deck
64
Find the distance between the two values of x at which the function is discontinuous.
A)3
B)2
C)8
D)1
E)5
F)4
G)7
H)6
A)3
B)2
C)8
D)1
E)5
F)4
G)7
H)6
Unlock Deck
Unlock for access to all 127 flashcards in this deck.
Unlock Deck
k this deck
65
Determine whether each function is continuous or discontinuous. Explain your choice.(a) Postage charges to send a letter by first class mail.(b) The altitude of an airplane as a function of the time it has been in the air.(c) The temperature of an oven as it is run through its self cleaning cycle.(d) The number of people waiting in a queue for a bank teller.
Unlock Deck
Unlock for access to all 127 flashcards in this deck.
Unlock Deck
k this deck
66
Use the Intermediate Value Theorem to show that x3 - 5x - 7 = 0 for some value of x in (2, 3).
Unlock Deck
Unlock for access to all 127 flashcards in this deck.
Unlock Deck
k this deck
67
At what value(s) of x is the function discontinuous?
A)-1
B)0
C)1
D)-1, 0
E)0, 1
F)-1, 1
G)-1, 0, 1
H)None
A)-1
B)0
C)1
D)-1, 0
E)0, 1
F)-1, 1
G)-1, 0, 1
H)None
Unlock Deck
Unlock for access to all 127 flashcards in this deck.
Unlock Deck
k this deck
68
Given the following information about limits, sketch a graph which could be the graph of y = f (x). Label all horizontal and vertical asymptotes.
Unlock Deck
Unlock for access to all 127 flashcards in this deck.
Unlock Deck
k this deck
69
Suppose that f (x) is defined on [1, 3] and that f (1) = 3 and f (3) = 5. Sketch a possible graph of f that does not satisfy the conclusion of the Intermediate Value Theorem.
Unlock Deck
Unlock for access to all 127 flashcards in this deck.
Unlock Deck
k this deck
70
Find the limit.(a) (b) (c)
(b) (c) Unlock Deck
Unlock for access to all 127 flashcards in this deck.
Unlock Deck
k this deck
71
Given the following information about limits, sketch a graph which could be the graph of y = f (x). Label all horizontal and vertical asymptotes.
Unlock Deck
Unlock for access to all 127 flashcards in this deck.
Unlock Deck
k this deck
72
At what value(s) of x does the function have a removable discontinuity?
A)-3
B)3
C)2
D)-1
E)1
F)-4
G)-2
H)4
A)-3
B)3
C)2
D)-1
E)1
F)-4
G)-2
H)4
Unlock Deck
Unlock for access to all 127 flashcards in this deck.
Unlock Deck
k this deck
73
A cellular phone company has a roaming charge of 32 cents for every minute or fraction of a minute when you are out of your zone.(a) Sketch a graph of the "out-of-your-zone" costs of cellular phone usage as a function of the length of the call.(b) Discuss the discontinuities of this function and their significance to the cell phone user.
Unlock Deck
Unlock for access to all 127 flashcards in this deck.
Unlock Deck
k this deck
74
Find the limit.(a) (b) (c)
(b) (c) Unlock Deck
Unlock for access to all 127 flashcards in this deck.
Unlock Deck
k this deck
75
The definition of continuity of f (x) at a point requires three things. List these three conditions, and in each case give an example (a graph or a formula) which illustrates how this condition can fail at x = a.
Unlock Deck
Unlock for access to all 127 flashcards in this deck.
Unlock Deck
k this deck
76
Find the constant(s) c that make(s) the function continuous on .
A)-4, -2
B)2, 0
C)2
D)4
E)-2, 4
F)-2
G)0
H)Does not exist
A)-4, -2
B)2, 0
C)2
D)4
E)-2, 4
F)-2
G)0
H)Does not exist
Unlock Deck
Unlock for access to all 127 flashcards in this deck.
Unlock Deck
k this deck
77
At what value(s) of x does the function have an infinite discontinuity?
A)3
B)-4
C)-2
D)-3
E)-1
F)1
G)2
H)4
A)3
B)-4
C)-2
D)-3
E)-1
F)1
G)2
H)4
Unlock Deck
Unlock for access to all 127 flashcards in this deck.
Unlock Deck
k this deck
78
Find the vertical asymptote(s) of the curve
Unlock Deck
Unlock for access to all 127 flashcards in this deck.
Unlock Deck
k this deck
79
Given the graph of f below, state the intervals on which f is continuous.
Unlock Deck
Unlock for access to all 127 flashcards in this deck.
Unlock Deck
k this deck
80
Find the limit.(a) (b) (c)
(b) (c) Unlock Deck
Unlock for access to all 127 flashcards in this deck.
Unlock Deck
k this deck
Unlock Deck
Unlock for access to all 127 flashcards in this deck.


