Exam 2: Limits and Derivatives
Exam 1: Functions and Models118 Questions
Exam 2: Limits and Derivatives127 Questions
Exam 3: Differentiation Rules248 Questions
Exam 4: Applications of Differentiation273 Questions
Exam 5: Integrals239 Questions
Exam 6: Applications of Integration189 Questions
Exam 7: Differential Equations154 Questions
Exam 8: Infinite Sequences and Series341 Questions
Exam 9: Vectors and the Geometry of Space269 Questions
Exam 10: Vector Functions111 Questions
Exam 11: Partial Derivatives294 Questions
Exam 12: Multiple Integrals270 Questions
Exam 13: Vector Calculus240 Questions
Select questions type
Water is flowing into a large cylindrical tank at a constant rate. Let H (t) represent the height of the water level at time t.(a) Sketch a possible graph of H (t).(b) Describe how the rate of change of H with respect to t varies as t increases.(c) Sketch a graph of
Free
(Essay)
4.8/5  (41)
(41)
Correct Answer: Verified
(a) 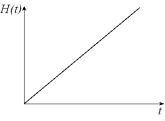 (c)
(c) 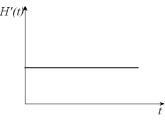 (b) is constant.
Given the graph of y = f (x) below, sketch the graph of . 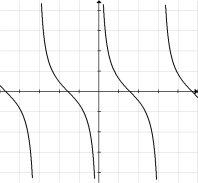
Free
(Essay)
4.8/5 (37)
Correct Answer:Verified
Given the graph of y = f (x) below, select a graph which best represents the graph of 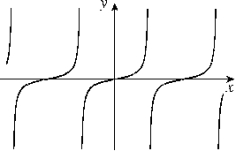
Free
(Multiple Choice)
4.8/5 (40)
Correct Answer:Verified
E
Given the graph of y = f (x) below, select a graph which best represents the graph of 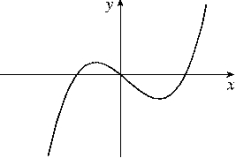
(Multiple Choice)
4.8/5 (34)
Given the following information about limits, sketch a graph which could be the graph of y = f (x). Label all horizontal and vertical asymptotes. f(x)=f(x)=1f(x)=f(x)=-\infty f(x)=f(x)=\inftyf=(0)=-1
(Essay)
5.0/5 (36)
Determine a function f and a number a where the given limit represents the derivative of f at a.(a) (b) (c) (d)
(Essay)
4.8/5 (31)
Find an equation of the line tangent to f (x) = x2 - 4x at the point (3, - 3).
(Multiple Choice)
4.8/5 (31)
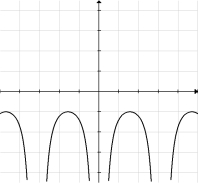
Given the graph of below, select a graph which could be that of y = f (x). 
(Multiple Choice)
4.7/5 (33)
 -For the function whose graph is given above, determine f (-2).
(Multiple Choice)
4.8/5 (30)
(a) Find the slope of the tangent line to the curve (i)
using Definition 1 from Section 2.6.(ii)
using Definition 2 from Section 2.6.(b) Using your results from part (a), find an equation of the tangent line at (1, 0).
(Essay)
4.8/5 (35)
Suppose you drive for 60 miles at 60 miles per hour, then for 60 miles at 30 miles per hour. In miles per hour, what is your average velocity?
(Multiple Choice)
4.9/5 (37)
Given the graph of , answer the questions that follow. 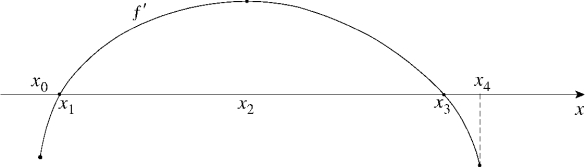 (a) Find all values of x at which
(i) f is increasing.(iv) (vii) (ii) f is decreasing.(v) f has an inflection point.(viii) f has a local maximum.(iii) (b) Sketch a graph which could represent y = f (x).
(a) Find all values of x at which
(i) f is increasing.(iv) (vii) (ii) f is decreasing.(v) f has an inflection point.(viii) f has a local maximum.(iii) (b) Sketch a graph which could represent y = f (x).
(Essay)
4.7/5 (34)
The following table shows the relationship between pressure (in atmospheres) and volume (in liters) of hydrogen gas at 0 C.
Pressure (atm) 1 2 3 4 5 6 Volume (L) 22.4 11.2 7.5 5.6 4.5 3.7
(a) Find the average rate of change of volume with respect to pressure for the following pressure intervals:
(i) [3, 5]
(ii) [3, 4]
(iii) [2, 3]
(b) Estimate the rate of change of volume with respect to pressure if the pressure is 2 atmospheres.
(Essay)
4.8/5 (34)
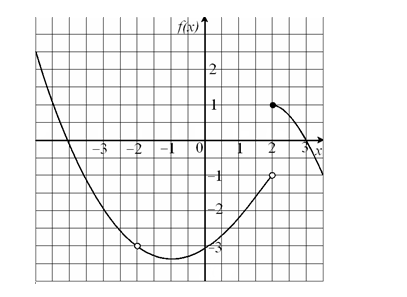
Use the graph of f below to determine the value of each of the following quantities, if it exists. If it does not exist, explain why. 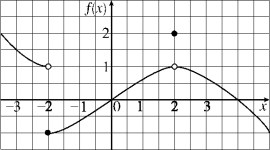 (a) (b) (c) (d) f (-2)
(e) f (2)
(a) (b) (c) (d) f (-2)
(e) f (2)
(Essay)
4.8/5 (32)
The following table contains data from the historic flood of the Cedar River at Cedar Rapids, Iowa during June 2008. Readings were taken at 6:00 A.M. each day. Day Stage (ft) 08 10.46 09 13.79 10 17.54 11 19.62 12 25.88 13 31.03 14 29.23 15 24.93 16 21.95 17 20.13 18 18.85 19 16.25 20 13.63 21 12.12 22 10.94
Source: US Army Corps of Engineers - Rock Island District - Water Control Center
(a) Find the average daily rate of change of the river level over each of the following periods:
(i) [08, 13]
(ii) [13, 22]
(iii) [12, 13]
(iv) [13, 14]
(b) Estimate the daily rate of change of the stage level on June 14th.
(Essay)
4.9/5 (39)
Below are the sunrise and sunset times (in standard time) for Moorhead, Minnesota on the 21st of each month in 2007.
Date Day of Year Sunrise Sunset Day Length (h) Jan 21 21 08:03 17:14 9.18 Feb 21 52 07:21 18:01 10.67 Mar 21 80 06:28 18:41 12.22 Apr 21 111 05:29 19:24 13.92 May 21 141 04:45 20:02 15.28 Jun 21 172 04:32 20:25 15.88 Jul 21 202 04:54 20:12 15.30 Aug 21 233 05:32 19:27 13.92
(a) Find the rate of change in day length with respect to time (in hours per day)
(i)
from March 21 through July 21.(ii)
from March 21 through May 21.(iii)
from March 21 through April 21.(b) Estimate the instantaneous rate of change in day length per day (in hours per day) for March 21.(c) During which one-month period did the day length change the greatest amount?
(d) During which one month period did the average change in day length change the greatest amount? Is this the same time period as in part (c)? Explain.
(Essay)
4.8/5 (33)
Filters
- Essay(0)
- Multiple Choice(0)
- Short Answer(0)
- True False(0)
- Matching(0)