Deck 3: Data Description
Full screen (f)
Question
Question
Question
Question
Question
Question
Question
A random sample of weights (in carats) of sapphires in a jeweler's collection is shown. Find the mean of the sample. 
A) 12.20
B) 5.03
C) 4.92
D) 5.95
A) 12.20
B) 5.03
C) 4.92
D) 5.95
Question
Question
Question
Question
Question
Question
A recent survey of a new diet cola reported the following percentages of people who liked the taste. Find the weighted mean of the percentages. 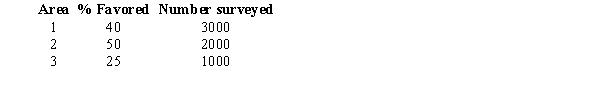
A) 41
B) 38
C) 36
D) 40
A) 41
B) 38
C) 36
D) 40
Question
Question
Question
Question
Question
Question
Question
Question
Question
Question
Question
Question
Question
If a distribution is negatively skewed as shown in the figure below, the mean will fall to the right of the median and the mode will fall to the left of the median. 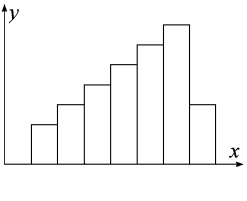
Question
Question
Question
Question
In a unimodal, symmetrical distribution as shown in the figure below, 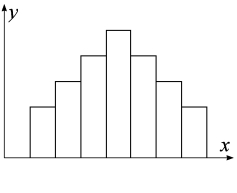
A) the mean is the same as the median, but the mode can be different.
B) the mean, the median, and the mode are the same.
C) the median and the mode are the same, but the mean can be different.
D) the mean, the median, and the mode are different.
A) the mean is the same as the median, but the mode can be different.
B) the mean, the median, and the mode are the same.
C) the median and the mode are the same, but the mean can be different.
D) the mean, the median, and the mode are different.
Question
Question
Question
Question
A student received the following grades last semester. Find the student's semester grade point average. 
A) 3.20
B) 3.80
C) 3.57
D) 3.32
A) 3.20
B) 3.80
C) 3.57
D) 3.32
Question
Question
Question
Question
Question
Question
Question
Question
Question
Which of the following is true?
A)
B)
C)
D)
A)
B)
C)
D)
Question
Question
The costs per load (in cents) of 26 dish-washing detergents tested by a consumer organization are shown here. Find the standard deviation of the sample. 
A) 10.2
B) 10.0
C) 10.4
D) 5.9
A) 10.2
B) 10.0
C) 10.4
D) 5.9
Question
Question
Question
Indicate which student has the higher z score. 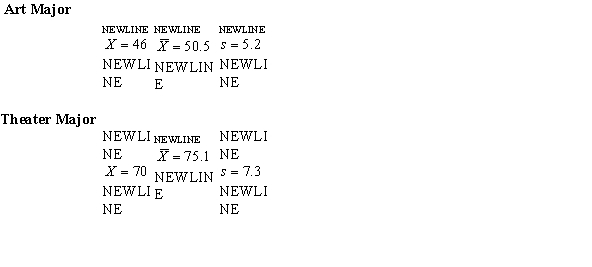
A) The art major has a higher score than the theater major.
B) The theater major has a higher score than the art major.
C) Both students have the same score.
D) Neither student received a positive score; therefore, the higher score cannot be determined.
A) The art major has a higher score than the theater major.
B) The theater major has a higher score than the art major.
C) Both students have the same score.
D) Neither student received a positive score; therefore, the higher score cannot be determined.
Question
Question
Question
Question
Question
Question
Question
Question
Question
Question
Question
Question
Question
Given the following boxplot where m is the median value, what statement could be made about the distribution of the data? 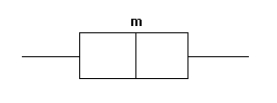
A) The distribution is approximately symmetric.
B) The distribution is positively skewed.
C) The distribution is negatively skewed.
D) The data are nominal and consequently can not be identified as symmetric or skewed.
A) The distribution is approximately symmetric.
B) The distribution is positively skewed.
C) The distribution is negatively skewed.
D) The data are nominal and consequently can not be identified as symmetric or skewed.
Question
Which plot below has a five-number summary of 5, 7, 8, 12, 13 and an interquartile range of 5?
A)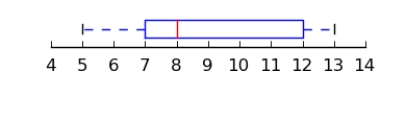
B)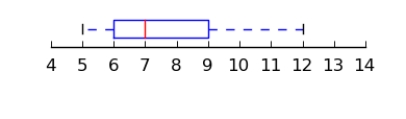
C)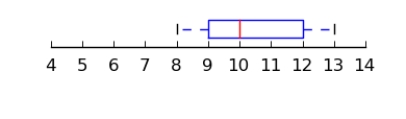
D)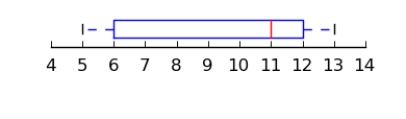
A)
B)
C)
D)
Question
Question
The data shown represents the high scores for members of a bowling league over a particular season. Find the approximate percentile rank of a score of 266 by constructing a percentile graph. 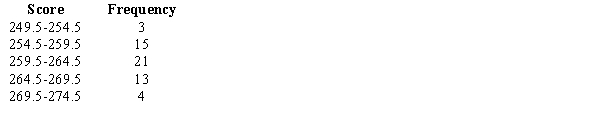
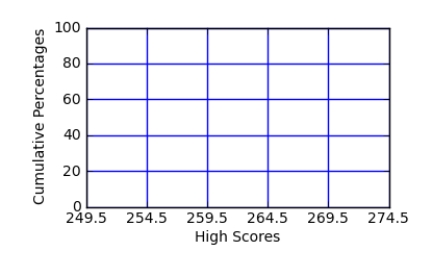
A) 77
B) 72
C) 67
D) 62
A) 77
B) 72
C) 67
D) 62
Question
Using the table below, what grade would a student who ranked in the 50th percentile receive. 
A) B
B) C
C) D
D) F
A) B
B) C
C) D
D) F
Question
Question
Question
Question
Question
A five-number summary of a data set consists of the minimum,  , the median,
  , and the maximum.
, the median, , and the maximum. Question
Question
Question

Unlock Deck
Sign up to unlock the cards in this deck!
Unlock Deck
Unlock Deck
1/73
Play
Full screen (f)
Deck 3: Data Description
1
What is the midrange of the following data set?
1, 7, 6, 8, 0, 8, 14, 14, 14
A) 7
B) 8
C) 1
D) 14
1, 7, 6, 8, 0, 8, 14, 14, 14
A) 7
B) 8
C) 1
D) 14
A
2
What is the mean of the following data set?
6, 10, 13, 14, 15
A) 9.0
B) 11.6
C) 13.0
D) 16.4
6, 10, 13, 14, 15
A) 9.0
B) 11.6
C) 13.0
D) 16.4
B
3
Find the mean of the following set of values.
4, 11, 9, 7, 9
4, 11, 9, 7, 9
8.0
4
Which of the following is the properly rounded mean for the given data?
7, 8, 13, 9, 10, 11
A) 10
B) 9.7
C) 9.67
D) 9
7, 8, 13, 9, 10, 11
A) 10
B) 9.7
C) 9.67
D) 9
Unlock Deck
Unlock for access to all 73 flashcards in this deck.
Unlock Deck
k this deck
5
Find the median for the following data.
6, 7, 4, 5, 3, 7, 4
A) 3
B) 4
C) 5
D) 7
6, 7, 4, 5, 3, 7, 4
A) 3
B) 4
C) 5
D) 7
Unlock Deck
Unlock for access to all 73 flashcards in this deck.
Unlock Deck
k this deck
6
Find the mode for the following data?
5, 4, 3, 4, 5, 6, 5, 5, 3, 4
A) 3
B) 4
C) 5
D) 6
5, 4, 3, 4, 5, 6, 5, 5, 3, 4
A) 3
B) 4
C) 5
D) 6
Unlock Deck
Unlock for access to all 73 flashcards in this deck.
Unlock Deck
k this deck
7
A random sample of weights (in carats) of sapphires in a jeweler's collection is shown. Find the mean of the sample.
A) 12.20
B) 5.03
C) 4.92
D) 5.95
A) 12.20
B) 5.03
C) 4.92
D) 5.95
Unlock Deck
Unlock for access to all 73 flashcards in this deck.
Unlock Deck
k this deck
8
The number of police officers in selected city districts is listed below. Find the mode.
24, 26, 24, 30, 23, 28, 19, 31, 24, 26, 19
A) 23
B) 24
C) 26
D) 28
24, 26, 24, 30, 23, 28, 19, 31, 24, 26, 19
A) 23
B) 24
C) 26
D) 28
Unlock Deck
Unlock for access to all 73 flashcards in this deck.
Unlock Deck
k this deck
9
What is the median of the following set of values?
7, 21, 19, 15, 19, 14, 15, 19
A) 13
B) 17
C) 15
D) 19
7, 21, 19, 15, 19, 14, 15, 19
A) 13
B) 17
C) 15
D) 19
Unlock Deck
Unlock for access to all 73 flashcards in this deck.
Unlock Deck
k this deck
10
What is the median of the following set of values?
10, 8, 5, 3, 14
A) 5
B) 7
C) 8
D) 9
10, 8, 5, 3, 14
A) 5
B) 7
C) 8
D) 9
Unlock Deck
Unlock for access to all 73 flashcards in this deck.
Unlock Deck
k this deck
11
Find the mean, mode, median, and midrange for the following data set.
12, 15, 18, 18, 15, 22, 15, 30, 12
12, 15, 18, 18, 15, 22, 15, 30, 12
Unlock Deck
Unlock for access to all 73 flashcards in this deck.
Unlock Deck
k this deck
12
For the data set 1, 8, 7, 2, 9, 15, 18, the properly rounded mean is 9.
Unlock Deck
Unlock for access to all 73 flashcards in this deck.
Unlock Deck
k this deck
13
A recent survey of a new diet cola reported the following percentages of people who liked the taste. Find the weighted mean of the percentages.
A) 41
B) 38
C) 36
D) 40
A) 41
B) 38
C) 36
D) 40
Unlock Deck
Unlock for access to all 73 flashcards in this deck.
Unlock Deck
k this deck
14
Find the median of the following data set.
8, 10, 10, 10, 8, 14
8, 10, 10, 10, 8, 14
Unlock Deck
Unlock for access to all 73 flashcards in this deck.
Unlock Deck
k this deck
15
Find the mean of the following data set?
11, 6, 9, 4, 15
A) 6.0
B) 8.0
C) 9.0
D) 10.0
11, 6, 9, 4, 15
A) 6.0
B) 8.0
C) 9.0
D) 10.0
Unlock Deck
Unlock for access to all 73 flashcards in this deck.
Unlock Deck
k this deck
16
What is the median of the following data set?
8, 11, 15, 16, 20
A) 14
B) 15
C) 16
D) 18
8, 11, 15, 16, 20
A) 14
B) 15
C) 16
D) 18
Unlock Deck
Unlock for access to all 73 flashcards in this deck.
Unlock Deck
k this deck
17
What is the mode of the following data set?
8, 22, 20, 16, 20, 18, 15
A) 14
B) 18
C) 16
D) 20
8, 22, 20, 16, 20, 18, 15
A) 14
B) 18
C) 16
D) 20
Unlock Deck
Unlock for access to all 73 flashcards in this deck.
Unlock Deck
k this deck
18
Find the median of the following data set.
2, 9, 6, 5, 2
2, 9, 6, 5, 2
Unlock Deck
Unlock for access to all 73 flashcards in this deck.
Unlock Deck
k this deck
19
Find the weighted mean for a particular student's scores on three exams if the first one was worth 75 points and the student received a score of 70%, the second was worth 50 points and the student received a score of 80%, and the third was worth 30 points and the student received a score of 95%?
Unlock Deck
Unlock for access to all 73 flashcards in this deck.
Unlock Deck
k this deck
20
Find the mean of the following data set.
7, 9, 9, 9, 7, 13
7, 9, 9, 9, 7, 13
Unlock Deck
Unlock for access to all 73 flashcards in this deck.
Unlock Deck
k this deck
21
A ______________ is the midpoint in a data array.
Unlock Deck
Unlock for access to all 73 flashcards in this deck.
Unlock Deck
k this deck
22
A distribution in which approximately 68% of the data values fall within one standard deviation of the mean behaves according to
A) the empirical rule.
B) a symmetrical distribution.
C) a boxplot.
D) differential statistics.
A) the empirical rule.
B) a symmetrical distribution.
C) a boxplot.
D) differential statistics.
Unlock Deck
Unlock for access to all 73 flashcards in this deck.
Unlock Deck
k this deck
23
The variance of a data set is the square root of the standard deviation.
Unlock Deck
Unlock for access to all 73 flashcards in this deck.
Unlock Deck
k this deck
24
A characteristic or measure obtained by using all the data values for a specific population is called a ___________.
A) variable
B) mode
C) statistic
D) parameter
A) variable
B) mode
C) statistic
D) parameter
Unlock Deck
Unlock for access to all 73 flashcards in this deck.
Unlock Deck
k this deck
25
The _______________and ______________ are two measures of variation used to describe the spread of the data in a data set.
Unlock Deck
Unlock for access to all 73 flashcards in this deck.
Unlock Deck
k this deck
26
If a distribution is negatively skewed as shown in the figure below, the mean will fall to the right of the median and the mode will fall to the left of the median.
Unlock Deck
Unlock for access to all 73 flashcards in this deck.
Unlock Deck
k this deck
27
The range of a data set is the difference between the highest value and the lowest value.
Unlock Deck
Unlock for access to all 73 flashcards in this deck.
Unlock Deck
k this deck
28
The grades for the trigonometry exam are listed below. Find the range.
85, 76, 93, 82, 84, 90, 75
A) 76
B) 9
C) 11
D) 18
85, 76, 93, 82, 84, 90, 75
A) 76
B) 9
C) 11
D) 18
Unlock Deck
Unlock for access to all 73 flashcards in this deck.
Unlock Deck
k this deck
29
Determine the range for the following data set.
4, 15, 8, 6, 20
A) 4
B) 8
C) 16
D) 20
4, 15, 8, 6, 20
A) 4
B) 8
C) 16
D) 20
Unlock Deck
Unlock for access to all 73 flashcards in this deck.
Unlock Deck
k this deck
30
In a unimodal, symmetrical distribution as shown in the figure below,
A) the mean is the same as the median, but the mode can be different.
B) the mean, the median, and the mode are the same.
C) the median and the mode are the same, but the mean can be different.
D) the mean, the median, and the mode are different.
A) the mean is the same as the median, but the mode can be different.
B) the mean, the median, and the mode are the same.
C) the median and the mode are the same, but the mean can be different.
D) the mean, the median, and the mode are different.
Unlock Deck
Unlock for access to all 73 flashcards in this deck.
Unlock Deck
k this deck
31
The ________________ is the mode for grouped data.
Unlock Deck
Unlock for access to all 73 flashcards in this deck.
Unlock Deck
k this deck
32
The range of the following data set is _______.
9, 5, 14, 22, 12
9, 5, 14, 22, 12
Unlock Deck
Unlock for access to all 73 flashcards in this deck.
Unlock Deck
k this deck
33
The median can be a more appropriate measure of central tendency if the distribution of the data is extremely skewed.
Unlock Deck
Unlock for access to all 73 flashcards in this deck.
Unlock Deck
k this deck
34
A student received the following grades last semester. Find the student's semester grade point average.
A) 3.20
B) 3.80
C) 3.57
D) 3.32
A) 3.20
B) 3.80
C) 3.57
D) 3.32
Unlock Deck
Unlock for access to all 73 flashcards in this deck.
Unlock Deck
k this deck
35
Chebyshev's theorem can be used to find the minimum percentage of the values in a data set that will fall within a certain distance of the mean.
Unlock Deck
Unlock for access to all 73 flashcards in this deck.
Unlock Deck
k this deck
36
The coefficient of variation for a data set is the mean divided by the standard deviation, expressed as a percentage.
Unlock Deck
Unlock for access to all 73 flashcards in this deck.
Unlock Deck
k this deck
37
The ______________ is the average of the squares of the distance each value is from the mean.
Unlock Deck
Unlock for access to all 73 flashcards in this deck.
Unlock Deck
k this deck
38
Determine the range for the following data set.
4, 7, 3, 16, 5, 22, 8
A) 4
B) 3
C) 14
D) 19
4, 7, 3, 16, 5, 22, 8
A) 4
B) 3
C) 14
D) 19
Unlock Deck
Unlock for access to all 73 flashcards in this deck.
Unlock Deck
k this deck
39
A weighted mean is used when the values of the data set are not all equally represented.
Unlock Deck
Unlock for access to all 73 flashcards in this deck.
Unlock Deck
k this deck
40
_______________ identifies a minimum percentage of the data points that fall within a certain distance of the mean, and it applies to any distribution regardless of its shape.
Unlock Deck
Unlock for access to all 73 flashcards in this deck.
Unlock Deck
k this deck
41
Given that the variance for a data set is 1.20, what is the standard deviation?
A) 1.10
B) 1.44
C) 1.20
D) 0.60
A) 1.10
B) 1.44
C) 1.20
D) 0.60
Unlock Deck
Unlock for access to all 73 flashcards in this deck.
Unlock Deck
k this deck
42
The percentile corresponding to a given data value X is computed by adding the 0.5 to number of values less than X then dividing by the total number of values in the data set.
Unlock Deck
Unlock for access to all 73 flashcards in this deck.
Unlock Deck
k this deck
43
Which of the following is true?
A)
B)
C)
D)
A)
B)
C)
D)
Unlock Deck
Unlock for access to all 73 flashcards in this deck.
Unlock Deck
k this deck
44
If a set of data has mean 48 and variance 9, then it's coefficient of variation is ________.
Unlock Deck
Unlock for access to all 73 flashcards in this deck.
Unlock Deck
k this deck
45
The costs per load (in cents) of 26 dish-washing detergents tested by a consumer organization are shown here. Find the standard deviation of the sample.
A) 10.2
B) 10.0
C) 10.4
D) 5.9
A) 10.2
B) 10.0
C) 10.4
D) 5.9
Unlock Deck
Unlock for access to all 73 flashcards in this deck.
Unlock Deck
k this deck
46
What is the range of the set of values 4, 8, 2, 9, and 17.
A) 4
B) 8
C) 19
D) 15
A) 4
B) 8
C) 19
D) 15
Unlock Deck
Unlock for access to all 73 flashcards in this deck.
Unlock Deck
k this deck
47
Find the range of the set of values 7, 15, 3, 10, and 5.
A) 3
B) 15
C) 9
D) 12
A) 3
B) 15
C) 9
D) 12
Unlock Deck
Unlock for access to all 73 flashcards in this deck.
Unlock Deck
k this deck
48
Indicate which student has the higher z score.
A) The art major has a higher score than the theater major.
B) The theater major has a higher score than the art major.
C) Both students have the same score.
D) Neither student received a positive score; therefore, the higher score cannot be determined.
A) The art major has a higher score than the theater major.
B) The theater major has a higher score than the art major.
C) Both students have the same score.
D) Neither student received a positive score; therefore, the higher score cannot be determined.
Unlock Deck
Unlock for access to all 73 flashcards in this deck.
Unlock Deck
k this deck
49
If a student scored 88 points on a test where the mean score was 80.2 and the standard deviation was 5.7. The student's z score is _______.
A) 14.07
B) 15.44
C) 0.24
D) 1.37
A) 14.07
B) 15.44
C) 0.24
D) 1.37
Unlock Deck
Unlock for access to all 73 flashcards in this deck.
Unlock Deck
k this deck
50
The average age of Stokes County school board members over the last 40 years has been 55, but members have ranged from 32 to 70. Use the range rule of thumb to estimate the standard deviation of the members' ages.
A) 19
B) 25.5
C) 9.5
D) 52.3
A) 19
B) 25.5
C) 9.5
D) 52.3
Unlock Deck
Unlock for access to all 73 flashcards in this deck.
Unlock Deck
k this deck
51
______________ are either extremely high or extremely low data values compared with the rest of the data.
Unlock Deck
Unlock for access to all 73 flashcards in this deck.
Unlock Deck
k this deck
52
The interquartile range IQR is found by subtracting the mean from the maximum value of a data set.
Unlock Deck
Unlock for access to all 73 flashcards in this deck.
Unlock Deck
k this deck
53
A baseball player has a batting average of 0.325 each week of the season, with a standard deviation of 0.065. What is the z score when he bats 0.410 one week?
A) 1.308
B) 0.410
C) 0.325
D) 1.275
A) 1.308
B) 0.410
C) 0.325
D) 1.275
Unlock Deck
Unlock for access to all 73 flashcards in this deck.
Unlock Deck
k this deck
54
If a data set has 16 values and a standard deviation 9.4, then the variance is ________.
A) 88.4
B) 2.3
C) 22.1
D) 37.6
A) 88.4
B) 2.3
C) 22.1
D) 37.6
Unlock Deck
Unlock for access to all 73 flashcards in this deck.
Unlock Deck
k this deck
55
______________ divide a distribution into four groups, and __________divide a distribution into ten groups.
Unlock Deck
Unlock for access to all 73 flashcards in this deck.
Unlock Deck
k this deck
56
According to Chebyshev's theorem, the maximum proportion of data values from a data set that are more than 1.5 standard deviations from the mean is _________.
A) 0.67
B) 0.17
C) 1.33
D) 0.44
A) 0.67
B) 0.17
C) 1.33
D) 0.44
Unlock Deck
Unlock for access to all 73 flashcards in this deck.
Unlock Deck
k this deck
57
Given that the mean of a set of data is 25 and the standard deviation is 3, what is the coefficient of variation?
A) 0.12
B) 12%
C) 8.33
D) 833%
A) 0.12
B) 12%
C) 8.33
D) 833%
Unlock Deck
Unlock for access to all 73 flashcards in this deck.
Unlock Deck
k this deck
58
For a set of data with a mean of 12 and a variance of 25, approximately 68% of the values will fall between 7 to 17.
Unlock Deck
Unlock for access to all 73 flashcards in this deck.
Unlock Deck
k this deck
59
If a set of data has 81 values with a variance of 26.0, then the standard deviation is _________.
A) 2.9
B) 0.6
C) 0.3
D) 5.1
A) 2.9
B) 0.6
C) 0.3
D) 5.1
Unlock Deck
Unlock for access to all 73 flashcards in this deck.
Unlock Deck
k this deck
60
The average resident of Metro City produces 640 pounds of solid waste each year, and the standard deviation is approximately 90 pounds. Use Chebyshev's theorem to find the weight range that contains at least 75% of all residents' annual garbage weights.
A) Between 550 and 730 pounds
B) Between 280 and 1000 pounds
C) Between 370 and 910 pounds
D) Between 460 and 820 pounds
A) Between 550 and 730 pounds
B) Between 280 and 1000 pounds
C) Between 370 and 910 pounds
D) Between 460 and 820 pounds
Unlock Deck
Unlock for access to all 73 flashcards in this deck.
Unlock Deck
k this deck
61
Given the following boxplot where m is the median value, what statement could be made about the distribution of the data?
A) The distribution is approximately symmetric.
B) The distribution is positively skewed.
C) The distribution is negatively skewed.
D) The data are nominal and consequently can not be identified as symmetric or skewed.
A) The distribution is approximately symmetric.
B) The distribution is positively skewed.
C) The distribution is negatively skewed.
D) The data are nominal and consequently can not be identified as symmetric or skewed.
Unlock Deck
Unlock for access to all 73 flashcards in this deck.
Unlock Deck
k this deck
62
Which plot below has a five-number summary of 5, 7, 8, 12, 13 and an interquartile range of 5?
A)
B)
C)
D)
A)
B)
C)
D)
Unlock Deck
Unlock for access to all 73 flashcards in this deck.
Unlock Deck
k this deck
63
Check the following data set for outliers.
43, 52, 54, 54, 56, 57, 59, 61
43, 52, 54, 54, 56, 57, 59, 61
Unlock Deck
Unlock for access to all 73 flashcards in this deck.
Unlock Deck
k this deck
64
The data shown represents the high scores for members of a bowling league over a particular season. Find the approximate percentile rank of a score of 266 by constructing a percentile graph.
A) 77
B) 72
C) 67
D) 62
A) 77
B) 72
C) 67
D) 62
Unlock Deck
Unlock for access to all 73 flashcards in this deck.
Unlock Deck
k this deck
65
Using the table below, what grade would a student who ranked in the 50th percentile receive.
A) B
B) C
C) D
D) F
A) B
B) C
C) D
D) F
Unlock Deck
Unlock for access to all 73 flashcards in this deck.
Unlock Deck
k this deck
66
The average weekly earnings in dollars for various industries are listed below. Find the percentile rank of 604.
701, 604, 538, 625, 574, 659, 735, 513, 789, 847
A) 25th
B) 45th
C) 40th
D) 35th
701, 604, 538, 625, 574, 659, 735, 513, 789, 847
A) 25th
B) 45th
C) 40th
D) 35th
Unlock Deck
Unlock for access to all 73 flashcards in this deck.
Unlock Deck
k this deck
67
The average weight of adult male bison in a particular federal wildlife preserve is 1650 pounds with a standard deviation of 250 pounds. Find the weight of an adult bull whose z-score is -0.5.
A) 1775 lb
B) 1525 lb
C) 1400 lb
D) 1650 lb
A) 1775 lb
B) 1525 lb
C) 1400 lb
D) 1650 lb
Unlock Deck
Unlock for access to all 73 flashcards in this deck.
Unlock Deck
k this deck
68
The size of the box in a boxplot shows the ____________________ of the data set.
A) difference between the mean and the median
B) variance
C) skewness
D) interquartile range
A) difference between the mean and the median
B) variance
C) skewness
D) interquartile range
Unlock Deck
Unlock for access to all 73 flashcards in this deck.
Unlock Deck
k this deck
69
Given the following data set, find the approximate value that corresponds to the 75th percentile.
10, 44, 15, 23, 14, 18, 72, 56
10, 44, 15, 23, 14, 18, 72, 56
Unlock Deck
Unlock for access to all 73 flashcards in this deck.
Unlock Deck
k this deck
70
A five-number summary of a data set consists of the minimum, , the median, , and the maximum.
, the median, , and the maximum. Unlock Deck
Unlock for access to all 73 flashcards in this deck.
Unlock Deck
k this deck
71
If a student scored 75 points on a test where the mean score was 83.5 and the standard deviation was 6.1. The student's z score is ________.
A) 13.69
B) 0.23
C) -0.23
D) -1.39
A) 13.69
B) 0.23
C) -0.23
D) -1.39
Unlock Deck
Unlock for access to all 73 flashcards in this deck.
Unlock Deck
k this deck
72
Make a boxplot for the following data set.
24, 15, 34, 92, 68, 34, 78, 45, 53, 67, 83, 46
24, 15, 34, 92, 68, 34, 78, 45, 53, 67, 83, 46
Unlock Deck
Unlock for access to all 73 flashcards in this deck.
Unlock Deck
k this deck
73
Identify the five-number summary of the following data set.
7, 11, 21, 28, 32, 33, 37, 43.
A) 7, 16, 30, 35, 43
B) 7, 21, 30, 33, 43
C) 7, 11, 28, 33, 43
D) 7, 21, 26.5, 33, 43
7, 11, 21, 28, 32, 33, 37, 43.
A) 7, 16, 30, 35, 43
B) 7, 21, 30, 33, 43
C) 7, 11, 28, 33, 43
D) 7, 21, 26.5, 33, 43
Unlock Deck
Unlock for access to all 73 flashcards in this deck.
Unlock Deck
k this deck
Unlock Deck
Unlock for access to all 73 flashcards in this deck.


