Exam 3: Data Description
Exam 1: The Nature of Probability and Statistics47 Questions
Exam 2: Frequency Distributions and Graphs73 Questions
Exam 3: Data Description73 Questions
Exam 4: Probability and Counting Rules85 Questions
Exam 5: Discrete Probability Distributions69 Questions
Exam 6: The Normal Distribution81 Questions
Exam 7: Confidence Intervals and Sample Size75 Questions
Exam 8: Hypothesis Testing83 Questions
Exam 9: Testing the Difference Between Two Means, Two Variances, and Two Proportions70 Questions
Exam 10: Correlation and Regression63 Questions
Exam 11: Other Chi-Square Tests47 Questions
Exam 12: Analysis of Variance54 Questions
Exam 13: Nonparametric Statistics63 Questions
Exam 14: Sampling and Simulation58 Questions
Select questions type
Using the table below, what grade would a student who ranked in the 50th percentile receive. 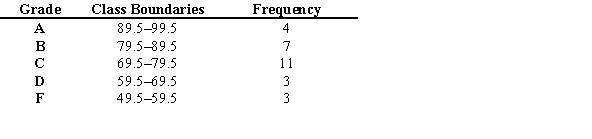
Free
(Multiple Choice)
4.8/5  (35)
(35)
Correct Answer: Verified
B
______________ are either extremely high or extremely low data values compared with the rest of the data.
Free
(Short Answer)
4.8/5 (29)
Correct Answer:Verified
Outliers
A ______________ is the midpoint in a data array.
Free
(Short Answer)
4.7/5 (28)
Correct Answer:Verified
median
The interquartile range IQR is found by subtracting the mean from the maximum value of a data set.
(True/False)
4.7/5 (32)
A recent survey of a new diet cola reported the following percentages of people who liked the taste. Find the weighted mean of the percentages. 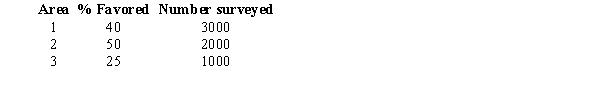
(Multiple Choice)
4.8/5 (31)
What is the midrange of the following data set?
1, 7, 6, 8, 0, 8, 14, 14, 14
(Multiple Choice)
4.9/5 (33)
What is the median of the following set of values?
10, 8, 5, 3, 14
(Multiple Choice)
4.8/5 (39)
The coefficient of variation for a data set is the mean divided by the standard deviation, expressed as a percentage.
(True/False)
4.8/5 (37)
Identify the five-number summary of the following data set.
7, 11, 21, 28, 32, 33, 37, 43.
(Multiple Choice)
4.8/5 (25)
Find the mean, mode, median, and midrange for the following data set.
12, 15, 18, 18, 15, 22, 15, 30, 12
(Essay)
4.9/5 (38)
If a data set has 16 values and a standard deviation 9.4, then the variance is ________.
(Multiple Choice)
4.8/5 (41)
A distribution in which approximately 68% of the data values fall within one standard deviation of the mean behaves according to
(Multiple Choice)
4.9/5 (31)
The average age of Stokes County school board members over the last 40 years has been 55, but members have ranged from 32 to 70. Use the range rule of thumb to estimate the standard deviation of the members' ages.
(Multiple Choice)
4.9/5 (31)
According to Chebyshev's theorem, the maximum proportion of data values from a data set that are more than 1.5 standard deviations from the mean is _________.
(Multiple Choice)
5.0/5 (34)
What is the mean of the following data set?
6, 10, 13, 14, 15
(Multiple Choice)
4.7/5 (27)
For a set of data with a mean of 12 and a variance of 25, approximately 68% of the values will fall between 7 to 17.
(True/False)
4.8/5 (30)
What is the mode of the following data set?
8, 22, 20, 16, 20, 18, 15
(Multiple Choice)
4.9/5 (32)
Filters
- Essay(0)
- Multiple Choice(0)
- Short Answer(0)
- True False(0)
- Matching(0)