Deck 1: Why Is My Evil Lecturer Forcing Me to Learn Statistics
Full screen (f)
Question
Question
Question
What does the data in the chart demonstrate? 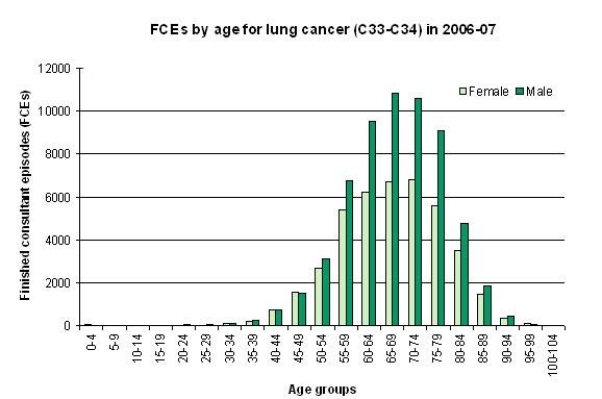
A) The incidence of cancer is highest among women aged 55-59.
B) The incidence of childhood cancer is highest in girls.
C) Cancer affects everyone.
D) A higher incidence of cancer occurs in men across most age groups.
A) The incidence of cancer is highest among women aged 55-59.
B) The incidence of childhood cancer is highest in girls.
C) Cancer affects everyone.
D) A higher incidence of cancer occurs in men across most age groups.
Question
Question
Question
Question
Based on the following chart, the statement that lung cancer is more common in people over 40 could be considered as which of the following? 
A) Null hypothesis
B) Alternative hypothesis
C) Experimental hypothesis
D) Hypothesis
A) Null hypothesis
B) Alternative hypothesis
C) Experimental hypothesis
D) Hypothesis
Question
Question
Looking at the distribution of data on the bar chart below, how best can it be described? 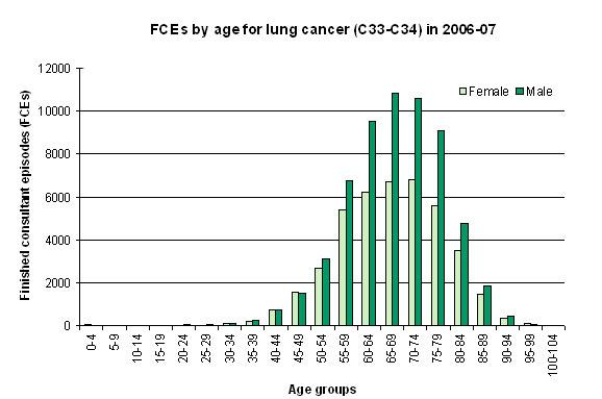
A) Normally distributed
B) Negatively skewed
C) Positively skewed
D) Leptokurtic
A) Normally distributed
B) Negatively skewed
C) Positively skewed
D) Leptokurtic

Unlock Deck
Sign up to unlock the cards in this deck!
Unlock Deck
Unlock Deck
1/9
Play
Full screen (f)
Deck 1: Why Is My Evil Lecturer Forcing Me to Learn Statistics
1
To answer this question visit HYPERLINK "http://www.performance.doh.gov.uk/hospitalactivity/data_requests/download/total_time_ae/ae_08_q4_pt3.xls" http://www.performance.doh.gov.uk/hospitalactivity/data_requests/download/total_time_ae/ae_08_q4_pt3.xls.
The Department of Health has numerous tables of health related data. Which strategic health authority has figures closest to the mean in terms of percentage of patients who spent less than 4 hours in A&E? (Do not include walk-in centres, but use data for types 1, 2 and 3.)
A) Yorkshire and the Humber
B) South Central
C) East Midlands
D) London
East Midlands
2
Quantitative research involves the use of which of the following?
A) Language
B) Letters
C) Numbers
D) Description
A) Language
B) Letters
C) Numbers
D) Description
Numbers
3
What does the data in the chart demonstrate?
A) The incidence of cancer is highest among women aged 55-59.
B) The incidence of childhood cancer is highest in girls.
C) Cancer affects everyone.
D) A higher incidence of cancer occurs in men across most age groups.
A) The incidence of cancer is highest among women aged 55-59.
B) The incidence of childhood cancer is highest in girls.
C) Cancer affects everyone.
D) A higher incidence of cancer occurs in men across most age groups.
A higher incidence of cancer occurs in men across most age groups.
4
The research process is comprised of five stages. Which of the following is not one of those stages?
A) Data collection
B) Generate theory
C) Analysis
D) Dispersion
A) Data collection
B) Generate theory
C) Analysis
D) Dispersion
Unlock Deck
Unlock for access to all 9 flashcards in this deck.
Unlock Deck
k this deck
5
To answer this question visit HYPERLINK "http://www.performance.doh.gov.uk/hospitalactivity/data_requests/download/total_time_ae/ae_08_q4_pt3.xls" http://www.performance.doh.gov.uk/hospitalactivity/data_requests/download/total_time_ae/ae_08_q4_pt3.xls.
Using the data obtained for 2007-2008 January to March (Q4) relating to attendance at A&E departments (see appendix 1), what is the mode?
A) 96.75%
B) 97.75%
C) 97.7%
D) 97.8%
Using the data obtained for 2007-2008 January to March (Q4) relating to attendance at A&E departments (see appendix 1), what is the mode?
A) 96.75%
B) 97.75%
C) 97.7%
D) 97.8%
Unlock Deck
Unlock for access to all 9 flashcards in this deck.
Unlock Deck
k this deck
6
To answer this question visit HYPERLINK "http://www.performance.doh.gov.uk/hospitalactivity/data_requests/download/total_time_ae/ae_08_q4_pt3.xls" http://www.performance.doh.gov.uk/hospitalactivity/data_requests/download/total_time_ae/ae_08_q4_pt3.xls.
Using the data obtained for 2007-2008 January to March (Q4) relating to attendance at A&E departments (see appendix 1), what is the median percentage of patients who spent less than 4 hours in A&E (not including walk in centres)?
A) 96.75%
B) 97.75%
C) 97.7%
D) 97.8%
Using the data obtained for 2007-2008 January to March (Q4) relating to attendance at A&E departments (see appendix 1), what is the median percentage of patients who spent less than 4 hours in A&E (not including walk in centres)?
A) 96.75%
B) 97.75%
C) 97.7%
D) 97.8%
Unlock Deck
Unlock for access to all 9 flashcards in this deck.
Unlock Deck
k this deck
7
Based on the following chart, the statement that lung cancer is more common in people over 40 could be considered as which of the following?
A) Null hypothesis
B) Alternative hypothesis
C) Experimental hypothesis
D) Hypothesis
A) Null hypothesis
B) Alternative hypothesis
C) Experimental hypothesis
D) Hypothesis
Unlock Deck
Unlock for access to all 9 flashcards in this deck.
Unlock Deck
k this deck
8
To answer this question visit HYPERLINK "http://www.performance.doh.gov.uk/hospitalactivity/data_requests/download/total_time_ae/ae_08_q4_pt3.xls" http://www.performance.doh.gov.uk/hospitalactivity/data_requests/download/total_time_ae/ae_08_q4_pt3.xls.
Using the data obtained for 2007-2008 January to March (Q4) relating to attendance at A&E departments (see appendix 1), calculate the range.
A) 2.1
B) 2.2
C) 2.3
D) 2.4
Using the data obtained for 2007-2008 January to March (Q4) relating to attendance at A&E departments (see appendix 1), calculate the range.
A) 2.1
B) 2.2
C) 2.3
D) 2.4
Unlock Deck
Unlock for access to all 9 flashcards in this deck.
Unlock Deck
k this deck
9
Looking at the distribution of data on the bar chart below, how best can it be described?
A) Normally distributed
B) Negatively skewed
C) Positively skewed
D) Leptokurtic
A) Normally distributed
B) Negatively skewed
C) Positively skewed
D) Leptokurtic
Unlock Deck
Unlock for access to all 9 flashcards in this deck.
Unlock Deck
k this deck
Unlock Deck
Unlock for access to all 9 flashcards in this deck.


