Exam 1: Why Is My Evil Lecturer Forcing Me to Learn Statistics
Exam 1: Why Is My Evil Lecturer Forcing Me to Learn Statistics9 Questions
Exam 2: The Spine of Statistics25 Questions
Exam 3: The Phoenix of Statistics16 Questions
Exam 4: The Ibm Spss Statistics Environment25 Questions
Exam 5: Exploring Data With Graphs12 Questions
Exam 6: The Beast of Bias23 Questions
Exam 7: Non-Parametric Models20 Questions
Exam 8: Correlation23 Questions
Exam 9: The Linear Model Regression20 Questions
Exam 10: Comparing Two Means25 Questions
Exam 11: Moderation, Mediation and Multicategory Predictors16 Questions
Exam 12: Glm 1: Comparing Several Independent Means22 Questions
Exam 13: Glm 2: Comparing Means Adjusted for Other Predictors Analysis of Covariance25 Questions
Exam 14: Glm 3: Factorial Designs25 Questions
Exam 15: Glm 4: Repeated-Measures Designs24 Questions
Exam 16: Glm 5: Mixed Designs17 Questions
Exam 17: Multivariate Analysis of Variance Manova19 Questions
Exam 18: Exploratory Factor Analysis22 Questions
Exam 19: Categorical Outcomes: Chi-Square and Loglinear Analysis24 Questions
Exam 20: Categorical Outcomes: Logistic Regression24 Questions
Exam 21: Multilevel Linear Models9 Questions
Select questions type
To answer this question visit HYPERLINK "http://www.performance.doh.gov.uk/hospitalactivity/data_requests/download/total_time_ae/ae_08_q4_pt3.xls" http://www.performance.doh.gov.uk/hospitalactivity/data_requests/download/total_time_ae/ae_08_q4_pt3.xls.
Using the data obtained for 2007-2008 January to March (Q4) relating to attendance at A&E departments (see appendix 1), what is the median percentage of patients who spent less than 4 hours in A&E (not including walk in centres)?
Free
(Multiple Choice)
4.8/5  (39)
(39)
Correct Answer: Verified
B
What does the data in the chart demonstrate? 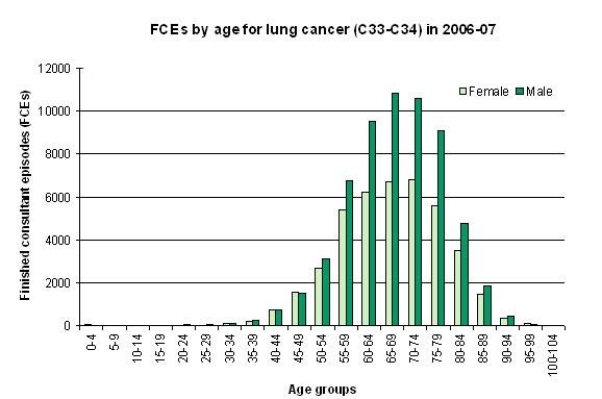
Free
(Multiple Choice)
4.7/5 (30)
Correct Answer:Verified
D
To answer this question visit HYPERLINK "http://www.performance.doh.gov.uk/hospitalactivity/data_requests/download/total_time_ae/ae_08_q4_pt3.xls" http://www.performance.doh.gov.uk/hospitalactivity/data_requests/download/total_time_ae/ae_08_q4_pt3.xls.
The Department of Health has numerous tables of health related data. Which strategic health authority has figures closest to the mean in terms of percentage of patients who spent less than 4 hours in A&E? (Do not include walk-in centres, but use data for types 1, 2 and 3.)
Free
(Multiple Choice)
4.8/5 (29)
Correct Answer:Verified
C
Looking at the distribution of data on the bar chart below, how best can it be described? 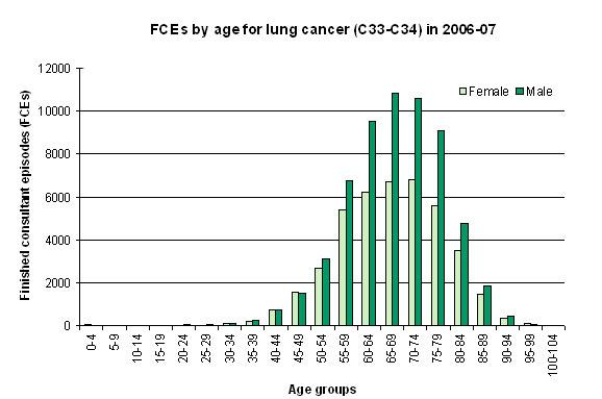
(Multiple Choice)
4.7/5 (32)
Quantitative research involves the use of which of the following?
(Multiple Choice)
4.7/5 (40)
To answer this question visit HYPERLINK "http://www.performance.doh.gov.uk/hospitalactivity/data_requests/download/total_time_ae/ae_08_q4_pt3.xls" http://www.performance.doh.gov.uk/hospitalactivity/data_requests/download/total_time_ae/ae_08_q4_pt3.xls.
Using the data obtained for 2007-2008 January to March (Q4) relating to attendance at A&E departments (see appendix 1), what is the mode?
(Multiple Choice)
4.7/5 (42)
Based on the following chart, the statement that lung cancer is more common in people over 40 could be considered as which of the following? 
(Multiple Choice)
4.9/5 (40)
To answer this question visit HYPERLINK "http://www.performance.doh.gov.uk/hospitalactivity/data_requests/download/total_time_ae/ae_08_q4_pt3.xls" http://www.performance.doh.gov.uk/hospitalactivity/data_requests/download/total_time_ae/ae_08_q4_pt3.xls.
Using the data obtained for 2007-2008 January to March (Q4) relating to attendance at A&E departments (see appendix 1), calculate the range.
(Multiple Choice)
4.8/5 (29)
The research process is comprised of five stages. Which of the following is not one of those stages?
(Multiple Choice)
4.8/5 (35)
Filters
- Essay(0)
- Multiple Choice(0)
- Short Answer(0)
- True False(0)
- Matching(0)