Deck 5: Exploring Data With Graphs
Full screen (f)
Question
The following figure is drawn from Schoenborn, C. A. and Adams, P. F. (2008, May). Sleep duration as a correlate of smoking, alcohol use, leisure-time physical inactivity, and obesity among adults: United States, 2004-2006. Hyattsville, MD: National Center for Health Statistics. It is available via HYPERLINK "http://www.cdc.gov/nchs" http://www.cdc.gov/nchs. What type of bar charts are shown in the figure? 
A) Stacked bar charts
B) Clustered bar charts
C) Clustered bar charts with error bars
D) None of the above
A) Stacked bar charts
B) Clustered bar charts
C) Clustered bar charts with error bars
D) None of the above
Question
Question
What conclusion can be drawn from the data provided in the figure below in relation to sleep and cigarette smoking? 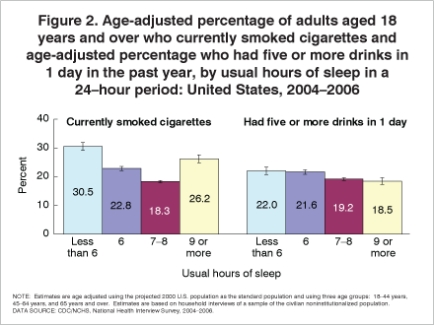
A) Those who smoked least slept least.
B) Those who smoked most slept least.
C) Those who smoked most slept most.
D) Those who smoked least slept most.
A) Those who smoked least slept least.
B) Those who smoked most slept least.
C) Those who smoked most slept most.
D) Those who smoked least slept most.
Question
What does this graph tell you about those who had five or more drinks in one day? 
A) Those who drank most, slept most.
B) Those who drank least, slept least.
C) Those who drank most, slept least.
D) None of the above.
A) Those who drank most, slept most.
B) Those who drank least, slept least.
C) Those who drank most, slept least.
D) None of the above.
Question
What conclusion can be drawn from the boxplot below? 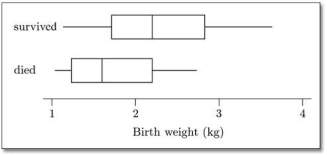
A) More infants with SIRDS survived than died.
B) Infant survival in cases of SIRDS is related to birthweight.
C) Deaths of SIRDS were higher than survivors.
D) None of the above.
A) More infants with SIRDS survived than died.
B) Infant survival in cases of SIRDS is related to birthweight.
C) Deaths of SIRDS were higher than survivors.
D) None of the above.
Question
What type of graph is shown below? 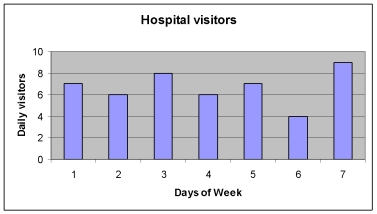
A) Frequency polygon
B) Stacked histogram
C) Simple histogram
D) Frequency distribution
A) Frequency polygon
B) Stacked histogram
C) Simple histogram
D) Frequency distribution
Question
What statement best describes what is shown in the graph below? 
A) There were 46 hospital visitors visiting during the week.
B) There were 48 visitors to the hospital in a week.
C) Day 1 is the most popular day for visiting.
D) Day 6 has the least number of visitors.
A) There were 46 hospital visitors visiting during the week.
B) There were 48 visitors to the hospital in a week.
C) Day 1 is the most popular day for visiting.
D) Day 6 has the least number of visitors.
Question
What could be done to make the information in this graph more clear? 
A) Use a stacked histogram.
B) Identify actual days of the week rather than just number.
C) Use a population pyramid.
D) Identify if visitors were male, female or children and who they were visiting.
A) Use a stacked histogram.
B) Identify actual days of the week rather than just number.
C) Use a population pyramid.
D) Identify if visitors were male, female or children and who they were visiting.
Question
Question
What does the information in the following boxplot tell you about the surviving infants of severe idiopathic respiratory distress syndrome? 
 Birthweights of infants with severe idiopathic respiratory distress syndrome (SIRDS)
A) The median birthweight is lower for those who died.
B) The mean birthweight is higher for those who survived.
C) The median birthweight is greater than those who died.
D) The mean birthweight is lower for those who survived.
Birthweights of infants with severe idiopathic respiratory distress syndrome (SIRDS)A) The median birthweight is lower for those who died.
B) The mean birthweight is higher for those who survived.
C) The median birthweight is greater than those who died.
D) The mean birthweight is lower for those who survived.
Question
Question

Unlock Deck
Sign up to unlock the cards in this deck!
Unlock Deck
Unlock Deck
1/12
Play
Full screen (f)
Deck 5: Exploring Data With Graphs
1
The following figure is drawn from Schoenborn, C. A. and Adams, P. F. (2008, May). Sleep duration as a correlate of smoking, alcohol use, leisure-time physical inactivity, and obesity among adults: United States, 2004-2006. Hyattsville, MD: National Center for Health Statistics. It is available via HYPERLINK "http://www.cdc.gov/nchs" http://www.cdc.gov/nchs. What type of bar charts are shown in the figure?
A) Stacked bar charts
B) Clustered bar charts
C) Clustered bar charts with error bars
D) None of the above
A) Stacked bar charts
B) Clustered bar charts
C) Clustered bar charts with error bars
D) None of the above
Clustered bar charts with error bars
2
I collected some data about how much buyers of my book liked it (on a scale of 1 = it's utter rubbish to 10 = I never read anything else). I ended up with a sample of 15,467 people. When I looked at the distribution, I found a skew of 1.23 (SE = 0.65). The mean rating was 4.78. What is the z-score for the skew of my data?
A) 1.89
B) 0.53
C) -3.92
D) 3.36
A) 1.89
B) 0.53
C) -3.92
D) 3.36
1.89
3
What conclusion can be drawn from the data provided in the figure below in relation to sleep and cigarette smoking?
A) Those who smoked least slept least.
B) Those who smoked most slept least.
C) Those who smoked most slept most.
D) Those who smoked least slept most.
A) Those who smoked least slept least.
B) Those who smoked most slept least.
C) Those who smoked most slept most.
D) Those who smoked least slept most.
Those who smoked least slept most.
4
What does this graph tell you about those who had five or more drinks in one day?
A) Those who drank most, slept most.
B) Those who drank least, slept least.
C) Those who drank most, slept least.
D) None of the above.
A) Those who drank most, slept most.
B) Those who drank least, slept least.
C) Those who drank most, slept least.
D) None of the above.
Unlock Deck
Unlock for access to all 12 flashcards in this deck.
Unlock Deck
k this deck
5
What conclusion can be drawn from the boxplot below?
A) More infants with SIRDS survived than died.
B) Infant survival in cases of SIRDS is related to birthweight.
C) Deaths of SIRDS were higher than survivors.
D) None of the above.
A) More infants with SIRDS survived than died.
B) Infant survival in cases of SIRDS is related to birthweight.
C) Deaths of SIRDS were higher than survivors.
D) None of the above.
Unlock Deck
Unlock for access to all 12 flashcards in this deck.
Unlock Deck
k this deck
6
What type of graph is shown below?
A) Frequency polygon
B) Stacked histogram
C) Simple histogram
D) Frequency distribution
A) Frequency polygon
B) Stacked histogram
C) Simple histogram
D) Frequency distribution
Unlock Deck
Unlock for access to all 12 flashcards in this deck.
Unlock Deck
k this deck
7
What statement best describes what is shown in the graph below?
A) There were 46 hospital visitors visiting during the week.
B) There were 48 visitors to the hospital in a week.
C) Day 1 is the most popular day for visiting.
D) Day 6 has the least number of visitors.
A) There were 46 hospital visitors visiting during the week.
B) There were 48 visitors to the hospital in a week.
C) Day 1 is the most popular day for visiting.
D) Day 6 has the least number of visitors.
Unlock Deck
Unlock for access to all 12 flashcards in this deck.
Unlock Deck
k this deck
8
What could be done to make the information in this graph more clear?
A) Use a stacked histogram.
B) Identify actual days of the week rather than just number.
C) Use a population pyramid.
D) Identify if visitors were male, female or children and who they were visiting.
A) Use a stacked histogram.
B) Identify actual days of the week rather than just number.
C) Use a population pyramid.
D) Identify if visitors were male, female or children and who they were visiting.
Unlock Deck
Unlock for access to all 12 flashcards in this deck.
Unlock Deck
k this deck
9
Which of the following is not recommended when displaying information graphically?
A) Minimum use of ink
B) Use of 3-D effects
C) Informative labelling of each axis
D) Minimizing the number of distractions
A) Minimum use of ink
B) Use of 3-D effects
C) Informative labelling of each axis
D) Minimizing the number of distractions
Unlock Deck
Unlock for access to all 12 flashcards in this deck.
Unlock Deck
k this deck
10
What does the information in the following boxplot tell you about the surviving infants of severe idiopathic respiratory distress syndrome? Birthweights of infants with severe idiopathic respiratory distress syndrome (SIRDS)
A) The median birthweight is lower for those who died.
B) The mean birthweight is higher for those who survived.
C) The median birthweight is greater than those who died.
D) The mean birthweight is lower for those who survived.
Birthweights of infants with severe idiopathic respiratory distress syndrome (SIRDS)A) The median birthweight is lower for those who died.
B) The mean birthweight is higher for those who survived.
C) The median birthweight is greater than those who died.
D) The mean birthweight is lower for those who survived.
Unlock Deck
Unlock for access to all 12 flashcards in this deck.
Unlock Deck
k this deck
11
Which of the following does a box-whisker plot not display
A) The range
B) The interquartile range
C) The lower quartile
D) The mean
A) The range
B) The interquartile range
C) The lower quartile
D) The mean
Unlock Deck
Unlock for access to all 12 flashcards in this deck.
Unlock Deck
k this deck
12
For which of the following sets of variables would you not use a scatterplot in order to show your data?
A) An individual's rating of pain on a scale and the amount of analgesia taken
B) Raised body temperature and level of depression
C) Numbers of children having measles immunization and incidence of measles illness
D) The number of people attending a nursing home on a Saturday
A) An individual's rating of pain on a scale and the amount of analgesia taken
B) Raised body temperature and level of depression
C) Numbers of children having measles immunization and incidence of measles illness
D) The number of people attending a nursing home on a Saturday
Unlock Deck
Unlock for access to all 12 flashcards in this deck.
Unlock Deck
k this deck
Unlock Deck
Unlock for access to all 12 flashcards in this deck.


